This pipeline computes the correlation between significant copy number variation (cnv focal) genes and selected clinical features.
Testing the association between copy number variation 30 focal events and 9 clinical features across 498 patients, 23 significant findings detected with Q value < 0.25.
-
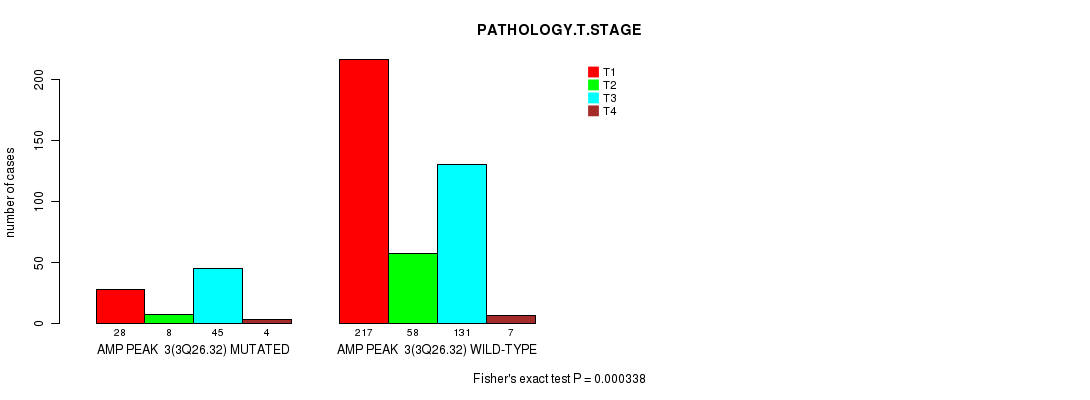
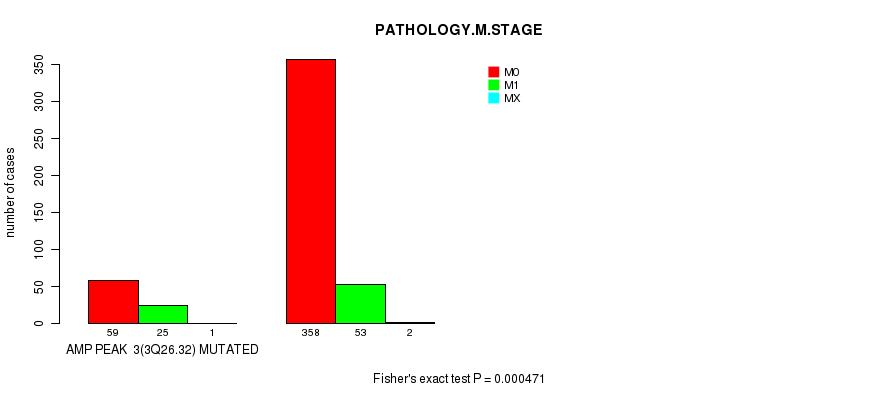
amp_3q26.32 cnv correlated to 'NEOPLASM.DISEASESTAGE', 'PATHOLOGY.T.STAGE', and 'PATHOLOGY.M.STAGE'.
-
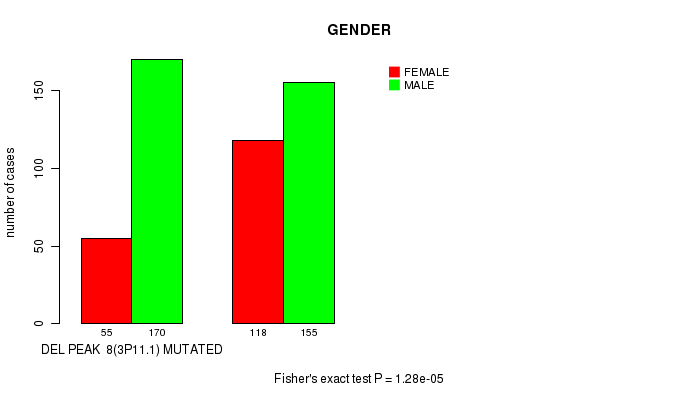
del_3p11.1 cnv correlated to 'GENDER'.
-
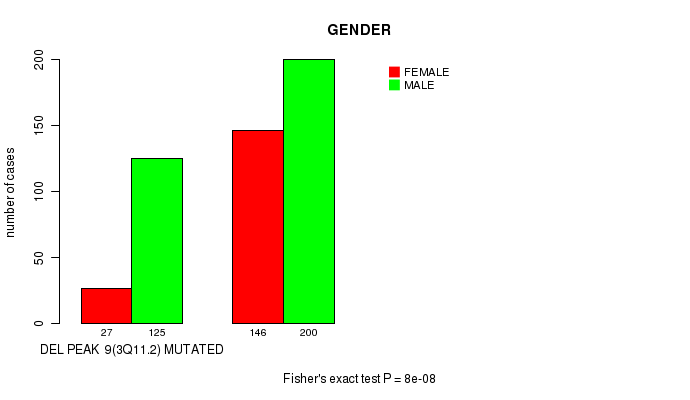
del_3q11.2 cnv correlated to 'GENDER'.
-
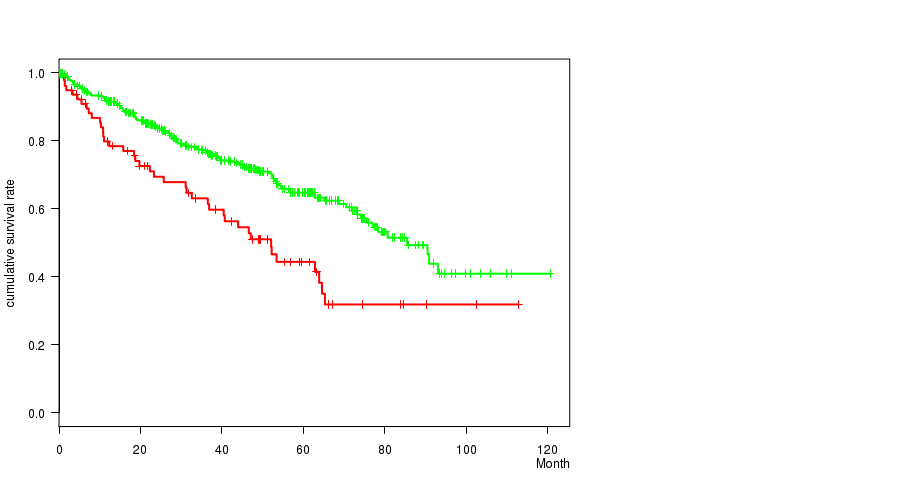
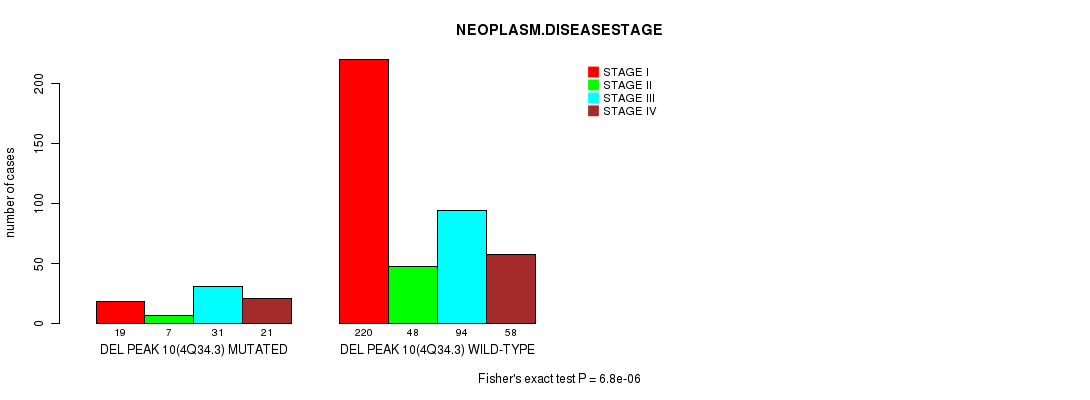
del_4q34.3 cnv correlated to 'Time to Death', 'NEOPLASM.DISEASESTAGE', and 'PATHOLOGY.T.STAGE'.
-
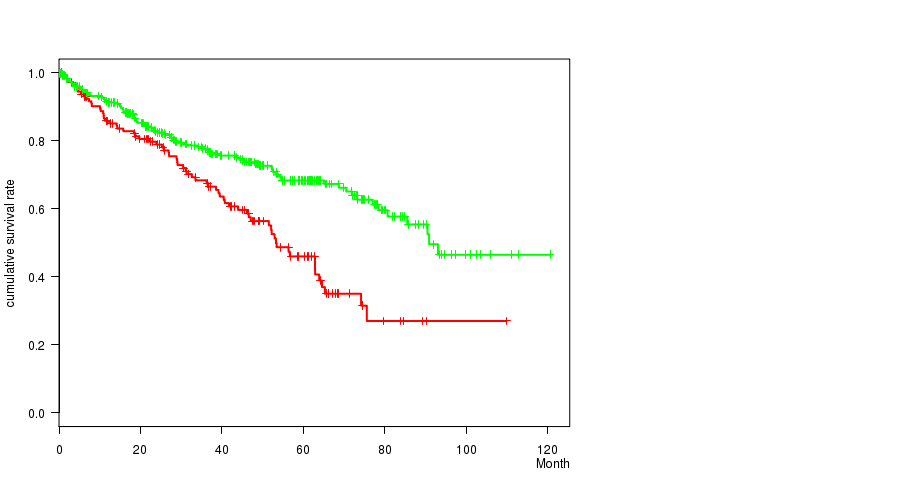
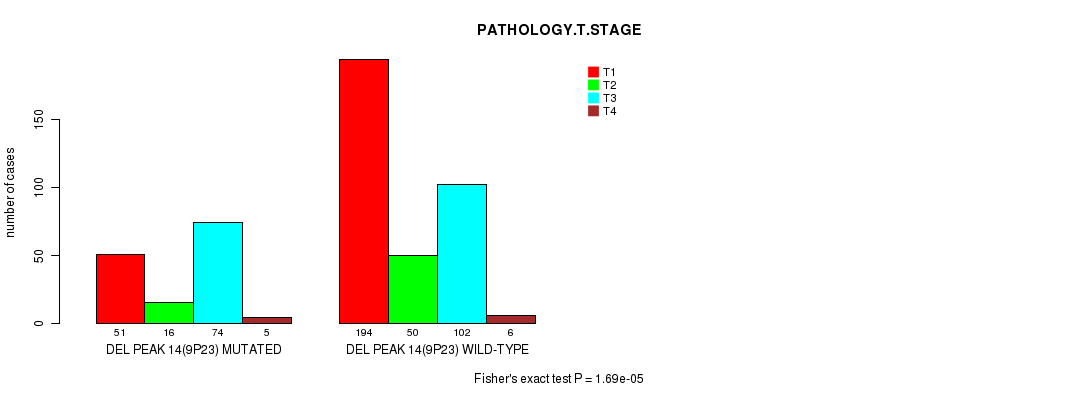
del_9p23 cnv correlated to 'Time to Death', 'NEOPLASM.DISEASESTAGE', and 'PATHOLOGY.T.STAGE'.
-
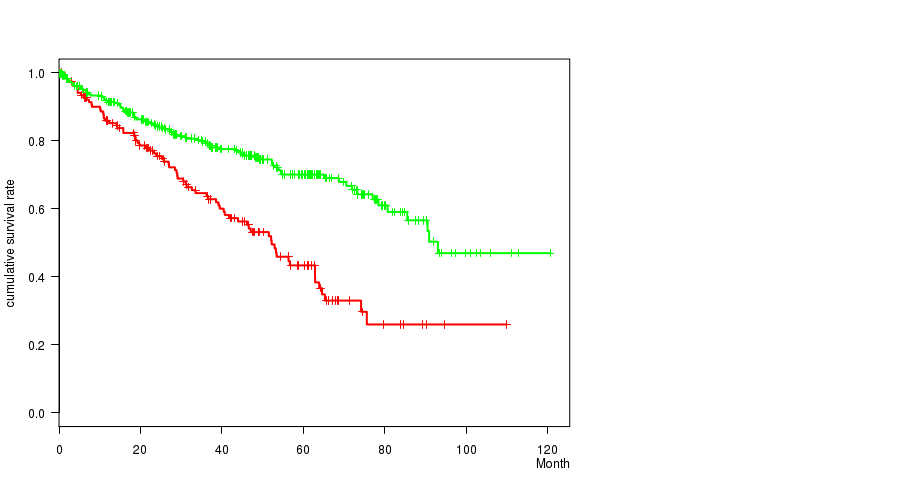
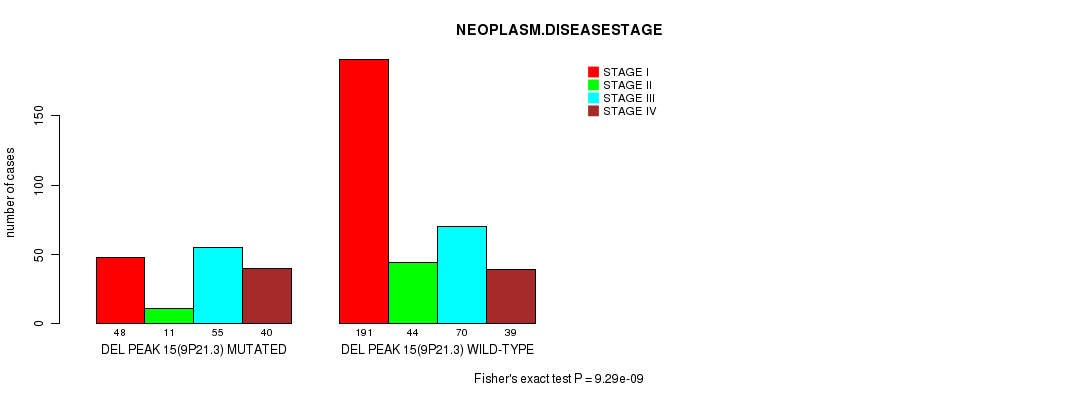
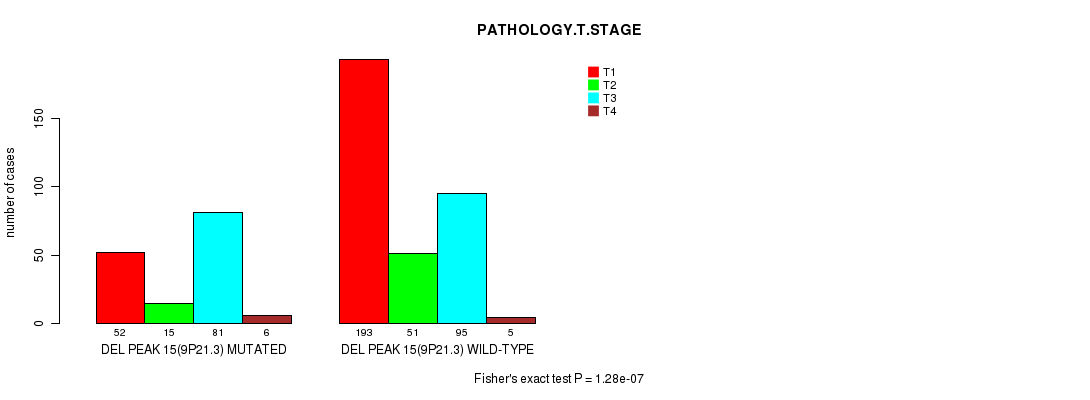
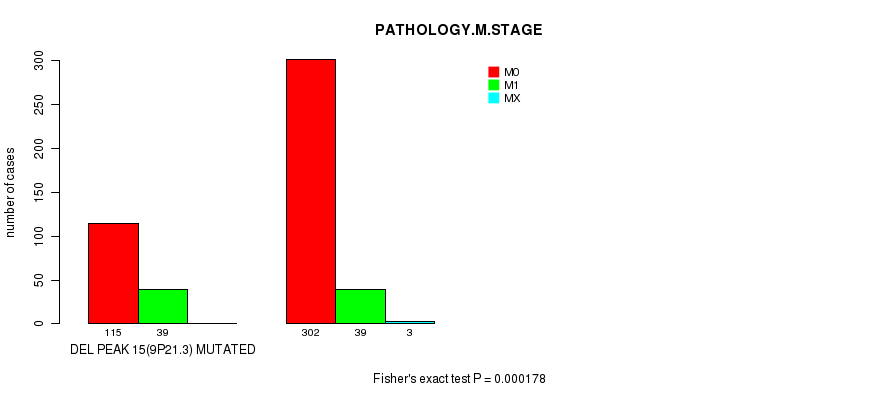
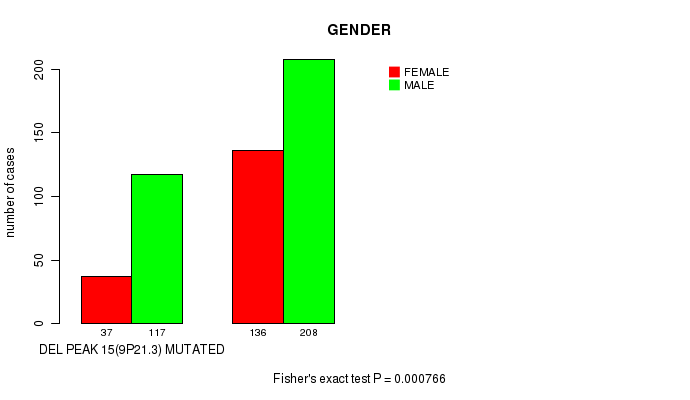
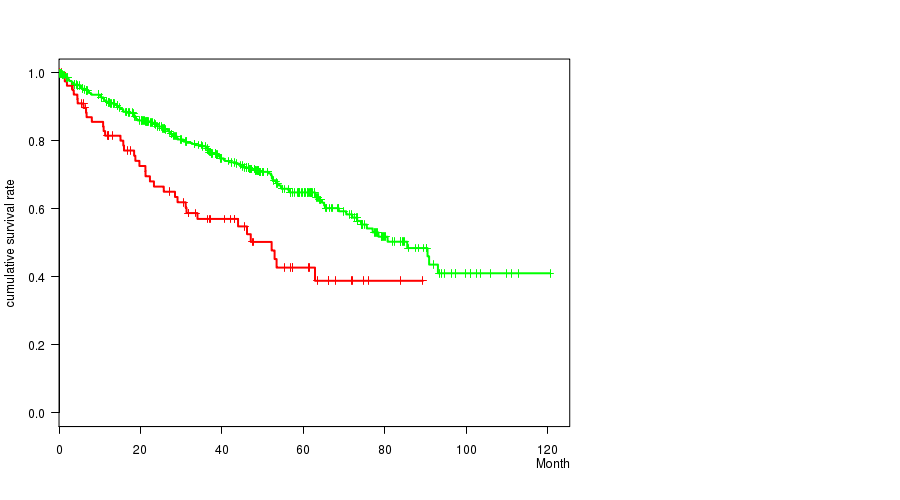
del_9p21.3 cnv correlated to 'Time to Death', 'NEOPLASM.DISEASESTAGE', 'PATHOLOGY.T.STAGE', 'PATHOLOGY.M.STAGE', and 'GENDER'.
-
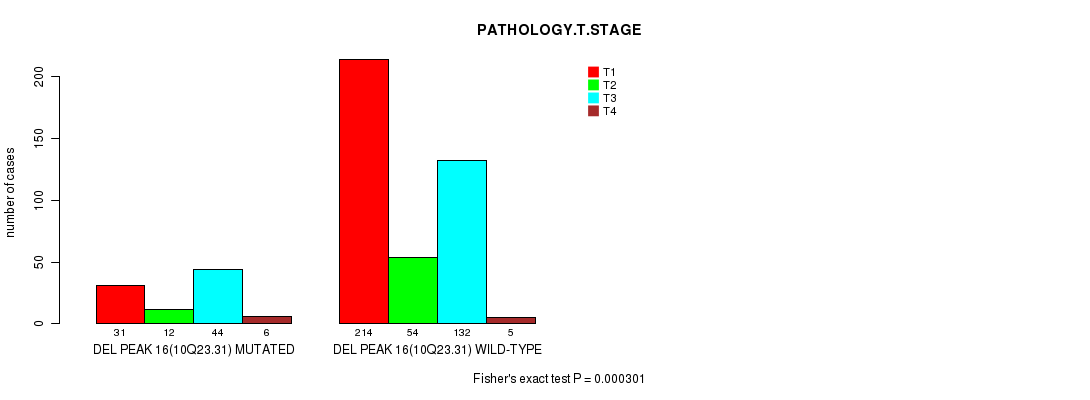
del_10q23.31 cnv correlated to 'PATHOLOGY.T.STAGE'.
-
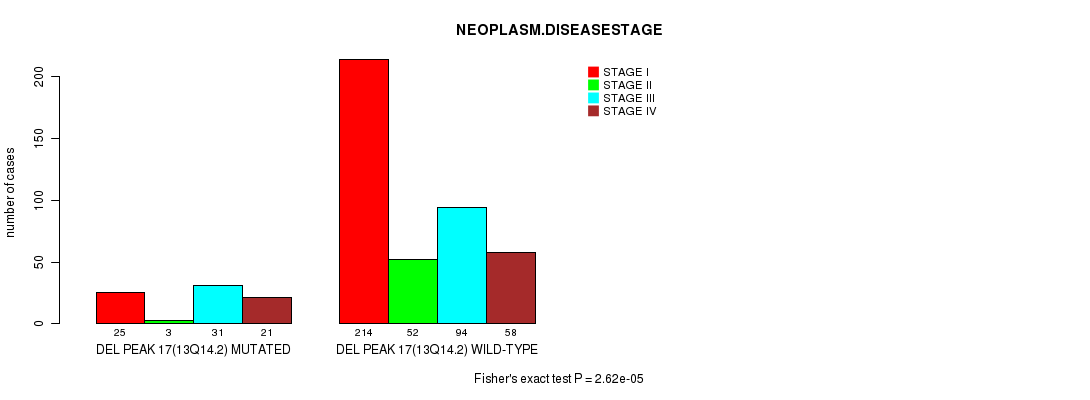
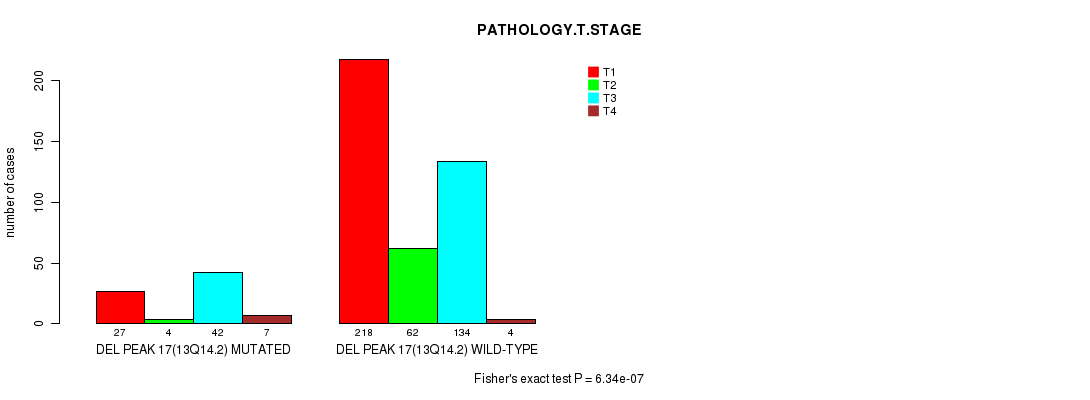
del_13q14.2 cnv correlated to 'Time to Death', 'NEOPLASM.DISEASESTAGE', and 'PATHOLOGY.T.STAGE'.
-
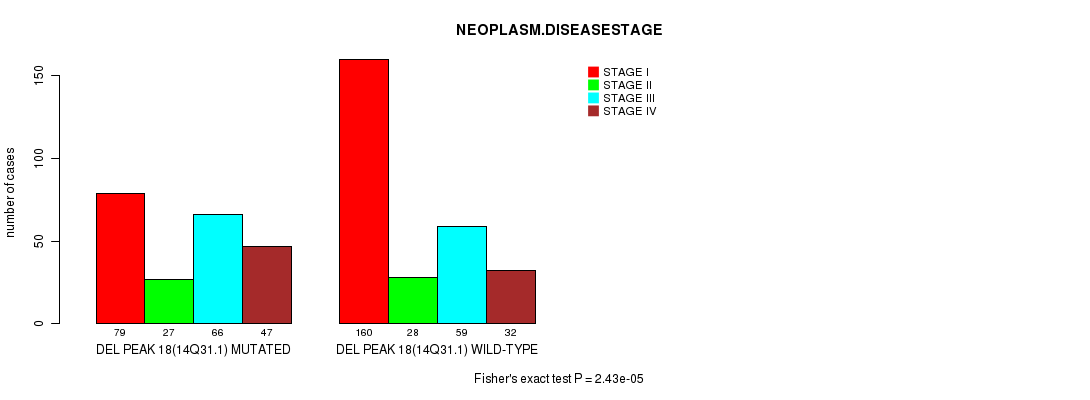
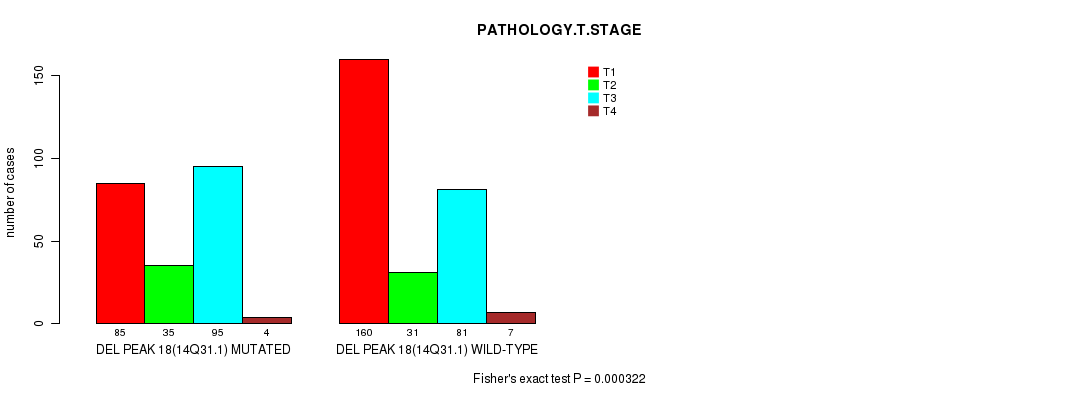
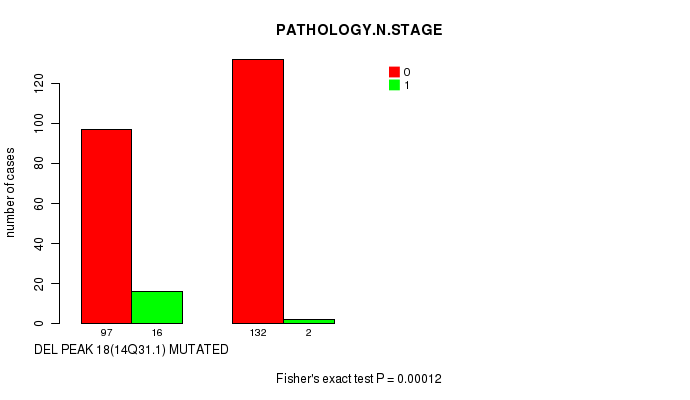
del_14q31.1 cnv correlated to 'NEOPLASM.DISEASESTAGE', 'PATHOLOGY.T.STAGE', and 'PATHOLOGY.N.STAGE'.
Table 1. Get Full Table Overview of the association between significant copy number variation of 30 focal events and 9 clinical features. Shown in the table are P values (Q values). Thresholded by Q value < 0.25, 23 significant findings detected.
|
Clinical Features |
Time to Death |
AGE |
NEOPLASM DISEASESTAGE |
PATHOLOGY T STAGE |
PATHOLOGY N STAGE |
PATHOLOGY M STAGE |
GENDER |
KARNOFSKY PERFORMANCE SCORE |
NUMBERPACKYEARSSMOKED | ||
| nCNV (%) | nWild-Type | logrank test | t-test | Fisher's exact test | Fisher's exact test | Fisher's exact test | Fisher's exact test | Fisher's exact test | t-test | t-test | |
| del 9p21 3 | 154 (31%) | 344 |
2.69e-07 (6.34e-05) |
0.0488 (1.00) |
9.29e-09 (2.22e-06) |
1.28e-07 (3.03e-05) |
0.0296 (1.00) |
0.000178 (0.0401) |
0.000766 (0.166) |
0.576 (1.00) |
|
| amp 3q26 32 | 85 (17%) | 413 |
0.229 (1.00) |
0.951 (1.00) |
0.000187 (0.042) |
0.000338 (0.0744) |
0.0588 (1.00) |
0.000471 (0.103) |
0.534 (1.00) |
0.152 (1.00) |
|
| del 4q34 3 | 78 (16%) | 420 |
0.000308 (0.0683) |
0.678 (1.00) |
6.8e-06 (0.00158) |
6.33e-07 (0.000149) |
0.727 (1.00) |
0.0711 (1.00) |
0.441 (1.00) |
0.193 (1.00) |
|
| del 9p23 | 146 (29%) | 352 |
2.85e-05 (0.00646) |
0.0275 (1.00) |
1.34e-06 (0.000312) |
1.69e-05 (0.00389) |
0.101 (1.00) |
0.00253 (0.535) |
0.00265 (0.556) |
0.576 (1.00) |
|
| del 13q14 2 | 80 (16%) | 418 |
0.000379 (0.0829) |
0.468 (1.00) |
2.62e-05 (0.00598) |
6.34e-07 (0.000149) |
0.212 (1.00) |
0.116 (1.00) |
0.898 (1.00) |
0.669 (1.00) |
|
| del 14q31 1 | 219 (44%) | 279 |
0.00142 (0.305) |
0.0746 (1.00) |
2.43e-05 (0.00557) |
0.000322 (0.0711) |
0.00012 (0.0272) |
0.00136 (0.294) |
0.345 (1.00) |
0.0872 (1.00) |
|
| del 3p11 1 | 225 (45%) | 273 |
0.365 (1.00) |
0.034 (1.00) |
0.538 (1.00) |
0.729 (1.00) |
1 (1.00) |
0.452 (1.00) |
1.28e-05 (0.00296) |
0.851 (1.00) |
|
| del 3q11 2 | 152 (31%) | 346 |
0.593 (1.00) |
0.0241 (1.00) |
0.562 (1.00) |
0.11 (1.00) |
0.599 (1.00) |
0.862 (1.00) |
8e-08 (1.91e-05) |
0.73 (1.00) |
|
| del 10q23 31 | 93 (19%) | 405 |
0.149 (1.00) |
0.406 (1.00) |
0.0117 (1.00) |
0.000301 (0.067) |
1 (1.00) |
0.696 (1.00) |
0.0531 (1.00) |
0.775 (1.00) |
|
| amp 1q24 1 | 61 (12%) | 437 |
0.0427 (1.00) |
0.185 (1.00) |
0.303 (1.00) |
0.199 (1.00) |
0.0826 (1.00) |
0.456 (1.00) |
0.776 (1.00) |
0.499 (1.00) |
|
| amp 1q32 1 | 61 (12%) | 437 |
0.102 (1.00) |
0.0603 (1.00) |
0.207 (1.00) |
0.178 (1.00) |
0.712 (1.00) |
0.563 (1.00) |
0.776 (1.00) |
0.499 (1.00) |
|
| amp 4q32 1 | 16 (3%) | 482 |
0.182 (1.00) |
0.308 (1.00) |
0.676 (1.00) |
0.397 (1.00) |
0.573 (1.00) |
0.752 (1.00) |
0.436 (1.00) |
0.411 (1.00) |
|
| amp 5q35 1 | 318 (64%) | 180 |
0.0399 (1.00) |
0.0802 (1.00) |
0.711 (1.00) |
0.417 (1.00) |
0.31 (1.00) |
0.243 (1.00) |
0.17 (1.00) |
0.944 (1.00) |
|
| amp 7q36 3 | 169 (34%) | 329 |
0.732 (1.00) |
0.818 (1.00) |
0.0207 (1.00) |
0.0608 (1.00) |
0.446 (1.00) |
0.0074 (1.00) |
0.0223 (1.00) |
0.57 (1.00) |
|
| amp 8q24 22 | 77 (15%) | 421 |
0.0695 (1.00) |
0.00864 (1.00) |
0.00423 (0.88) |
0.00295 (0.616) |
0.739 (1.00) |
0.0562 (1.00) |
0.153 (1.00) |
0.297 (1.00) |
|
| amp 10p14 | 20 (4%) | 478 |
0.783 (1.00) |
0.0439 (1.00) |
0.413 (1.00) |
0.0331 (1.00) |
0.214 (1.00) |
0.591 (1.00) |
0.812 (1.00) |
0.887 (1.00) |
|
| amp xp22 2 | 30 (6%) | 468 |
0.588 (1.00) |
0.861 (1.00) |
0.0615 (1.00) |
0.112 (1.00) |
1 (1.00) |
0.267 (1.00) |
0.844 (1.00) |
0.328 (1.00) |
|
| amp xp11 4 | 32 (6%) | 466 |
0.918 (1.00) |
0.981 (1.00) |
0.0501 (1.00) |
0.137 (1.00) |
1 (1.00) |
0.0265 (1.00) |
1 (1.00) |
0.328 (1.00) |
|
| amp xq11 2 | 28 (6%) | 470 |
0.597 (1.00) |
0.257 (1.00) |
0.43 (1.00) |
0.455 (1.00) |
1 (1.00) |
0.094 (1.00) |
1 (1.00) |
0.328 (1.00) |
|
| amp xq28 | 34 (7%) | 464 |
0.566 (1.00) |
0.59 (1.00) |
0.585 (1.00) |
0.78 (1.00) |
1 (1.00) |
0.0606 (1.00) |
0.71 (1.00) |
0.328 (1.00) |
|
| del 1p36 23 | 101 (20%) | 397 |
0.0271 (1.00) |
0.12 (1.00) |
0.414 (1.00) |
0.11 (1.00) |
1 (1.00) |
0.255 (1.00) |
0.162 (1.00) |
0.513 (1.00) |
|
| del 1p31 1 | 75 (15%) | 423 |
0.207 (1.00) |
0.135 (1.00) |
0.687 (1.00) |
0.0412 (1.00) |
0.493 (1.00) |
0.835 (1.00) |
0.0356 (1.00) |
0.513 (1.00) |
|
| del 1q43 | 40 (8%) | 458 |
0.983 (1.00) |
0.673 (1.00) |
1 (1.00) |
0.163 (1.00) |
1 (1.00) |
0.733 (1.00) |
1 (1.00) |
0.484 (1.00) |
|
| del 2q37 3 | 48 (10%) | 450 |
0.679 (1.00) |
0.917 (1.00) |
0.451 (1.00) |
0.654 (1.00) |
1 (1.00) |
0.56 (1.00) |
0.153 (1.00) |
||
| del 3p25 3 | 439 (88%) | 59 |
0.908 (1.00) |
0.501 (1.00) |
0.0683 (1.00) |
0.00211 (0.451) |
1 (1.00) |
0.799 (1.00) |
0.561 (1.00) |
0.0535 (1.00) |
|
| del 3p24 3 | 440 (88%) | 58 |
0.724 (1.00) |
0.528 (1.00) |
0.0797 (1.00) |
0.00245 (0.52) |
1 (1.00) |
0.895 (1.00) |
0.383 (1.00) |
0.0535 (1.00) |
|
| del 3p12 3 | 316 (63%) | 182 |
0.792 (1.00) |
0.963 (1.00) |
0.367 (1.00) |
0.0565 (1.00) |
0.618 (1.00) |
0.425 (1.00) |
0.00244 (0.519) |
0.963 (1.00) |
|
| del 6q26 | 145 (29%) | 353 |
0.757 (1.00) |
0.322 (1.00) |
0.332 (1.00) |
0.565 (1.00) |
0.00889 (1.00) |
0.596 (1.00) |
0.0225 (1.00) |
0.197 (1.00) |
|
| del 6q26 | 145 (29%) | 353 |
0.781 (1.00) |
0.256 (1.00) |
0.332 (1.00) |
0.565 (1.00) |
0.00889 (1.00) |
0.596 (1.00) |
0.0127 (1.00) |
0.197 (1.00) |
|
| del 8p23 2 | 150 (30%) | 348 |
0.0733 (1.00) |
0.171 (1.00) |
0.163 (1.00) |
0.175 (1.00) |
1 (1.00) |
0.246 (1.00) |
0.307 (1.00) |
0.802 (1.00) |
P value = 0.000187 (Fisher's exact test), Q value = 0.042
Table S1. Gene #3: 'amp_3q26.32' versus Clinical Feature #3: 'NEOPLASM.DISEASESTAGE'
| nPatients | STAGE I | STAGE II | STAGE III | STAGE IV |
|---|---|---|---|---|
| ALL | 239 | 55 | 125 | 79 |
| AMP PEAK 3(3Q26.32) MUTATED | 27 | 6 | 27 | 25 |
| AMP PEAK 3(3Q26.32) WILD-TYPE | 212 | 49 | 98 | 54 |
Figure S1. Get High-res Image Gene #3: 'amp_3q26.32' versus Clinical Feature #3: 'NEOPLASM.DISEASESTAGE'

P value = 0.000338 (Fisher's exact test), Q value = 0.074
Table S2. Gene #3: 'amp_3q26.32' versus Clinical Feature #4: 'PATHOLOGY.T.STAGE'
| nPatients | T1 | T2 | T3 | T4 |
|---|---|---|---|---|
| ALL | 245 | 66 | 176 | 11 |
| AMP PEAK 3(3Q26.32) MUTATED | 28 | 8 | 45 | 4 |
| AMP PEAK 3(3Q26.32) WILD-TYPE | 217 | 58 | 131 | 7 |
Figure S2. Get High-res Image Gene #3: 'amp_3q26.32' versus Clinical Feature #4: 'PATHOLOGY.T.STAGE'
P value = 0.000471 (Fisher's exact test), Q value = 0.1
Table S3. Gene #3: 'amp_3q26.32' versus Clinical Feature #6: 'PATHOLOGY.M.STAGE'
| nPatients | M0 | M1 | MX |
|---|---|---|---|
| ALL | 417 | 78 | 3 |
| AMP PEAK 3(3Q26.32) MUTATED | 59 | 25 | 1 |
| AMP PEAK 3(3Q26.32) WILD-TYPE | 358 | 53 | 2 |
Figure S3. Get High-res Image Gene #3: 'amp_3q26.32' versus Clinical Feature #6: 'PATHOLOGY.M.STAGE'
P value = 1.28e-05 (Fisher's exact test), Q value = 0.003
Table S4. Gene #20: 'del_3p11.1' versus Clinical Feature #7: 'GENDER'
| nPatients | FEMALE | MALE |
|---|---|---|
| ALL | 173 | 325 |
| DEL PEAK 8(3P11.1) MUTATED | 55 | 170 |
| DEL PEAK 8(3P11.1) WILD-TYPE | 118 | 155 |
Figure S4. Get High-res Image Gene #20: 'del_3p11.1' versus Clinical Feature #7: 'GENDER'
P value = 8e-08 (Fisher's exact test), Q value = 1.9e-05
Table S5. Gene #21: 'del_3q11.2' versus Clinical Feature #7: 'GENDER'
| nPatients | FEMALE | MALE |
|---|---|---|
| ALL | 173 | 325 |
| DEL PEAK 9(3Q11.2) MUTATED | 27 | 125 |
| DEL PEAK 9(3Q11.2) WILD-TYPE | 146 | 200 |
Figure S5. Get High-res Image Gene #21: 'del_3q11.2' versus Clinical Feature #7: 'GENDER'
P value = 0.000308 (logrank test), Q value = 0.068
Table S6. Gene #22: 'del_4q34.3' versus Clinical Feature #1: 'Time to Death'
| nPatients | nDeath | Duration Range (Median), Month | |
|---|---|---|---|
| ALL | 497 | 166 | 0.1 - 120.6 (37.1) |
| DEL PEAK 10(4Q34.3) MUTATED | 78 | 40 | 0.6 - 112.8 (33.0) |
| DEL PEAK 10(4Q34.3) WILD-TYPE | 419 | 126 | 0.1 - 120.6 (37.2) |
Figure S6. Get High-res Image Gene #22: 'del_4q34.3' versus Clinical Feature #1: 'Time to Death'
P value = 6.8e-06 (Fisher's exact test), Q value = 0.0016
Table S7. Gene #22: 'del_4q34.3' versus Clinical Feature #3: 'NEOPLASM.DISEASESTAGE'
| nPatients | STAGE I | STAGE II | STAGE III | STAGE IV |
|---|---|---|---|---|
| ALL | 239 | 55 | 125 | 79 |
| DEL PEAK 10(4Q34.3) MUTATED | 19 | 7 | 31 | 21 |
| DEL PEAK 10(4Q34.3) WILD-TYPE | 220 | 48 | 94 | 58 |
Figure S7. Get High-res Image Gene #22: 'del_4q34.3' versus Clinical Feature #3: 'NEOPLASM.DISEASESTAGE'
P value = 6.33e-07 (Fisher's exact test), Q value = 0.00015
Table S8. Gene #22: 'del_4q34.3' versus Clinical Feature #4: 'PATHOLOGY.T.STAGE'
| nPatients | T1 | T2 | T3 | T4 |
|---|---|---|---|---|
| ALL | 245 | 66 | 176 | 11 |
| DEL PEAK 10(4Q34.3) MUTATED | 20 | 9 | 43 | 6 |
| DEL PEAK 10(4Q34.3) WILD-TYPE | 225 | 57 | 133 | 5 |
Figure S8. Get High-res Image Gene #22: 'del_4q34.3' versus Clinical Feature #4: 'PATHOLOGY.T.STAGE'

P value = 2.85e-05 (logrank test), Q value = 0.0065
Table S9. Gene #26: 'del_9p23' versus Clinical Feature #1: 'Time to Death'
| nPatients | nDeath | Duration Range (Median), Month | |
|---|---|---|---|
| ALL | 497 | 166 | 0.1 - 120.6 (37.1) |
| DEL PEAK 14(9P23) MUTATED | 146 | 69 | 0.2 - 109.9 (36.3) |
| DEL PEAK 14(9P23) WILD-TYPE | 351 | 97 | 0.1 - 120.6 (37.2) |
Figure S9. Get High-res Image Gene #26: 'del_9p23' versus Clinical Feature #1: 'Time to Death'
P value = 1.34e-06 (Fisher's exact test), Q value = 0.00031
Table S10. Gene #26: 'del_9p23' versus Clinical Feature #3: 'NEOPLASM.DISEASESTAGE'
| nPatients | STAGE I | STAGE II | STAGE III | STAGE IV |
|---|---|---|---|---|
| ALL | 239 | 55 | 125 | 79 |
| DEL PEAK 14(9P23) MUTATED | 47 | 12 | 51 | 36 |
| DEL PEAK 14(9P23) WILD-TYPE | 192 | 43 | 74 | 43 |
Figure S10. Get High-res Image Gene #26: 'del_9p23' versus Clinical Feature #3: 'NEOPLASM.DISEASESTAGE'

P value = 1.69e-05 (Fisher's exact test), Q value = 0.0039
Table S11. Gene #26: 'del_9p23' versus Clinical Feature #4: 'PATHOLOGY.T.STAGE'
| nPatients | T1 | T2 | T3 | T4 |
|---|---|---|---|---|
| ALL | 245 | 66 | 176 | 11 |
| DEL PEAK 14(9P23) MUTATED | 51 | 16 | 74 | 5 |
| DEL PEAK 14(9P23) WILD-TYPE | 194 | 50 | 102 | 6 |
Figure S11. Get High-res Image Gene #26: 'del_9p23' versus Clinical Feature #4: 'PATHOLOGY.T.STAGE'
P value = 2.69e-07 (logrank test), Q value = 6.3e-05
Table S12. Gene #27: 'del_9p21.3' versus Clinical Feature #1: 'Time to Death'
| nPatients | nDeath | Duration Range (Median), Month | |
|---|---|---|---|
| ALL | 497 | 166 | 0.1 - 120.6 (37.1) |
| DEL PEAK 15(9P21.3) MUTATED | 154 | 76 | 0.2 - 109.9 (31.8) |
| DEL PEAK 15(9P21.3) WILD-TYPE | 343 | 90 | 0.1 - 120.6 (37.6) |
Figure S12. Get High-res Image Gene #27: 'del_9p21.3' versus Clinical Feature #1: 'Time to Death'
P value = 9.29e-09 (Fisher's exact test), Q value = 2.2e-06
Table S13. Gene #27: 'del_9p21.3' versus Clinical Feature #3: 'NEOPLASM.DISEASESTAGE'
| nPatients | STAGE I | STAGE II | STAGE III | STAGE IV |
|---|---|---|---|---|
| ALL | 239 | 55 | 125 | 79 |
| DEL PEAK 15(9P21.3) MUTATED | 48 | 11 | 55 | 40 |
| DEL PEAK 15(9P21.3) WILD-TYPE | 191 | 44 | 70 | 39 |
Figure S13. Get High-res Image Gene #27: 'del_9p21.3' versus Clinical Feature #3: 'NEOPLASM.DISEASESTAGE'
P value = 1.28e-07 (Fisher's exact test), Q value = 3e-05
Table S14. Gene #27: 'del_9p21.3' versus Clinical Feature #4: 'PATHOLOGY.T.STAGE'
| nPatients | T1 | T2 | T3 | T4 |
|---|---|---|---|---|
| ALL | 245 | 66 | 176 | 11 |
| DEL PEAK 15(9P21.3) MUTATED | 52 | 15 | 81 | 6 |
| DEL PEAK 15(9P21.3) WILD-TYPE | 193 | 51 | 95 | 5 |
Figure S14. Get High-res Image Gene #27: 'del_9p21.3' versus Clinical Feature #4: 'PATHOLOGY.T.STAGE'
P value = 0.000178 (Fisher's exact test), Q value = 0.04
Table S15. Gene #27: 'del_9p21.3' versus Clinical Feature #6: 'PATHOLOGY.M.STAGE'
| nPatients | M0 | M1 | MX |
|---|---|---|---|
| ALL | 417 | 78 | 3 |
| DEL PEAK 15(9P21.3) MUTATED | 115 | 39 | 0 |
| DEL PEAK 15(9P21.3) WILD-TYPE | 302 | 39 | 3 |
Figure S15. Get High-res Image Gene #27: 'del_9p21.3' versus Clinical Feature #6: 'PATHOLOGY.M.STAGE'
P value = 0.000766 (Fisher's exact test), Q value = 0.17
Table S16. Gene #27: 'del_9p21.3' versus Clinical Feature #7: 'GENDER'
| nPatients | FEMALE | MALE |
|---|---|---|
| ALL | 173 | 325 |
| DEL PEAK 15(9P21.3) MUTATED | 37 | 117 |
| DEL PEAK 15(9P21.3) WILD-TYPE | 136 | 208 |
Figure S16. Get High-res Image Gene #27: 'del_9p21.3' versus Clinical Feature #7: 'GENDER'
P value = 0.000301 (Fisher's exact test), Q value = 0.067
Table S17. Gene #28: 'del_10q23.31' versus Clinical Feature #4: 'PATHOLOGY.T.STAGE'
| nPatients | T1 | T2 | T3 | T4 |
|---|---|---|---|---|
| ALL | 245 | 66 | 176 | 11 |
| DEL PEAK 16(10Q23.31) MUTATED | 31 | 12 | 44 | 6 |
| DEL PEAK 16(10Q23.31) WILD-TYPE | 214 | 54 | 132 | 5 |
Figure S17. Get High-res Image Gene #28: 'del_10q23.31' versus Clinical Feature #4: 'PATHOLOGY.T.STAGE'
P value = 0.000379 (logrank test), Q value = 0.083
Table S18. Gene #29: 'del_13q14.2' versus Clinical Feature #1: 'Time to Death'
| nPatients | nDeath | Duration Range (Median), Month | |
|---|---|---|---|
| ALL | 497 | 166 | 0.1 - 120.6 (37.1) |
| DEL PEAK 17(13Q14.2) MUTATED | 80 | 37 | 0.2 - 89.4 (29.9) |
| DEL PEAK 17(13Q14.2) WILD-TYPE | 417 | 129 | 0.1 - 120.6 (38.3) |
Figure S18. Get High-res Image Gene #29: 'del_13q14.2' versus Clinical Feature #1: 'Time to Death'
P value = 2.62e-05 (Fisher's exact test), Q value = 0.006
Table S19. Gene #29: 'del_13q14.2' versus Clinical Feature #3: 'NEOPLASM.DISEASESTAGE'
| nPatients | STAGE I | STAGE II | STAGE III | STAGE IV |
|---|---|---|---|---|
| ALL | 239 | 55 | 125 | 79 |
| DEL PEAK 17(13Q14.2) MUTATED | 25 | 3 | 31 | 21 |
| DEL PEAK 17(13Q14.2) WILD-TYPE | 214 | 52 | 94 | 58 |
Figure S19. Get High-res Image Gene #29: 'del_13q14.2' versus Clinical Feature #3: 'NEOPLASM.DISEASESTAGE'
P value = 6.34e-07 (Fisher's exact test), Q value = 0.00015
Table S20. Gene #29: 'del_13q14.2' versus Clinical Feature #4: 'PATHOLOGY.T.STAGE'
| nPatients | T1 | T2 | T3 | T4 |
|---|---|---|---|---|
| ALL | 245 | 66 | 176 | 11 |
| DEL PEAK 17(13Q14.2) MUTATED | 27 | 4 | 42 | 7 |
| DEL PEAK 17(13Q14.2) WILD-TYPE | 218 | 62 | 134 | 4 |
Figure S20. Get High-res Image Gene #29: 'del_13q14.2' versus Clinical Feature #4: 'PATHOLOGY.T.STAGE'
P value = 2.43e-05 (Fisher's exact test), Q value = 0.0056
Table S21. Gene #30: 'del_14q31.1' versus Clinical Feature #3: 'NEOPLASM.DISEASESTAGE'
| nPatients | STAGE I | STAGE II | STAGE III | STAGE IV |
|---|---|---|---|---|
| ALL | 239 | 55 | 125 | 79 |
| DEL PEAK 18(14Q31.1) MUTATED | 79 | 27 | 66 | 47 |
| DEL PEAK 18(14Q31.1) WILD-TYPE | 160 | 28 | 59 | 32 |
Figure S21. Get High-res Image Gene #30: 'del_14q31.1' versus Clinical Feature #3: 'NEOPLASM.DISEASESTAGE'
P value = 0.000322 (Fisher's exact test), Q value = 0.071
Table S22. Gene #30: 'del_14q31.1' versus Clinical Feature #4: 'PATHOLOGY.T.STAGE'
| nPatients | T1 | T2 | T3 | T4 |
|---|---|---|---|---|
| ALL | 245 | 66 | 176 | 11 |
| DEL PEAK 18(14Q31.1) MUTATED | 85 | 35 | 95 | 4 |
| DEL PEAK 18(14Q31.1) WILD-TYPE | 160 | 31 | 81 | 7 |
Figure S22. Get High-res Image Gene #30: 'del_14q31.1' versus Clinical Feature #4: 'PATHOLOGY.T.STAGE'
P value = 0.00012 (Fisher's exact test), Q value = 0.027
Table S23. Gene #30: 'del_14q31.1' versus Clinical Feature #5: 'PATHOLOGY.N.STAGE'
| nPatients | 0 | 1 |
|---|---|---|
| ALL | 229 | 18 |
| DEL PEAK 18(14Q31.1) MUTATED | 97 | 16 |
| DEL PEAK 18(14Q31.1) WILD-TYPE | 132 | 2 |
Figure S23. Get High-res Image Gene #30: 'del_14q31.1' versus Clinical Feature #5: 'PATHOLOGY.N.STAGE'
-
Copy number data file = transformed.cor.cli.txt
-
Clinical data file = KIRC-TP.merged_data.txt
-
Number of patients = 498
-
Number of significantly focal cnvs = 30
-
Number of selected clinical features = 9
-
Exclude genes that fewer than K tumors have mutations, K = 3
For survival clinical features, the Kaplan-Meier survival curves of tumors with and without gene mutations were plotted and the statistical significance P values were estimated by logrank test (Bland and Altman 2004) using the 'survdiff' function in R
For continuous numerical clinical features, two-tailed Student's t test with unequal variance (Lehmann and Romano 2005) was applied to compare the clinical values between tumors with and without gene mutations using 't.test' function in R
For binary or multi-class clinical features (nominal or ordinal), two-tailed Fisher's exact tests (Fisher 1922) were used to estimate the P values using the 'fisher.test' function in R
For multiple hypothesis correction, Q value is the False Discovery Rate (FDR) analogue of the P value (Benjamini and Hochberg 1995), defined as the minimum FDR at which the test may be called significant. We used the 'Benjamini and Hochberg' method of 'p.adjust' function in R to convert P values into Q values.
In addition to the links below, the full results of the analysis summarized in this report can also be downloaded programmatically using firehose_get, or interactively from either the Broad GDAC website or TCGA Data Coordination Center Portal.