This pipeline computes the correlation between significantly recurrent gene mutations and selected clinical features.
Testing the association between mutation status of 9 genes and 8 clinical features across 417 patients, 4 significant findings detected with Q value < 0.25.
-
BAP1 mutation correlated to 'Time to Death', 'NEOPLASM.DISEASESTAGE', 'PATHOLOGY.T.STAGE', and 'GENDER'.
Table 1. Get Full Table Overview of the association between mutation status of 9 genes and 8 clinical features. Shown in the table are P values (Q values). Thresholded by Q value < 0.25, 4 significant findings detected.
|
Clinical Features |
Time to Death |
AGE |
NEOPLASM DISEASESTAGE |
PATHOLOGY T STAGE |
PATHOLOGY N STAGE |
PATHOLOGY M STAGE |
GENDER |
KARNOFSKY PERFORMANCE SCORE |
||
| nMutated (%) | nWild-Type | logrank test | t-test | Fisher's exact test | Fisher's exact test | Fisher's exact test | Fisher's exact test | Fisher's exact test | t-test | |
| BAP1 | 42 (10%) | 375 |
0.00101 (0.0635) |
0.384 (1.00) |
0.000133 (0.00878) |
0.000223 (0.0145) |
0.681 (1.00) |
0.0126 (0.766) |
0.000954 (0.061) |
|
| VHL | 218 (52%) | 199 |
0.896 (1.00) |
0.343 (1.00) |
0.0857 (1.00) |
0.161 (1.00) |
0.768 (1.00) |
0.112 (1.00) |
0.918 (1.00) |
0.272 (1.00) |
| SETD2 | 48 (12%) | 369 |
0.321 (1.00) |
0.15 (1.00) |
0.121 (1.00) |
0.094 (1.00) |
0.367 (1.00) |
0.207 (1.00) |
0.148 (1.00) |
|
| PBRM1 | 137 (33%) | 280 |
0.401 (1.00) |
0.393 (1.00) |
0.966 (1.00) |
0.219 (1.00) |
0.515 (1.00) |
1 (1.00) |
0.229 (1.00) |
0.387 (1.00) |
| KDM5C | 27 (6%) | 390 |
0.0536 (1.00) |
0.0682 (1.00) |
0.9 (1.00) |
0.877 (1.00) |
1 (1.00) |
1 (1.00) |
0.00612 (0.379) |
|
| PTEN | 18 (4%) | 399 |
0.363 (1.00) |
0.654 (1.00) |
0.0534 (1.00) |
0.251 (1.00) |
0.11 (1.00) |
0.329 (1.00) |
0.129 (1.00) |
0.357 (1.00) |
| TSPAN19 | 5 (1%) | 412 |
0.616 (1.00) |
0.278 (1.00) |
0.476 (1.00) |
0.7 (1.00) |
1 (1.00) |
0.585 (1.00) |
0.661 (1.00) |
|
| TCEB1 | 3 (1%) | 414 |
0.278 (1.00) |
0.246 (1.00) |
0.586 (1.00) |
0.383 (1.00) |
1 (1.00) |
1 (1.00) |
1 (1.00) |
|
| NEFH | 6 (1%) | 411 |
0.812 (1.00) |
0.536 (1.00) |
0.0638 (1.00) |
0.184 (1.00) |
1 (1.00) |
0.248 (1.00) |
0.67 (1.00) |
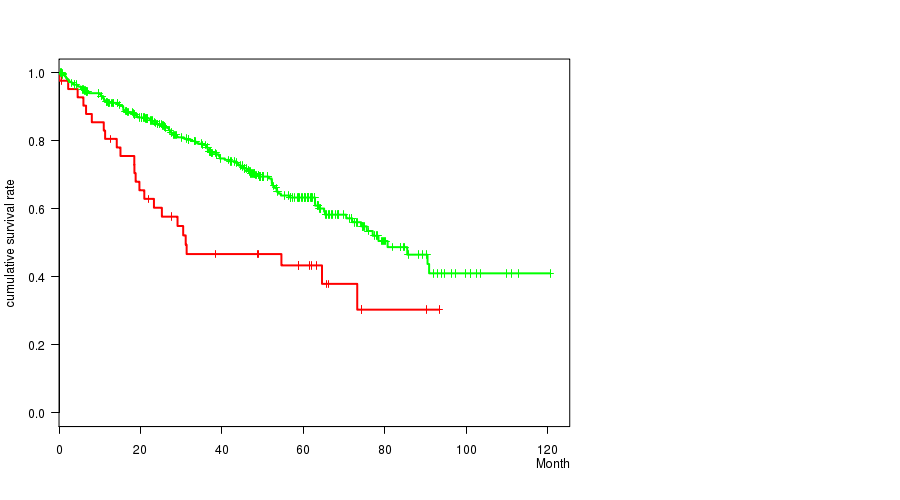
P value = 0.00101 (logrank test), Q value = 0.064
Table S1. Gene #1: 'BAP1 MUTATION STATUS' versus Clinical Feature #1: 'Time to Death'
| nPatients | nDeath | Duration Range (Median), Month | |
|---|---|---|---|
| ALL | 416 | 142 | 0.1 - 120.6 (37.2) |
| BAP1 MUTATED | 42 | 24 | 0.1 - 93.3 (28.3) |
| BAP1 WILD-TYPE | 374 | 118 | 0.4 - 120.6 (38.0) |
Figure S1. Get High-res Image Gene #1: 'BAP1 MUTATION STATUS' versus Clinical Feature #1: 'Time to Death'
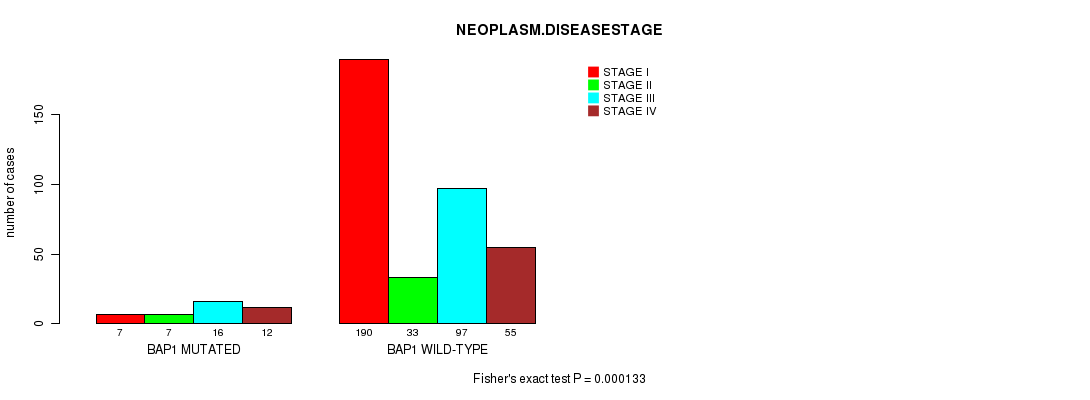
P value = 0.000133 (Fisher's exact test), Q value = 0.0088
Table S2. Gene #1: 'BAP1 MUTATION STATUS' versus Clinical Feature #3: 'NEOPLASM.DISEASESTAGE'
| nPatients | STAGE I | STAGE II | STAGE III | STAGE IV |
|---|---|---|---|---|
| ALL | 197 | 40 | 113 | 67 |
| BAP1 MUTATED | 7 | 7 | 16 | 12 |
| BAP1 WILD-TYPE | 190 | 33 | 97 | 55 |
Figure S2. Get High-res Image Gene #1: 'BAP1 MUTATION STATUS' versus Clinical Feature #3: 'NEOPLASM.DISEASESTAGE'
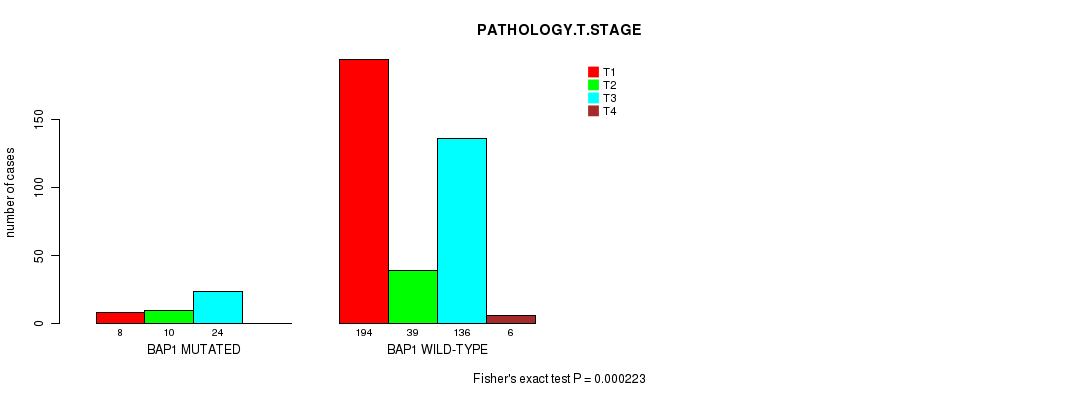
P value = 0.000223 (Fisher's exact test), Q value = 0.014
Table S3. Gene #1: 'BAP1 MUTATION STATUS' versus Clinical Feature #4: 'PATHOLOGY.T.STAGE'
| nPatients | T1 | T2 | T3 | T4 |
|---|---|---|---|---|
| ALL | 202 | 49 | 160 | 6 |
| BAP1 MUTATED | 8 | 10 | 24 | 0 |
| BAP1 WILD-TYPE | 194 | 39 | 136 | 6 |
Figure S3. Get High-res Image Gene #1: 'BAP1 MUTATION STATUS' versus Clinical Feature #4: 'PATHOLOGY.T.STAGE'
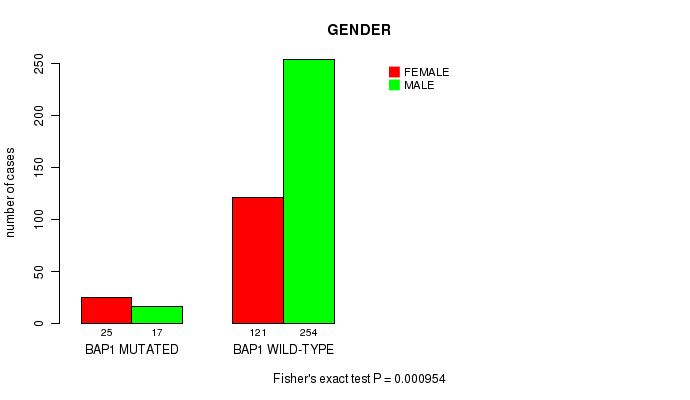
P value = 0.000954 (Fisher's exact test), Q value = 0.061
Table S4. Gene #1: 'BAP1 MUTATION STATUS' versus Clinical Feature #7: 'GENDER'
| nPatients | FEMALE | MALE |
|---|---|---|
| ALL | 146 | 271 |
| BAP1 MUTATED | 25 | 17 |
| BAP1 WILD-TYPE | 121 | 254 |
Figure S4. Get High-res Image Gene #1: 'BAP1 MUTATION STATUS' versus Clinical Feature #7: 'GENDER'
-
Mutation data file = transformed.cor.cli.txt
-
Clinical data file = KIRC-TP.merged_data.txt
-
Number of patients = 417
-
Number of significantly mutated genes = 9
-
Number of selected clinical features = 8
-
Exclude genes that fewer than K tumors have mutations, K = 3
For survival clinical features, the Kaplan-Meier survival curves of tumors with and without gene mutations were plotted and the statistical significance P values were estimated by logrank test (Bland and Altman 2004) using the 'survdiff' function in R
For continuous numerical clinical features, two-tailed Student's t test with unequal variance (Lehmann and Romano 2005) was applied to compare the clinical values between tumors with and without gene mutations using 't.test' function in R
For binary or multi-class clinical features (nominal or ordinal), two-tailed Fisher's exact tests (Fisher 1922) were used to estimate the P values using the 'fisher.test' function in R
For multiple hypothesis correction, Q value is the False Discovery Rate (FDR) analogue of the P value (Benjamini and Hochberg 1995), defined as the minimum FDR at which the test may be called significant. We used the 'Benjamini and Hochberg' method of 'p.adjust' function in R to convert P values into Q values.
In addition to the links below, the full results of the analysis summarized in this report can also be downloaded programmatically using firehose_get, or interactively from either the Broad GDAC website or TCGA Data Coordination Center Portal.