This pipeline uses various statistical tests to identify RPPAs whose expression levels correlated to selected clinical features.
Testing the association between 166 genes and 8 clinical features across 454 samples, statistically thresholded by Q value < 0.05, 7 clinical features related to at least one genes.
-
39 genes correlated to 'Time to Death'.
-
SRC|SRC_PY527-R-V , VASP|VASP-R-C , CDKN1A|P21-R-C , GAB2|GAB2-R-V , MAPK1 MAPK3|MAPK_PT202_Y204-R-V , ...
-
1 gene correlated to 'AGE'.
-
IGFBP2|IGFBP2-R-V
-
36 genes correlated to 'NEOPLASM.DISEASESTAGE'.
-
SRC|SRC_PY527-R-V , ERBB3|HER3_PY1298-R-C , PECAM1|CD31-M-V , CCNB1|CYCLIN_B1-R-V , CDH3|P-CADHERIN-R-C , ...
-
36 genes correlated to 'PATHOLOGY.T.STAGE'.
-
ERBB3|HER3_PY1298-R-C , CDH3|P-CADHERIN-R-C , SRC|SRC_PY527-R-V , EEF2|EEF2-R-V , ACACA|ACC1-R-C , ...
-
1 gene correlated to 'PATHOLOGY.N.STAGE'.
-
EGFR|EGFR_PY1068-R-V
-
21 genes correlated to 'PATHOLOGY.M.STAGE'.
-
ERBB3|HER3_PY1298-R-C , PECAM1|CD31-M-V , YBX1|YB-1-R-V , MAPK1 MAPK3|MAPK_PT202_Y204-R-V , TP53BP1|53BP1-R-C , ...
-
4 genes correlated to 'GENDER'.
-
AR|AR-R-V , PTK2|FAK-R-C , SRC|SRC-M-V , CLDN7|CLAUDIN-7-R-V
-
No genes correlated to 'KARNOFSKY.PERFORMANCE.SCORE'
Complete statistical result table is provided in Supplement Table 1
Table 1. Get Full Table This table shows the clinical features, statistical methods used, and the number of genes that are significantly associated with each clinical feature at Q value < 0.05.
| Clinical feature | Statistical test | Significant genes | Associated with | Associated with | ||
|---|---|---|---|---|---|---|
| Time to Death | Cox regression test | N=39 | shorter survival | N=19 | longer survival | N=20 |
| AGE | Spearman correlation test | N=1 | older | N=1 | younger | N=0 |
| NEOPLASM DISEASESTAGE | ANOVA test | N=36 | ||||
| PATHOLOGY T STAGE | Spearman correlation test | N=36 | higher stage | N=17 | lower stage | N=19 |
| PATHOLOGY N STAGE | t test | N=1 | class1 | N=0 | class0 | N=1 |
| PATHOLOGY M STAGE | t test | N=21 | m1 | N=8 | m0 | N=13 |
| GENDER | t test | N=4 | male | N=2 | female | N=2 |
| KARNOFSKY PERFORMANCE SCORE | Spearman correlation test | N=0 |
Table S1. Basic characteristics of clinical feature: 'Time to Death'
| Time to Death | Duration (Months) | 0.1-120.6 (median=37) |
| censored | N = 296 | |
| death | N = 158 | |
| Significant markers | N = 39 | |
| associated with shorter survival | 19 | |
| associated with longer survival | 20 |
Table S2. Get Full Table List of top 10 genes significantly associated with 'Time to Death' by Cox regression test
| HazardRatio | Wald_P | Q | C_index | |
|---|---|---|---|---|
| SRC|SRC_PY527-R-V | 0.54 | 5.903e-12 | 9.8e-10 | 0.371 |
| VASP|VASP-R-C | 4.2 | 1.001e-11 | 1.7e-09 | 0.634 |
| CDKN1A|P21-R-C | 6.2 | 5.491e-11 | 9e-09 | 0.625 |
| GAB2|GAB2-R-V | 0.5 | 2.439e-10 | 4e-08 | 0.355 |
| MAPK1 MAPK3|MAPK_PT202_Y204-R-V | 0.6 | 9.145e-10 | 1.5e-07 | 0.352 |
| PRKAA1|AMPK_PT172-R-V | 0.46 | 9.676e-10 | 1.6e-07 | 0.372 |
| CTNNA1|ALPHA-CATENIN-M-V | 0.21 | 1.282e-09 | 2.1e-07 | 0.362 |
| AR|AR-R-V | 0.33 | 1.85e-09 | 2.9e-07 | 0.352 |
| ACACA|ACC1-R-C | 2.5 | 2.024e-09 | 3.2e-07 | 0.623 |
| CCNB1|CYCLIN_B1-R-V | 1.76 | 2.4e-09 | 3.8e-07 | 0.58 |
Figure S1. Get High-res Image As an example, this figure shows the association of SRC|SRC_PY527-R-V to 'Time to Death'. four curves present the cumulative survival rates of 4 quartile subsets of patients. P value = 5.9e-12 with univariate Cox regression analysis using continuous log-2 expression values.
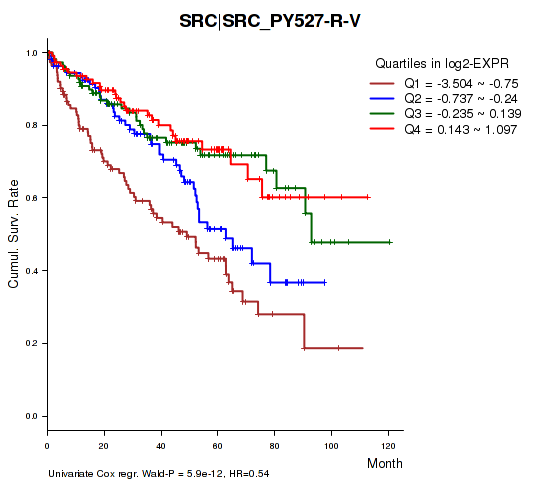
Table S3. Basic characteristics of clinical feature: 'AGE'
| AGE | Mean (SD) | 60.42 (12) |
| Significant markers | N = 1 | |
| pos. correlated | 1 | |
| neg. correlated | 0 |
Table S4. Get Full Table List of one gene significantly correlated to 'AGE' by Spearman correlation test
| SpearmanCorr | corrP | Q | |
|---|---|---|---|
| IGFBP2|IGFBP2-R-V | 0.2272 | 1.022e-06 | 0.00017 |
Figure S2. Get High-res Image As an example, this figure shows the association of IGFBP2|IGFBP2-R-V to 'AGE'. P value = 1.02e-06 with Spearman correlation analysis. The straight line presents the best linear regression.
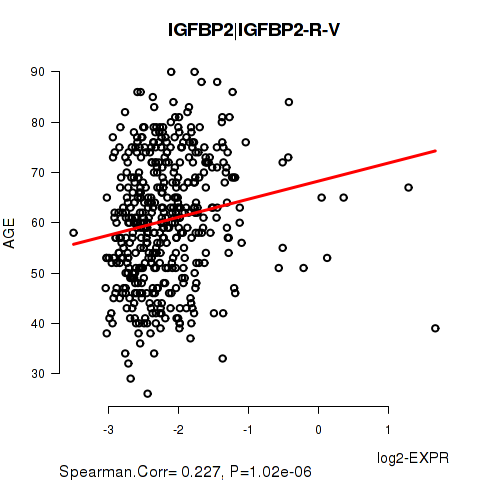
Table S5. Basic characteristics of clinical feature: 'NEOPLASM.DISEASESTAGE'
| NEOPLASM.DISEASESTAGE | Labels | N |
| STAGE I | 219 | |
| STAGE II | 44 | |
| STAGE III | 115 | |
| STAGE IV | 76 | |
| Significant markers | N = 36 |
Table S6. Get Full Table List of top 10 genes differentially expressed by 'NEOPLASM.DISEASESTAGE'
| ANOVA_P | Q | |
|---|---|---|
| SRC|SRC_PY527-R-V | 2.708e-11 | 4.5e-09 |
| ERBB3|HER3_PY1298-R-C | 2.833e-11 | 4.67e-09 |
| PECAM1|CD31-M-V | 1.073e-10 | 1.76e-08 |
| CCNB1|CYCLIN_B1-R-V | 5.227e-10 | 8.52e-08 |
| CDH3|P-CADHERIN-R-C | 1.87e-09 | 3.03e-07 |
| MAPK1 MAPK3|MAPK_PT202_Y204-R-V | 1.511e-08 | 2.43e-06 |
| CTNNA1|ALPHA-CATENIN-M-V | 1.597e-08 | 2.55e-06 |
| YBX1|YB-1_PS102-R-V | 9.994e-08 | 1.59e-05 |
| EEF2|EEF2-R-V | 1.17e-07 | 1.85e-05 |
| RAF1|C-RAF_PS338-R-C | 1.537e-07 | 2.41e-05 |
Figure S3. Get High-res Image As an example, this figure shows the association of SRC|SRC_PY527-R-V to 'NEOPLASM.DISEASESTAGE'. P value = 2.71e-11 with ANOVA analysis.
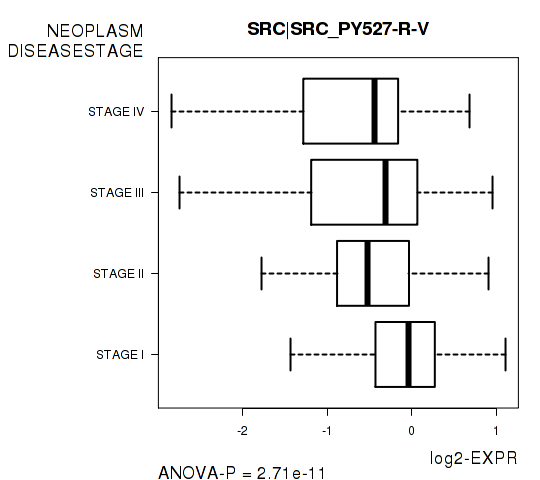
Table S7. Basic characteristics of clinical feature: 'PATHOLOGY.T.STAGE'
| PATHOLOGY.T.STAGE | Mean (SD) | 1.92 (0.97) |
| N | ||
| 1 | 224 | |
| 2 | 54 | |
| 3 | 165 | |
| 4 | 11 | |
| Significant markers | N = 36 | |
| pos. correlated | 17 | |
| neg. correlated | 19 |
Table S8. Get Full Table List of top 10 genes significantly correlated to 'PATHOLOGY.T.STAGE' by Spearman correlation test
| SpearmanCorr | corrP | Q | |
|---|---|---|---|
| ERBB3|HER3_PY1298-R-C | -0.3199 | 2.924e-12 | 4.85e-10 |
| CDH3|P-CADHERIN-R-C | 0.3122 | 1.007e-11 | 1.66e-09 |
| SRC|SRC_PY527-R-V | -0.29 | 3.005e-10 | 4.93e-08 |
| EEF2|EEF2-R-V | 0.2873 | 4.478e-10 | 7.3e-08 |
| ACACA|ACC1-R-C | 0.276 | 2.209e-09 | 3.58e-07 |
| SHC1|SHC_PY317-R-NA | -0.2717 | 4.011e-09 | 6.46e-07 |
| CTNNA1|ALPHA-CATENIN-M-V | -0.2703 | 4.814e-09 | 7.7e-07 |
| PECAM1|CD31-M-V | -0.2677 | 6.88e-09 | 1.09e-06 |
| ACACA ACACB|ACC_PS79-R-V | 0.2667 | 7.847e-09 | 1.24e-06 |
| YBX1|YB-1_PS102-R-V | 0.2618 | 1.497e-08 | 2.35e-06 |
Figure S4. Get High-res Image As an example, this figure shows the association of ERBB3|HER3_PY1298-R-C to 'PATHOLOGY.T.STAGE'. P value = 2.92e-12 with Spearman correlation analysis.
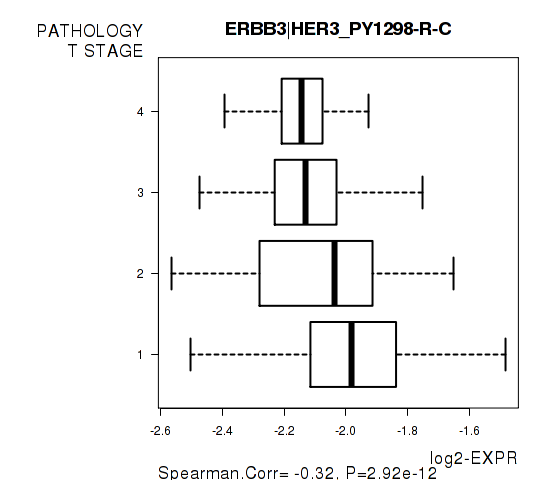
Table S9. Basic characteristics of clinical feature: 'PATHOLOGY.N.STAGE'
| PATHOLOGY.N.STAGE | Labels | N |
| class0 | 208 | |
| class1 | 16 | |
| Significant markers | N = 1 | |
| Higher in class1 | 0 | |
| Higher in class0 | 1 |
Table S10. Get Full Table List of one gene differentially expressed by 'PATHOLOGY.N.STAGE'
| T(pos if higher in 'class1') | ttestP | Q | AUC | |
|---|---|---|---|---|
| EGFR|EGFR_PY1068-R-V | -5.09 | 5.522e-05 | 0.00917 | 0.7713 |
Figure S5. Get High-res Image As an example, this figure shows the association of EGFR|EGFR_PY1068-R-V to 'PATHOLOGY.N.STAGE'. P value = 5.52e-05 with T-test analysis.
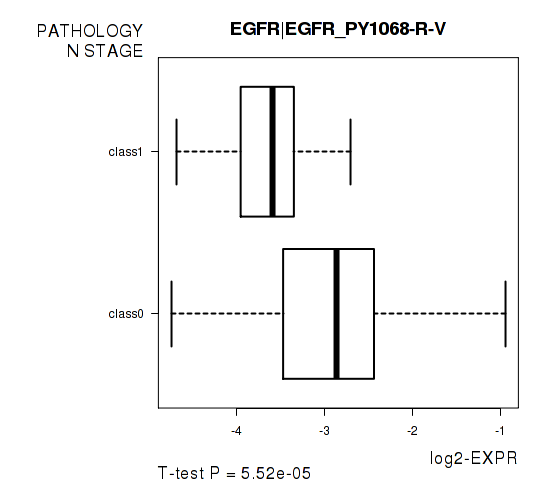
Table S11. Basic characteristics of clinical feature: 'PATHOLOGY.M.STAGE'
| PATHOLOGY.M.STAGE | Labels | N |
| M0 | 379 | |
| M1 | 75 | |
| Significant markers | N = 21 | |
| Higher in M1 | 8 | |
| Higher in M0 | 13 |
Table S12. Get Full Table List of top 10 genes differentially expressed by 'PATHOLOGY.M.STAGE'
| T(pos if higher in 'M1') | ttestP | Q | AUC | |
|---|---|---|---|---|
| ERBB3|HER3_PY1298-R-C | -6.81 | 2.114e-10 | 3.51e-08 | 0.6955 |
| PECAM1|CD31-M-V | -5.51 | 1.939e-07 | 3.2e-05 | 0.6715 |
| YBX1|YB-1-R-V | 5.13 | 1.037e-06 | 0.00017 | 0.664 |
| MAPK1 MAPK3|MAPK_PT202_Y204-R-V | -4.92 | 3.087e-06 | 0.000503 | 0.6609 |
| TP53BP1|53BP1-R-C | 4.88 | 3.333e-06 | 0.00054 | 0.6785 |
| PIK3R1|PI3K-P85-R-V | 4.91 | 3.643e-06 | 0.000586 | 0.6823 |
| PEA15|PEA-15-R-V | 4.68 | 8.298e-06 | 0.00133 | 0.6655 |
| ERRFI1|MIG-6-M-V | -4.56 | 1.126e-05 | 0.00179 | 0.6328 |
| RAF1|C-RAF_PS338-R-C | -4.32 | 3.263e-05 | 0.00516 | 0.6356 |
| RPS6|S6-R-NA | 4.31 | 3.455e-05 | 0.00542 | 0.6285 |
Figure S6. Get High-res Image As an example, this figure shows the association of ERBB3|HER3_PY1298-R-C to 'PATHOLOGY.M.STAGE'. P value = 2.11e-10 with T-test analysis.
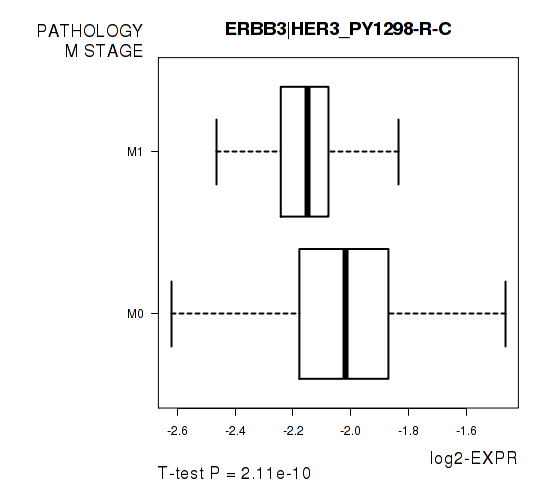
Table S13. Basic characteristics of clinical feature: 'GENDER'
| GENDER | Labels | N |
| FEMALE | 151 | |
| MALE | 303 | |
| Significant markers | N = 4 | |
| Higher in MALE | 2 | |
| Higher in FEMALE | 2 |
Table S14. Get Full Table List of 4 genes differentially expressed by 'GENDER'
| T(pos if higher in 'MALE') | ttestP | Q | AUC | |
|---|---|---|---|---|
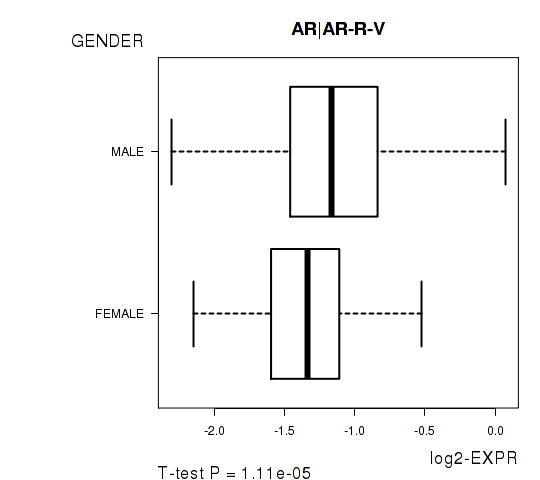
| AR|AR-R-V | 4.46 | 1.114e-05 | 0.00185 | 0.6217 |
| PTK2|FAK-R-C | -3.94 | 0.0001041 | 0.0172 | 0.6098 |
| SRC|SRC-M-V | -3.87 | 0.0001383 | 0.0227 | 0.6106 |
| CLDN7|CLAUDIN-7-R-V | 3.81 | 0.0001643 | 0.0268 | 0.6269 |
Figure S7. Get High-res Image As an example, this figure shows the association of AR|AR-R-V to 'GENDER'. P value = 1.11e-05 with T-test analysis.
-
Expresson data file = KIRC-TP.rppa.txt
-
Clinical data file = KIRC-TP.merged_data.txt
-
Number of patients = 454
-
Number of genes = 166
-
Number of clinical features = 8
For survival clinical features, Wald's test in univariate Cox regression analysis with proportional hazards model (Andersen and Gill 1982) was used to estimate the P values using the 'coxph' function in R. Kaplan-Meier survival curves were plot using the four quartile subgroups of patients based on expression levels
For continuous numerical clinical features, Spearman's rank correlation coefficients (Spearman 1904) and two-tailed P values were estimated using 'cor.test' function in R
For multi-class clinical features (ordinal or nominal), one-way analysis of variance (Howell 2002) was applied to compare the log2-expression levels between different clinical classes using 'anova' function in R
For two-class clinical features, two-tailed Student's t test with unequal variance (Lehmann and Romano 2005) was applied to compare the log2-expression levels between the two clinical classes using 't.test' function in R
For multiple hypothesis correction, Q value is the False Discovery Rate (FDR) analogue of the P value (Benjamini and Hochberg 1995), defined as the minimum FDR at which the test may be called significant. We used the 'Benjamini and Hochberg' method of 'p.adjust' function in R to convert P values into Q values.
In addition to the links below, the full results of the analysis summarized in this report can also be downloaded programmatically using firehose_get, or interactively from either the Broad GDAC website or TCGA Data Coordination Center Portal.