This pipeline uses various statistical tests to identify mRNAs whose expression levels correlated to selected clinical features.
Testing the association between 17814 genes and 7 clinical features across 72 samples, statistically thresholded by Q value < 0.05, 4 clinical features related to at least one genes.
-
66 genes correlated to 'NEOPLASM.DISEASESTAGE'.
-
TCF23 , PAX4 , OPRS1 , SNRP70 , JARID1C , ...
-
94 genes correlated to 'PATHOLOGY.N.STAGE'.
-
UBIAD1 , FAM64A , M6PRBP1 , ACTL6B , PIK3C3 , ...
-
64 genes correlated to 'PATHOLOGY.M.STAGE'.
-
IGFBPL1 , CYORF15B , DDX3Y , EIF1AY , OAS1 , ...
-
13 genes correlated to 'GENDER'.
-
DDX3Y , RPS4Y1 , CYORF15A , EIF1AY , RPS4Y2 , ...
-
No genes correlated to 'Time to Death', 'AGE', and 'PATHOLOGY.T.STAGE'.
Complete statistical result table is provided in Supplement Table 1
Table 1. Get Full Table This table shows the clinical features, statistical methods used, and the number of genes that are significantly associated with each clinical feature at Q value < 0.05.
| Clinical feature | Statistical test | Significant genes | Associated with | Associated with | ||
|---|---|---|---|---|---|---|
| Time to Death | Cox regression test | N=0 | ||||
| AGE | Spearman correlation test | N=0 | ||||
| NEOPLASM DISEASESTAGE | ANOVA test | N=66 | ||||
| PATHOLOGY T STAGE | Spearman correlation test | N=0 | ||||
| PATHOLOGY N STAGE | t test | N=94 | class1 | N=52 | class0 | N=42 |
| PATHOLOGY M STAGE | t test | N=64 | m1 | N=23 | m0 | N=41 |
| GENDER | t test | N=13 | male | N=13 | female | N=0 |
Table S1. Basic characteristics of clinical feature: 'Time to Death'
| Time to Death | Duration (Months) | 0.5-101.1 (median=36.8) |
| censored | N = 57 | |
| death | N = 14 | |
| Significant markers | N = 0 |
Table S2. Basic characteristics of clinical feature: 'AGE'
| AGE | Mean (SD) | 60.54 (12) |
| Significant markers | N = 0 |
Table S3. Basic characteristics of clinical feature: 'NEOPLASM.DISEASESTAGE'
| NEOPLASM.DISEASESTAGE | Labels | N |
| STAGE I | 40 | |
| STAGE II | 13 | |
| STAGE III | 14 | |
| STAGE IV | 5 | |
| Significant markers | N = 66 |
Table S4. Get Full Table List of top 10 genes differentially expressed by 'NEOPLASM.DISEASESTAGE'
| ANOVA_P | Q | |
|---|---|---|
| TCF23 | 6.108e-12 | 1.09e-07 |
| PAX4 | 6.492e-11 | 1.16e-06 |
| OPRS1 | 9.388e-10 | 1.67e-05 |
| SNRP70 | 2.371e-09 | 4.22e-05 |
| JARID1C | 1.003e-08 | 0.000179 |
| MSTO1 | 1.063e-08 | 0.000189 |
| SBNO2 | 1.133e-08 | 0.000202 |
| ZNF646 | 2.465e-08 | 0.000439 |
| GPR152 | 3.295e-08 | 0.000587 |
| POM121L1 | 3.476e-08 | 0.000619 |
Figure S1. Get High-res Image As an example, this figure shows the association of TCF23 to 'NEOPLASM.DISEASESTAGE'. P value = 6.11e-12 with ANOVA analysis.
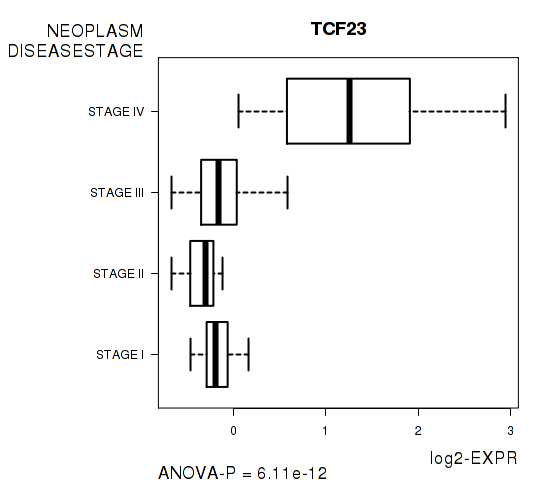
Table S5. Basic characteristics of clinical feature: 'PATHOLOGY.T.STAGE'
| PATHOLOGY.T.STAGE | Mean (SD) | 1.67 (0.84) |
| N | ||
| 1 | 41 | |
| 2 | 14 | |
| 3 | 17 | |
| Significant markers | N = 0 |
Table S6. Basic characteristics of clinical feature: 'PATHOLOGY.N.STAGE'
| PATHOLOGY.N.STAGE | Labels | N |
| class0 | 35 | |
| class1 | 3 | |
| Significant markers | N = 94 | |
| Higher in class1 | 52 | |
| Higher in class0 | 42 |
Table S7. Get Full Table List of top 10 genes differentially expressed by 'PATHOLOGY.N.STAGE'
| T(pos if higher in 'class1') | ttestP | Q | AUC | |
|---|---|---|---|---|
| UBIAD1 | -11.9 | 1.001e-13 | 1.77e-09 | 1 |
| FAM64A | 11.15 | 4.121e-13 | 7.3e-09 | 0.9714 |
| M6PRBP1 | 12.29 | 5.831e-13 | 1.03e-08 | 1 |
| ACTL6B | 10.94 | 1.665e-12 | 2.95e-08 | 0.9714 |
| PIK3C3 | -12.6 | 8.97e-12 | 1.59e-07 | 1 |
| SEMA3B | 9.87 | 1.045e-11 | 1.85e-07 | 0.9238 |
| SOAT2 | 15.76 | 1.32e-11 | 2.34e-07 | 1 |
| FCHO1 | 9.48 | 2.586e-11 | 4.58e-07 | 0.9429 |
| PSMA7 | 9.41 | 3.234e-11 | 5.73e-07 | 0.9619 |
| ADSL | -10.42 | 4.212e-11 | 7.46e-07 | 0.9714 |
Figure S2. Get High-res Image As an example, this figure shows the association of UBIAD1 to 'PATHOLOGY.N.STAGE'. P value = 1e-13 with T-test analysis.
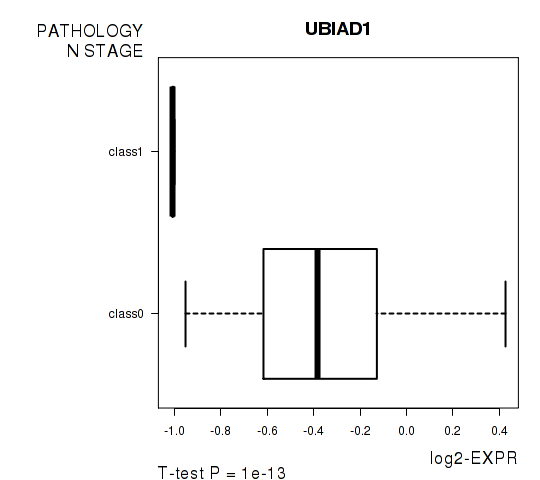
Table S8. Basic characteristics of clinical feature: 'PATHOLOGY.M.STAGE'
| PATHOLOGY.M.STAGE | Labels | N |
| M0 | 67 | |
| M1 | 5 | |
| Significant markers | N = 64 | |
| Higher in M1 | 23 | |
| Higher in M0 | 41 |
Table S9. Get Full Table List of top 10 genes differentially expressed by 'PATHOLOGY.M.STAGE'
| T(pos if higher in 'M1') | ttestP | Q | AUC | |
|---|---|---|---|---|
| IGFBPL1 | -10.69 | 2.075e-15 | 3.7e-11 | 0.8955 |
| CYORF15B | -10.34 | 1.448e-14 | 2.58e-10 | 0.9224 |
| DDX3Y | -9.7 | 1.45e-14 | 2.58e-10 | 0.809 |
| EIF1AY | -10.87 | 2.906e-14 | 5.18e-10 | 0.9493 |
| OAS1 | 9.58 | 2.205e-12 | 3.93e-08 | 0.9433 |
| RESP18 | 9.36 | 1.212e-11 | 2.16e-07 | 0.9463 |
| PELI2 | -8.79 | 1.784e-11 | 3.18e-07 | 0.8657 |
| UTY | -10.33 | 3.74e-11 | 6.66e-07 | 0.9821 |
| JARID1D | -10.14 | 4.94e-11 | 8.8e-07 | 0.9045 |
| HOXA7 | -9.6 | 6.012e-11 | 1.07e-06 | 0.8776 |
Figure S3. Get High-res Image As an example, this figure shows the association of IGFBPL1 to 'PATHOLOGY.M.STAGE'. P value = 2.07e-15 with T-test analysis.
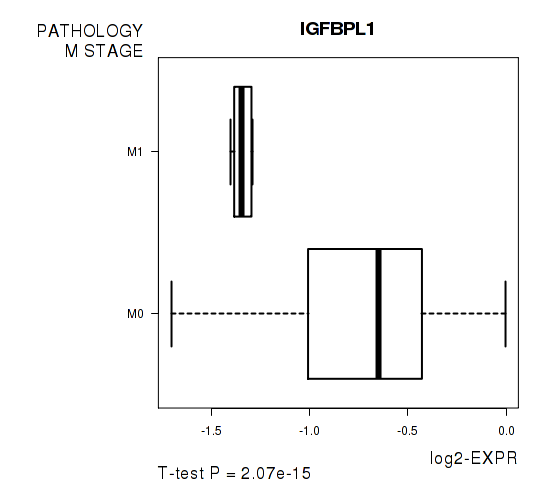
Table S10. Basic characteristics of clinical feature: 'GENDER'
| GENDER | Labels | N |
| FEMALE | 29 | |
| MALE | 43 | |
| Significant markers | N = 13 | |
| Higher in MALE | 13 | |
| Higher in FEMALE | 0 |
Table S11. Get Full Table List of top 10 genes differentially expressed by 'GENDER'
| T(pos if higher in 'MALE') | ttestP | Q | AUC | |
|---|---|---|---|---|
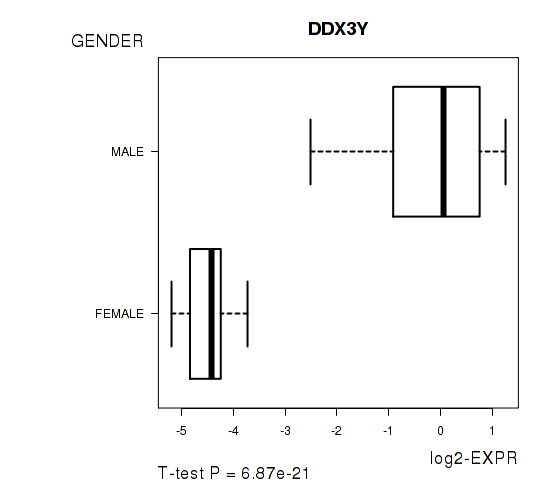
| DDX3Y | 13.71 | 6.875e-21 | 1.22e-16 | 0.9575 |
| RPS4Y1 | 14.08 | 1.088e-20 | 1.94e-16 | 0.9599 |
| CYORF15A | 13.48 | 2.222e-20 | 3.96e-16 | 0.9655 |
| EIF1AY | 13.4 | 2.577e-20 | 4.59e-16 | 0.9623 |
| RPS4Y2 | 13.25 | 3.662e-20 | 6.52e-16 | 0.9527 |
| JARID1D | 12.43 | 5.763e-19 | 1.03e-14 | 0.9583 |
| ZFY | 11.55 | 9.008e-18 | 1.6e-13 | 0.9615 |
| CYORF15B | 11 | 6.54e-17 | 1.16e-12 | 0.9415 |
| UTY | 10.7 | 2.396e-16 | 4.27e-12 | 0.9479 |
| USP9Y | 9.59 | 2.26e-14 | 4.02e-10 | 0.9318 |
Figure S4. Get High-res Image As an example, this figure shows the association of DDX3Y to 'GENDER'. P value = 6.87e-21 with T-test analysis.
-
Expresson data file = KIRC-TP.medianexp.txt
-
Clinical data file = KIRC-TP.merged_data.txt
-
Number of patients = 72
-
Number of genes = 17814
-
Number of clinical features = 7
For survival clinical features, Wald's test in univariate Cox regression analysis with proportional hazards model (Andersen and Gill 1982) was used to estimate the P values using the 'coxph' function in R. Kaplan-Meier survival curves were plot using the four quartile subgroups of patients based on expression levels
For continuous numerical clinical features, Spearman's rank correlation coefficients (Spearman 1904) and two-tailed P values were estimated using 'cor.test' function in R
For multi-class clinical features (ordinal or nominal), one-way analysis of variance (Howell 2002) was applied to compare the log2-expression levels between different clinical classes using 'anova' function in R
For two-class clinical features, two-tailed Student's t test with unequal variance (Lehmann and Romano 2005) was applied to compare the log2-expression levels between the two clinical classes using 't.test' function in R
For multiple hypothesis correction, Q value is the False Discovery Rate (FDR) analogue of the P value (Benjamini and Hochberg 1995), defined as the minimum FDR at which the test may be called significant. We used the 'Benjamini and Hochberg' method of 'p.adjust' function in R to convert P values into Q values.
In addition to the links below, the full results of the analysis summarized in this report can also be downloaded programmatically using firehose_get, or interactively from either the Broad GDAC website or TCGA Data Coordination Center Portal.