This pipeline uses various statistical tests to identify mRNAs whose expression levels correlated to selected clinical features.
Testing the association between 18274 genes and 9 clinical features across 503 samples, statistically thresholded by Q value < 0.05, 6 clinical features related to at least one genes.
-
25 genes correlated to 'AGE'.
-
RANBP17|64901 , WFDC1|58189 , RFPL1S|10740 , UTY|7404 , NEFH|4744 , ...
-
1620 genes correlated to 'NEOPLASM.DISEASESTAGE'.
-
PLEKHA9|51054 , NR3C2|4306 , IL20RB|53833 , INHBE|83729 , UBE2C|11065 , ...
-
2075 genes correlated to 'PATHOLOGY.T.STAGE'.
-
NR3C2|4306 , ZNF132|7691 , PLEKHA9|51054 , FKBP11|51303 , FAM122A|116224 , ...
-
6 genes correlated to 'PATHOLOGY.N.STAGE'.
-
C11ORF34|349633 , PITX2|5308 , ATP6V1D|51382 , HEMGN|55363 , C9ORF135|138255 , ...
-
246 genes correlated to 'PATHOLOGY.M.STAGE'.
-
INHBE|83729 , IL20RB|53833 , IGF2BP3|10643 , CEP55|55165 , CENPA|1058 , ...
-
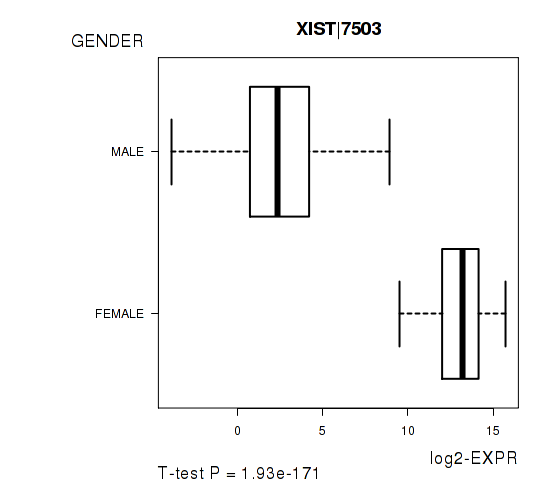
249 genes correlated to 'GENDER'.
-
XIST|7503 , PRKY|5616 , NLGN4Y|22829 , RPS4Y1|6192 , ZFY|7544 , ...
-
No genes correlated to 'Time to Death', 'KARNOFSKY.PERFORMANCE.SCORE', and 'NUMBERPACKYEARSSMOKED'.
Complete statistical result table is provided in Supplement Table 1
Table 1. Get Full Table This table shows the clinical features, statistical methods used, and the number of genes that are significantly associated with each clinical feature at Q value < 0.05.
| Clinical feature | Statistical test | Significant genes | Associated with | Associated with | ||
|---|---|---|---|---|---|---|
| Time to Death | Cox regression test | N=0 | ||||
| AGE | Spearman correlation test | N=25 | older | N=5 | younger | N=20 |
| NEOPLASM DISEASESTAGE | ANOVA test | N=1620 | ||||
| PATHOLOGY T STAGE | Spearman correlation test | N=2075 | higher stage | N=1114 | lower stage | N=961 |
| PATHOLOGY N STAGE | t test | N=6 | class1 | N=1 | class0 | N=5 |
| PATHOLOGY M STAGE | ANOVA test | N=246 | ||||
| GENDER | t test | N=249 | male | N=152 | female | N=97 |
| KARNOFSKY PERFORMANCE SCORE | Spearman correlation test | N=0 | ||||
| NUMBERPACKYEARSSMOKED | Spearman correlation test | N=0 |
Table S1. Basic characteristics of clinical feature: 'Time to Death'
| Time to Death | Duration (Months) | 0.1-120.6 (median=37.1) |
| censored | N = 336 | |
| death | N = 166 | |
| Significant markers | N = 0 |
Table S2. Basic characteristics of clinical feature: 'AGE'
| AGE | Mean (SD) | 60.63 (12) |
| Significant markers | N = 25 | |
| pos. correlated | 5 | |
| neg. correlated | 20 |
Table S3. Get Full Table List of top 10 genes significantly correlated to 'AGE' by Spearman correlation test
| SpearmanCorr | corrP | Q | |
|---|---|---|---|
| RANBP17|64901 | -0.2742 | 4.143e-10 | 7.57e-06 |
| WFDC1|58189 | -0.2634 | 2.051e-09 | 3.75e-05 |
| RFPL1S|10740 | -0.262 | 3.272e-09 | 5.98e-05 |
| UTY|7404 | -0.2814 | 2.284e-08 | 0.000417 |
| NEFH|4744 | -0.2448 | 2.77e-08 | 0.000506 |
| PALLD|23022 | -0.2405 | 4.905e-08 | 0.000896 |
| DIO2|1734 | -0.2294 | 2.089e-07 | 0.00382 |
| ZFY|7544 | -0.2435 | 2.914e-07 | 0.00532 |
| MAPKAPK2|9261 | 0.2236 | 4.152e-07 | 0.00758 |
| NKAPL|222698 | -0.221 | 5.851e-07 | 0.0107 |
Figure S1. Get High-res Image As an example, this figure shows the association of RANBP17|64901 to 'AGE'. P value = 4.14e-10 with Spearman correlation analysis. The straight line presents the best linear regression.
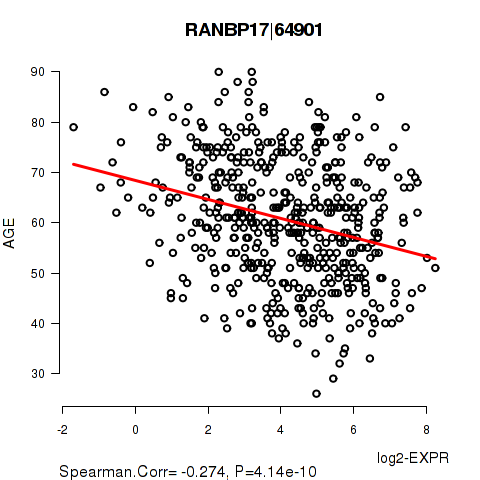
Table S4. Basic characteristics of clinical feature: 'NEOPLASM.DISEASESTAGE'
| NEOPLASM.DISEASESTAGE | Labels | N |
| STAGE I | 244 | |
| STAGE II | 55 | |
| STAGE III | 124 | |
| STAGE IV | 80 | |
| Significant markers | N = 1620 |
Table S5. Get Full Table List of top 10 genes differentially expressed by 'NEOPLASM.DISEASESTAGE'
| ANOVA_P | Q | |
|---|---|---|
| PLEKHA9|51054 | 1.229e-17 | 2.25e-13 |
| NR3C2|4306 | 2.259e-17 | 4.13e-13 |
| IL20RB|53833 | 1.045e-16 | 1.91e-12 |
| INHBE|83729 | 1.705e-16 | 3.11e-12 |
| UBE2C|11065 | 1.813e-16 | 3.31e-12 |
| ACADSB|36 | 3.975e-16 | 7.26e-12 |
| FKBP11|51303 | 4.998e-16 | 9.13e-12 |
| ALDH6A1|4329 | 7.821e-16 | 1.43e-11 |
| CEP55|55165 | 7.914e-16 | 1.45e-11 |
| PITX1|5307 | 1.111e-15 | 2.03e-11 |
Figure S2. Get High-res Image As an example, this figure shows the association of PLEKHA9|51054 to 'NEOPLASM.DISEASESTAGE'. P value = 1.23e-17 with ANOVA analysis.
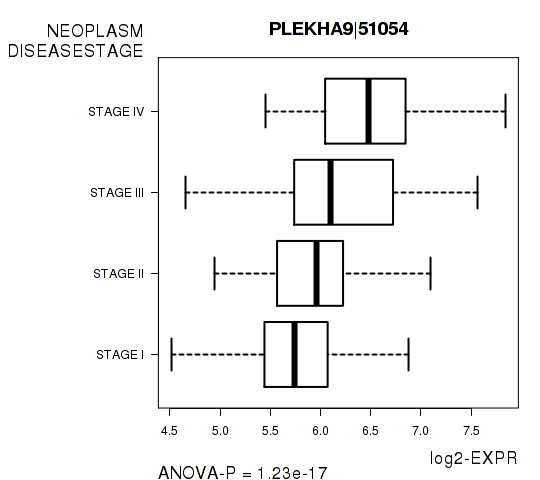
Table S6. Basic characteristics of clinical feature: 'PATHOLOGY.T.STAGE'
| PATHOLOGY.T.STAGE | Mean (SD) | 1.9 (0.96) |
| N | ||
| 1 | 250 | |
| 2 | 66 | |
| 3 | 176 | |
| 4 | 11 | |
| Significant markers | N = 2075 | |
| pos. correlated | 1114 | |
| neg. correlated | 961 |
Table S7. Get Full Table List of top 10 genes significantly correlated to 'PATHOLOGY.T.STAGE' by Spearman correlation test
| SpearmanCorr | corrP | Q | |
|---|---|---|---|
| NR3C2|4306 | -0.3775 | 1.743e-18 | 3.18e-14 |
| ZNF132|7691 | -0.3668 | 1.842e-17 | 3.37e-13 |
| PLEKHA9|51054 | 0.3662 | 2.063e-17 | 3.77e-13 |
| FKBP11|51303 | 0.3577 | 1.26e-16 | 2.3e-12 |
| FAM122A|116224 | -0.3494 | 6.849e-16 | 1.25e-11 |
| TSPAN7|7102 | -0.3484 | 8.385e-16 | 1.53e-11 |
| TMEM150C|441027 | -0.348 | 9.164e-16 | 1.67e-11 |
| ANKRD56|345079 | -0.3467 | 1.265e-15 | 2.31e-11 |
| NOP2|4839 | 0.3434 | 2.29e-15 | 4.18e-11 |
| EMCN|51705 | -0.343 | 2.471e-15 | 4.51e-11 |
Figure S3. Get High-res Image As an example, this figure shows the association of NR3C2|4306 to 'PATHOLOGY.T.STAGE'. P value = 1.74e-18 with Spearman correlation analysis.
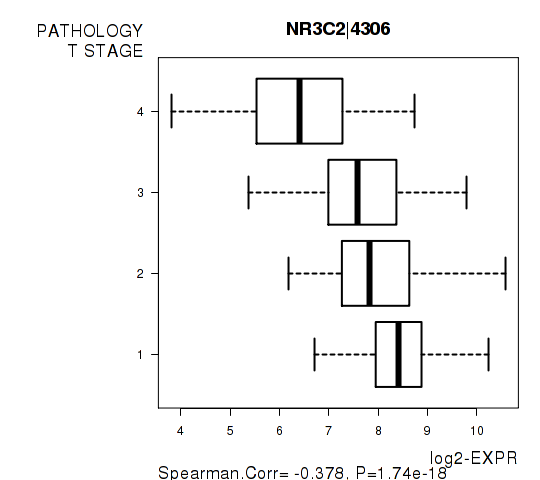
Table S8. Basic characteristics of clinical feature: 'PATHOLOGY.N.STAGE'
| PATHOLOGY.N.STAGE | Labels | N |
| class0 | 235 | |
| class1 | 17 | |
| Significant markers | N = 6 | |
| Higher in class1 | 1 | |
| Higher in class0 | 5 |
Table S9. Get Full Table List of 6 genes differentially expressed by 'PATHOLOGY.N.STAGE'
| T(pos if higher in 'class1') | ttestP | Q | AUC | |
|---|---|---|---|---|
| C11ORF34|349633 | -7.74 | 4.659e-09 | 8.51e-05 | 0.7156 |
| PITX2|5308 | 7.03 | 1.642e-07 | 0.003 | 0.7876 |
| ATP6V1D|51382 | -6.24 | 3.198e-07 | 0.00584 | 0.7524 |
| HEMGN|55363 | -6.07 | 4.583e-07 | 0.00837 | 0.7464 |
| C9ORF135|138255 | -5.49 | 1.412e-06 | 0.0258 | 0.6743 |
| AHSP|51327 | -5.96 | 1.892e-06 | 0.0345 | 0.7577 |
Figure S4. Get High-res Image As an example, this figure shows the association of C11ORF34|349633 to 'PATHOLOGY.N.STAGE'. P value = 4.66e-09 with T-test analysis.
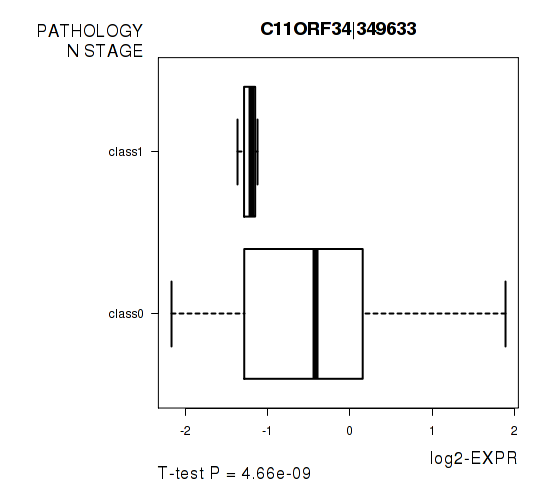
Table S10. Basic characteristics of clinical feature: 'PATHOLOGY.M.STAGE'
| PATHOLOGY.M.STAGE | Labels | N |
| M0 | 421 | |
| M1 | 79 | |
| MX | 3 | |
| Significant markers | N = 246 |
Table S11. Get Full Table List of top 10 genes differentially expressed by 'PATHOLOGY.M.STAGE'
| ANOVA_P | Q | |
|---|---|---|
| INHBE|83729 | 1.459e-11 | 2.67e-07 |
| IL20RB|53833 | 1.543e-11 | 2.82e-07 |
| IGF2BP3|10643 | 3.884e-11 | 7.1e-07 |
| CEP55|55165 | 7.579e-11 | 1.38e-06 |
| CENPA|1058 | 1.269e-10 | 2.32e-06 |
| GTSE1|51512 | 2.508e-10 | 4.58e-06 |
| BIRC5|332 | 2.998e-10 | 5.48e-06 |
| UBE2C|11065 | 3.878e-10 | 7.08e-06 |
| CCNB2|9133 | 4.443e-10 | 8.12e-06 |
| PLEKHA9|51054 | 5.139e-10 | 9.39e-06 |
Figure S5. Get High-res Image As an example, this figure shows the association of INHBE|83729 to 'PATHOLOGY.M.STAGE'. P value = 1.46e-11 with ANOVA analysis.
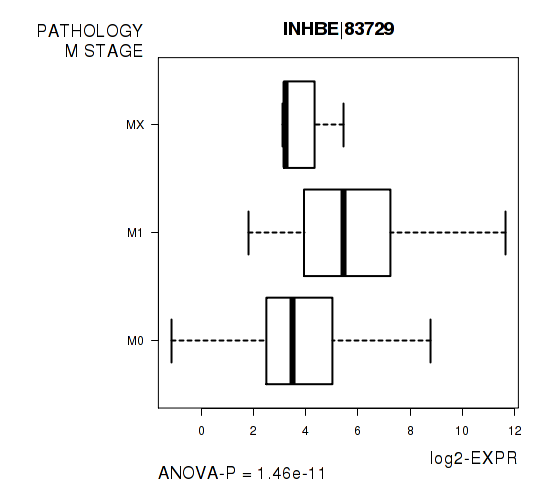
Table S12. Basic characteristics of clinical feature: 'GENDER'
| GENDER | Labels | N |
| FEMALE | 172 | |
| MALE | 331 | |
| Significant markers | N = 249 | |
| Higher in MALE | 152 | |
| Higher in FEMALE | 97 |
Table S13. Get Full Table List of top 10 genes differentially expressed by 'GENDER'
| T(pos if higher in 'MALE') | ttestP | Q | AUC | |
|---|---|---|---|---|
| XIST|7503 | -45.29 | 1.933e-171 | 3.53e-167 | 0.9848 |
| PRKY|5616 | 40.59 | 1.679e-112 | 3.07e-108 | 0.986 |
| NLGN4Y|22829 | 39.04 | 3.117e-87 | 5.7e-83 | 0.9854 |
| RPS4Y1|6192 | 37.63 | 2.99e-77 | 5.46e-73 | 0.9897 |
| ZFY|7544 | 38.5 | 1.934e-72 | 3.53e-68 | 0.9873 |
| TSIX|9383 | -23.98 | 2.149e-71 | 3.93e-67 | 0.9653 |
| DDX3Y|8653 | 32.71 | 1.193e-60 | 2.18e-56 | 0.9823 |
| KDM5C|8242 | -17.37 | 1.159e-51 | 2.12e-47 | 0.9004 |
| NCRNA00183|554203 | -16.65 | 5.062e-47 | 9.25e-43 | 0.8661 |
| KDM5D|8284 | 26.94 | 3.374e-42 | 6.16e-38 | 0.9806 |
Figure S6. Get High-res Image As an example, this figure shows the association of XIST|7503 to 'GENDER'. P value = 1.93e-171 with T-test analysis.
No gene related to 'KARNOFSKY.PERFORMANCE.SCORE'.
Table S14. Basic characteristics of clinical feature: 'KARNOFSKY.PERFORMANCE.SCORE'
| KARNOFSKY.PERFORMANCE.SCORE | Mean (SD) | 90.86 (18) |
| Score | N | |
| 0 | 1 | |
| 70 | 1 | |
| 80 | 3 | |
| 90 | 13 | |
| 100 | 17 | |
| Significant markers | N = 0 |
-
Expresson data file = KIRC-TP.uncv2.mRNAseq_RSEM_normalized_log2.txt
-
Clinical data file = KIRC-TP.merged_data.txt
-
Number of patients = 503
-
Number of genes = 18274
-
Number of clinical features = 9
For survival clinical features, Wald's test in univariate Cox regression analysis with proportional hazards model (Andersen and Gill 1982) was used to estimate the P values using the 'coxph' function in R. Kaplan-Meier survival curves were plot using the four quartile subgroups of patients based on expression levels
For continuous numerical clinical features, Spearman's rank correlation coefficients (Spearman 1904) and two-tailed P values were estimated using 'cor.test' function in R
For multi-class clinical features (ordinal or nominal), one-way analysis of variance (Howell 2002) was applied to compare the log2-expression levels between different clinical classes using 'anova' function in R
For two-class clinical features, two-tailed Student's t test with unequal variance (Lehmann and Romano 2005) was applied to compare the log2-expression levels between the two clinical classes using 't.test' function in R
For multiple hypothesis correction, Q value is the False Discovery Rate (FDR) analogue of the P value (Benjamini and Hochberg 1995), defined as the minimum FDR at which the test may be called significant. We used the 'Benjamini and Hochberg' method of 'p.adjust' function in R to convert P values into Q values.
In addition to the links below, the full results of the analysis summarized in this report can also be downloaded programmatically using firehose_get, or interactively from either the Broad GDAC website or TCGA Data Coordination Center Portal.