This pipeline uses various statistical tests to identify miRs whose expression levels correlated to selected clinical features.
Testing the association between 457 miRs and 9 clinical features across 486 samples, statistically thresholded by Q value < 0.05, 6 clinical features related to at least one miRs.
-
62 miRs correlated to 'Time to Death'.
-
HSA-MIR-223 , HSA-MIR-130B , HSA-MIR-34C , HSA-MIR-21 , HSA-MIR-365-2 , ...
-
1 miR correlated to 'AGE'.
-
HSA-MIR-590
-
37 miRs correlated to 'NEOPLASM.DISEASESTAGE'.
-
HSA-MIR-139 , HSA-MIR-625 , HSA-MIR-21 , HSA-MIR-486 , HSA-MIR-28 , ...
-
33 miRs correlated to 'PATHOLOGY.T.STAGE'.
-
HSA-MIR-139 , HSA-MIR-486 , HSA-MIR-21 , HSA-MIR-625 , HSA-MIR-155 , ...
-
22 miRs correlated to 'PATHOLOGY.M.STAGE'.
-
HSA-MIR-26A-1 , HSA-MIR-144 , HSA-MIR-625 , HSA-MIR-1277 , HSA-MIR-1269 , ...
-
9 miRs correlated to 'GENDER'.
-
HSA-MIR-100 , HSA-MIR-708 , HSA-MIR-599 , HSA-MIR-455 , HSA-MIR-30A , ...
-
No miRs correlated to 'PATHOLOGY.N.STAGE', 'KARNOFSKY.PERFORMANCE.SCORE', and 'NUMBERPACKYEARSSMOKED'.
Complete statistical result table is provided in Supplement Table 1
Table 1. Get Full Table This table shows the clinical features, statistical methods used, and the number of miRs that are significantly associated with each clinical feature at Q value < 0.05.
| Clinical feature | Statistical test | Significant miRs | Associated with | Associated with | ||
|---|---|---|---|---|---|---|
| Time to Death | Cox regression test | N=62 | shorter survival | N=54 | longer survival | N=8 |
| AGE | Spearman correlation test | N=1 | older | N=1 | younger | N=0 |
| NEOPLASM DISEASESTAGE | ANOVA test | N=37 | ||||
| PATHOLOGY T STAGE | Spearman correlation test | N=33 | higher stage | N=23 | lower stage | N=10 |
| PATHOLOGY N STAGE | t test | N=0 | ||||
| PATHOLOGY M STAGE | ANOVA test | N=22 | ||||
| GENDER | t test | N=9 | male | N=3 | female | N=6 |
| KARNOFSKY PERFORMANCE SCORE | Spearman correlation test | N=0 | ||||
| NUMBERPACKYEARSSMOKED | Spearman correlation test | N=0 |
Table S1. Basic characteristics of clinical feature: 'Time to Death'
| Time to Death | Duration (Months) | 0.1-120.6 (median=37.1) |
| censored | N = 322 | |
| death | N = 164 | |
| Significant markers | N = 62 | |
| associated with shorter survival | 54 | |
| associated with longer survival | 8 |
Table S2. Get Full Table List of top 10 miRs significantly associated with 'Time to Death' by Cox regression test
| HazardRatio | Wald_P | Q | C_index | |
|---|---|---|---|---|
| HSA-MIR-223 | 1.62 | 4.97e-13 | 2.3e-10 | 0.646 |
| HSA-MIR-130B | 2 | 6.237e-12 | 2.8e-09 | 0.645 |
| HSA-MIR-34C | 1.28 | 3.2e-10 | 1.5e-07 | 0.634 |
| HSA-MIR-21 | 2 | 7.889e-10 | 3.6e-07 | 0.659 |
| HSA-MIR-365-2 | 1.68 | 1.44e-08 | 6.5e-06 | 0.621 |
| HSA-MIR-10B | 0.57 | 1.838e-08 | 8.3e-06 | 0.369 |
| HSA-MIR-18A | 1.55 | 2.374e-08 | 1.1e-05 | 0.619 |
| HSA-MIR-365-1 | 1.64 | 3.232e-08 | 1.5e-05 | 0.617 |
| HSA-MIR-34B | 1.31 | 3.437e-08 | 1.5e-05 | 0.624 |
| HSA-MIR-1248 | 1.39 | 4.979e-08 | 2.2e-05 | 0.61 |
Figure S1. Get High-res Image As an example, this figure shows the association of HSA-MIR-223 to 'Time to Death'. four curves present the cumulative survival rates of 4 quartile subsets of patients. P value = 4.97e-13 with univariate Cox regression analysis using continuous log-2 expression values.
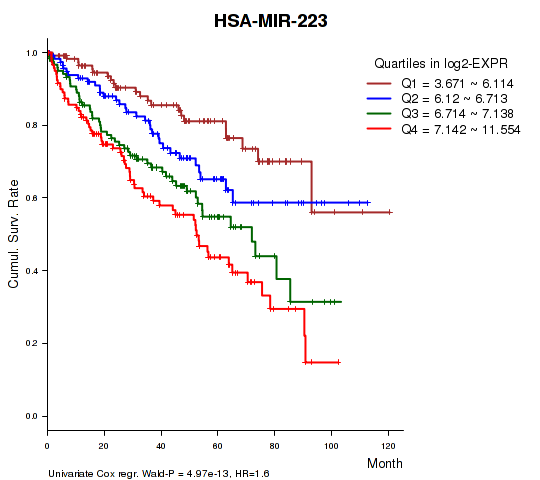
Table S3. Basic characteristics of clinical feature: 'AGE'
| AGE | Mean (SD) | 60.57 (12) |
| Significant markers | N = 1 | |
| pos. correlated | 1 | |
| neg. correlated | 0 |
Table S4. Get Full Table List of one miR significantly correlated to 'AGE' by Spearman correlation test
| SpearmanCorr | corrP | Q | |
|---|---|---|---|
| HSA-MIR-590 | 0.1806 | 6.232e-05 | 0.0285 |
Figure S2. Get High-res Image As an example, this figure shows the association of HSA-MIR-590 to 'AGE'. P value = 6.23e-05 with Spearman correlation analysis. The straight line presents the best linear regression.
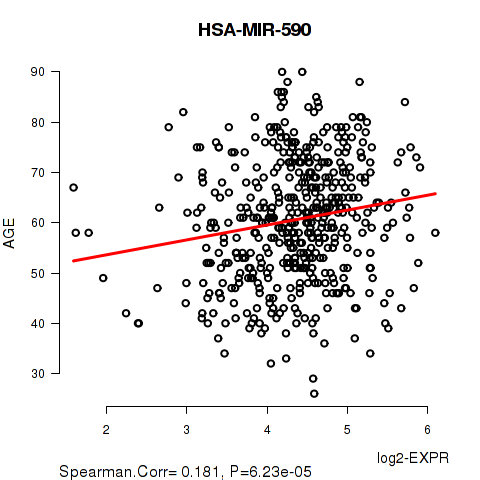
Table S5. Basic characteristics of clinical feature: 'NEOPLASM.DISEASESTAGE'
| NEOPLASM.DISEASESTAGE | Labels | N |
| STAGE I | 230 | |
| STAGE II | 53 | |
| STAGE III | 124 | |
| STAGE IV | 79 | |
| Significant markers | N = 37 |
Table S6. Get Full Table List of top 10 miRs differentially expressed by 'NEOPLASM.DISEASESTAGE'
| ANOVA_P | Q | |
|---|---|---|
| HSA-MIR-139 | 3.323e-12 | 1.52e-09 |
| HSA-MIR-625 | 1.196e-10 | 5.45e-08 |
| HSA-MIR-21 | 6.829e-09 | 3.11e-06 |
| HSA-MIR-486 | 1.233e-08 | 5.6e-06 |
| HSA-MIR-28 | 1.557e-08 | 7.06e-06 |
| HSA-MIR-155 | 2.759e-08 | 1.25e-05 |
| HSA-LET-7I | 3.102e-08 | 1.4e-05 |
| HSA-MIR-130B | 3.929e-08 | 1.77e-05 |
| HSA-MIR-144 | 6.786e-08 | 3.05e-05 |
| HSA-MIR-10B | 2.015e-07 | 9.03e-05 |
Figure S3. Get High-res Image As an example, this figure shows the association of HSA-MIR-139 to 'NEOPLASM.DISEASESTAGE'. P value = 3.32e-12 with ANOVA analysis.
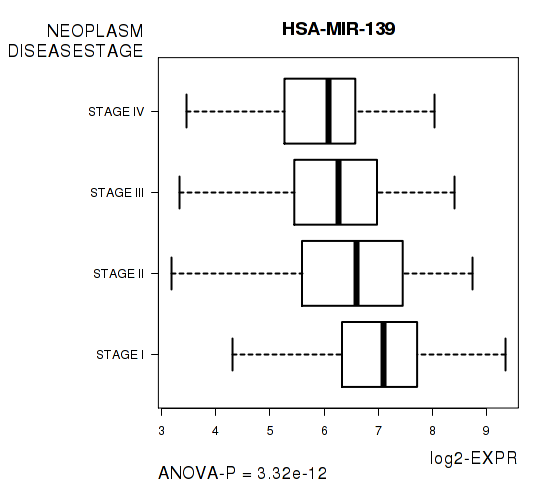
Table S7. Basic characteristics of clinical feature: 'PATHOLOGY.T.STAGE'
| PATHOLOGY.T.STAGE | Mean (SD) | 1.92 (0.97) |
| N | ||
| 1 | 236 | |
| 2 | 64 | |
| 3 | 175 | |
| 4 | 11 | |
| Significant markers | N = 33 | |
| pos. correlated | 23 | |
| neg. correlated | 10 |
Table S8. Get Full Table List of top 10 miRs significantly correlated to 'PATHOLOGY.T.STAGE' by Spearman correlation test
| SpearmanCorr | corrP | Q | |
|---|---|---|---|
| HSA-MIR-139 | -0.3315 | 6.28e-14 | 2.87e-11 |
| HSA-MIR-486 | -0.2693 | 1.615e-09 | 7.36e-07 |
| HSA-MIR-21 | 0.2688 | 1.73e-09 | 7.87e-07 |
| HSA-MIR-625 | 0.2677 | 2.03e-09 | 9.22e-07 |
| HSA-MIR-155 | 0.2482 | 2.943e-08 | 1.33e-05 |
| HSA-MIR-144 | -0.2408 | 7.72e-08 | 3.49e-05 |
| HSA-MIR-9-1 | 0.2341 | 1.793e-07 | 8.09e-05 |
| HSA-MIR-130B | 0.233 | 2.041e-07 | 9.19e-05 |
| HSA-MIR-451 | -0.2302 | 2.896e-07 | 0.00013 |
| HSA-MIR-9-2 | 0.2248 | 5.527e-07 | 0.000248 |
Figure S4. Get High-res Image As an example, this figure shows the association of HSA-MIR-139 to 'PATHOLOGY.T.STAGE'. P value = 6.28e-14 with Spearman correlation analysis.
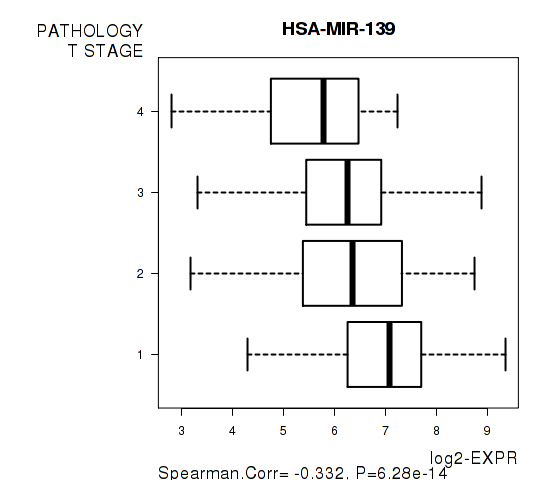
Table S9. Basic characteristics of clinical feature: 'PATHOLOGY.N.STAGE'
| PATHOLOGY.N.STAGE | Labels | N |
| class0 | 223 | |
| class1 | 18 | |
| Significant markers | N = 0 |
Table S10. Basic characteristics of clinical feature: 'PATHOLOGY.M.STAGE'
| PATHOLOGY.M.STAGE | Labels | N |
| M0 | 405 | |
| M1 | 78 | |
| MX | 3 | |
| Significant markers | N = 22 |
Table S11. Get Full Table List of top 10 miRs differentially expressed by 'PATHOLOGY.M.STAGE'
| ANOVA_P | Q | |
|---|---|---|
| HSA-MIR-26A-1 | 8.162e-08 | 3.73e-05 |
| HSA-MIR-144 | 3.859e-07 | 0.000176 |
| HSA-MIR-625 | 3.963e-07 | 0.00018 |
| HSA-MIR-1277 | 4.171e-07 | 0.000189 |
| HSA-MIR-1269 | 9.483e-07 | 0.00043 |
| HSA-MIR-155 | 4.507e-06 | 0.00204 |
| HSA-MIR-191 | 5.737e-06 | 0.00259 |
| HSA-MIR-28 | 1.025e-05 | 0.00461 |
| HSA-LET-7I | 1.45e-05 | 0.00651 |
| HSA-MIR-628 | 1.87e-05 | 0.00838 |
Figure S5. Get High-res Image As an example, this figure shows the association of HSA-MIR-26A-1 to 'PATHOLOGY.M.STAGE'. P value = 8.16e-08 with ANOVA analysis.
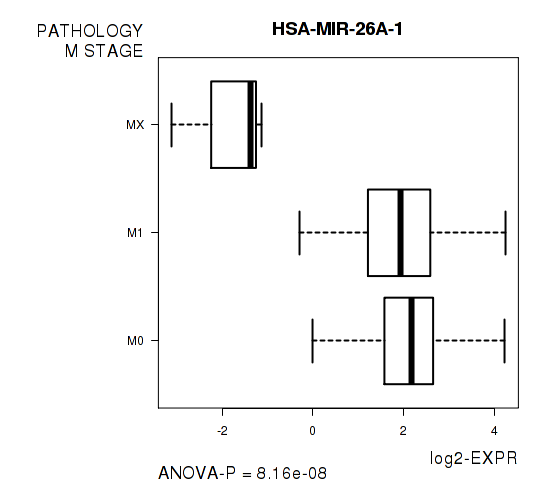
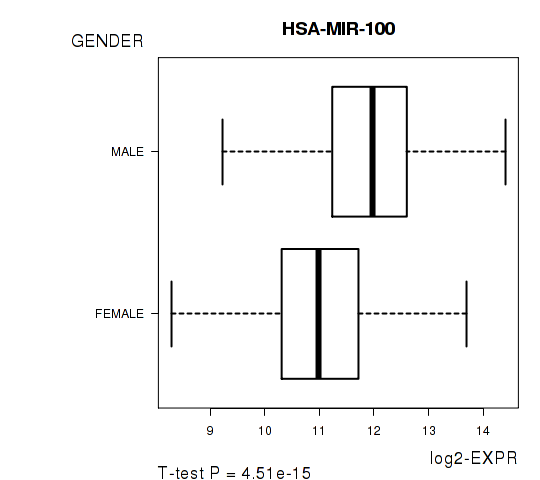
Table S12. Basic characteristics of clinical feature: 'GENDER'
| GENDER | Labels | N |
| FEMALE | 165 | |
| MALE | 321 | |
| Significant markers | N = 9 | |
| Higher in MALE | 3 | |
| Higher in FEMALE | 6 |
Table S13. Get Full Table List of 9 miRs differentially expressed by 'GENDER'
| T(pos if higher in 'MALE') | ttestP | Q | AUC | |
|---|---|---|---|---|
| HSA-MIR-100 | 8.24 | 4.513e-15 | 2.06e-12 | 0.7302 |
| HSA-MIR-708 | 5.57 | 5.528e-08 | 2.52e-05 | 0.6608 |
| HSA-MIR-599 | -5.47 | 1.06e-07 | 4.82e-05 | 0.6852 |
| HSA-MIR-455 | -5.37 | 1.381e-07 | 6.27e-05 | 0.6581 |
| HSA-MIR-30A | -4.45 | 1.117e-05 | 0.00506 | 0.6165 |
| HSA-MIR-31 | 4.4 | 1.517e-05 | 0.00686 | 0.63 |
| HSA-MIR-30C-2 | -4.19 | 3.637e-05 | 0.0164 | 0.6092 |
| HSA-MIR-204 | -4.02 | 7.114e-05 | 0.032 | 0.6369 |
| HSA-MIR-500B | -3.99 | 8.172e-05 | 0.0367 | 0.6076 |
Figure S6. Get High-res Image As an example, this figure shows the association of HSA-MIR-100 to 'GENDER'. P value = 4.51e-15 with T-test analysis.
No miR related to 'KARNOFSKY.PERFORMANCE.SCORE'.
Table S14. Basic characteristics of clinical feature: 'KARNOFSKY.PERFORMANCE.SCORE'
| KARNOFSKY.PERFORMANCE.SCORE | Mean (SD) | 88.33 (23) |
| Score | N | |
| 0 | 2 | |
| 70 | 1 | |
| 80 | 3 | |
| 90 | 13 | |
| 100 | 17 | |
| Significant markers | N = 0 |
-
Expresson data file = KIRC-TP.miRseq_RPKM_log2.txt
-
Clinical data file = KIRC-TP.merged_data.txt
-
Number of patients = 486
-
Number of miRs = 457
-
Number of clinical features = 9
For survival clinical features, Wald's test in univariate Cox regression analysis with proportional hazards model (Andersen and Gill 1982) was used to estimate the P values using the 'coxph' function in R. Kaplan-Meier survival curves were plot using the four quartile subgroups of patients based on expression levels
For continuous numerical clinical features, Spearman's rank correlation coefficients (Spearman 1904) and two-tailed P values were estimated using 'cor.test' function in R
For multi-class clinical features (ordinal or nominal), one-way analysis of variance (Howell 2002) was applied to compare the log2-expression levels between different clinical classes using 'anova' function in R
For two-class clinical features, two-tailed Student's t test with unequal variance (Lehmann and Romano 2005) was applied to compare the log2-expression levels between the two clinical classes using 't.test' function in R
For multiple hypothesis correction, Q value is the False Discovery Rate (FDR) analogue of the P value (Benjamini and Hochberg 1995), defined as the minimum FDR at which the test may be called significant. We used the 'Benjamini and Hochberg' method of 'p.adjust' function in R to convert P values into Q values.
In addition to the links below, the full results of the analysis summarized in this report can also be downloaded programmatically using firehose_get, or interactively from either the Broad GDAC website or TCGA Data Coordination Center Portal.