This pipeline computes the correlation between significant copy number variation (cnv focal) genes and selected clinical features.
Testing the association between copy number variation 48 focal events and 6 clinical features across 359 patients, 30 significant findings detected with Q value < 0.25.
-
amp_1q32.1 cnv correlated to 'AGE'.
-
amp_1q43 cnv correlated to 'AGE'.
-
amp_7p11.2 cnv correlated to 'Time to Death' and 'AGE'.
-
amp_7q31.2 cnv correlated to 'AGE'.
-
amp_7q32.3 cnv correlated to 'AGE'.
-
amp_8q24.13 cnv correlated to 'HISTOLOGICAL.TYPE'.
-
amp_10p15.3 cnv correlated to 'AGE' and 'HISTOLOGICAL.TYPE'.
-
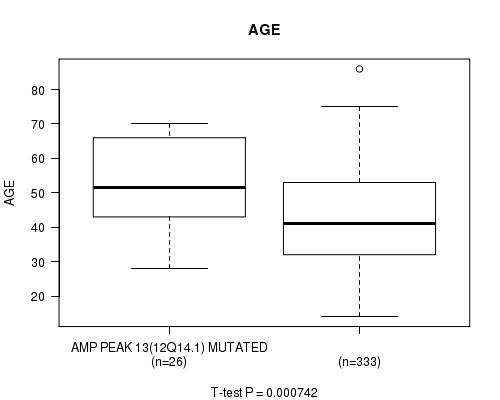
amp_12q14.1 cnv correlated to 'Time to Death' and 'AGE'.
-
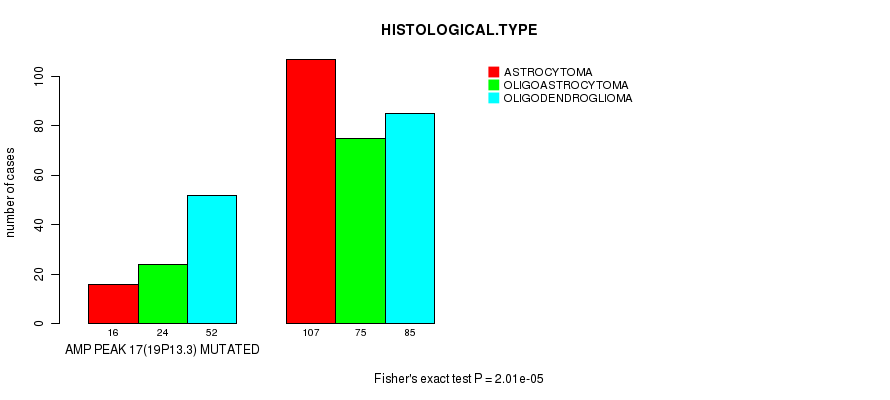
amp_19p13.3 cnv correlated to 'HISTOLOGICAL.TYPE'.
-
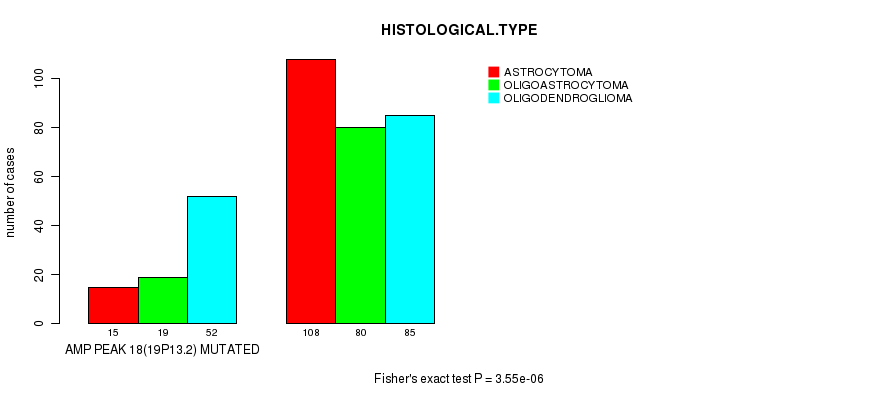
amp_19p13.2 cnv correlated to 'HISTOLOGICAL.TYPE'.
-
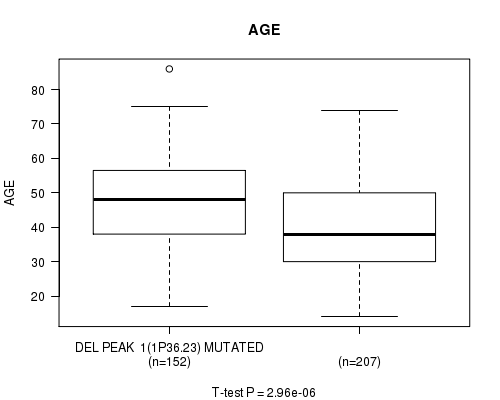
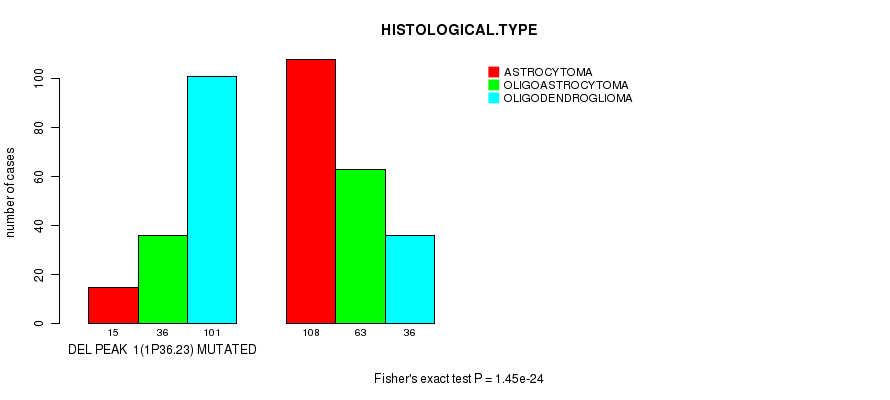
del_1p36.23 cnv correlated to 'AGE' and 'HISTOLOGICAL.TYPE'.
-
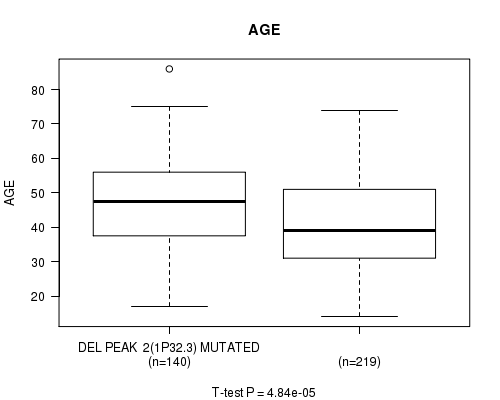
del_1p32.3 cnv correlated to 'AGE' and 'HISTOLOGICAL.TYPE'.
-
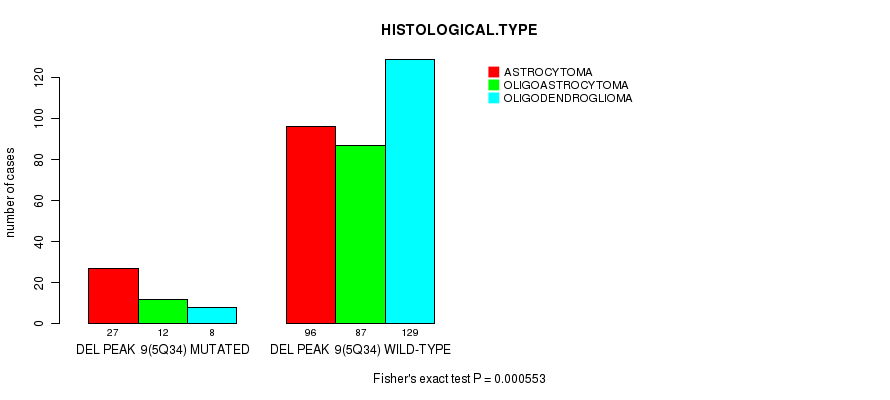
del_5q34 cnv correlated to 'HISTOLOGICAL.TYPE'.
-
del_6p25.3 cnv correlated to 'Time to Death'.
-
del_6q24.3 cnv correlated to 'HISTOLOGICAL.TYPE'.
-
del_9p23 cnv correlated to 'Time to Death'.
-
del_9p21.3 cnv correlated to 'Time to Death' and 'AGE'.
-
del_10q26.3 cnv correlated to 'Time to Death', 'AGE', and 'HISTOLOGICAL.TYPE'.
-
del_11p15.5 cnv correlated to 'HISTOLOGICAL.TYPE'.
-
del_12p13.1 cnv correlated to 'Time to Death'.
-
del_14q24.3 cnv correlated to 'Time to Death'.
-
del_19q13.42 cnv correlated to 'HISTOLOGICAL.TYPE'.
Table 1. Get Full Table Overview of the association between significant copy number variation of 48 focal events and 6 clinical features. Shown in the table are P values (Q values). Thresholded by Q value < 0.25, 30 significant findings detected.
|
Clinical Features |
Time to Death |
AGE | GENDER |
KARNOFSKY PERFORMANCE SCORE |
HISTOLOGICAL TYPE |
RADIATIONS RADIATION REGIMENINDICATION |
||
| nCNV (%) | nWild-Type | logrank test | t-test | Fisher's exact test | t-test | Fisher's exact test | Fisher's exact test | |
| del 10q26 3 | 104 (29%) | 255 |
1.71e-08 (4.86e-06) |
2.45e-05 (0.00664) |
0.0622 (1.00) |
0.132 (1.00) |
0.00053 (0.138) |
1 (1.00) |
| amp 7p11 2 | 91 (25%) | 268 |
2.71e-06 (0.00076) |
2.73e-07 (7.69e-05) |
0.225 (1.00) |
0.0208 (1.00) |
0.0205 (1.00) |
0.486 (1.00) |
| amp 10p15 3 | 46 (13%) | 313 |
0.862 (1.00) |
4.04e-06 (0.00111) |
0.115 (1.00) |
0.25 (1.00) |
0.000314 (0.0829) |
0.0267 (1.00) |
| amp 12q14 1 | 26 (7%) | 333 |
2.57e-08 (7.26e-06) |
0.000742 (0.192) |
0.421 (1.00) |
0.44 (1.00) |
0.0459 (1.00) |
0.346 (1.00) |
| del 1p36 23 | 152 (42%) | 207 |
0.459 (1.00) |
2.96e-06 (0.000826) |
0.393 (1.00) |
0.592 (1.00) |
1.45e-24 (4.17e-22) |
0.0356 (1.00) |
| del 1p32 3 | 140 (39%) | 219 |
0.029 (1.00) |
4.84e-05 (0.0131) |
0.588 (1.00) |
0.859 (1.00) |
1.96e-29 (5.65e-27) |
0.00383 (0.95) |
| del 9p21 3 | 118 (33%) | 241 |
1.84e-10 (5.25e-08) |
3.79e-06 (0.00105) |
0.91 (1.00) |
0.0114 (1.00) |
0.00171 (0.437) |
0.0063 (1.00) |
| amp 1q32 1 | 31 (9%) | 328 |
0.00255 (0.643) |
7.76e-07 (0.000218) |
0.851 (1.00) |
0.156 (1.00) |
0.229 (1.00) |
0.383 (1.00) |
| amp 1q43 | 22 (6%) | 337 |
0.00211 (0.536) |
1.36e-05 (0.0037) |
0.826 (1.00) |
0.125 (1.00) |
0.314 (1.00) |
0.206 (1.00) |
| amp 7q31 2 | 125 (35%) | 234 |
0.00276 (0.693) |
4.82e-06 (0.00132) |
0.0969 (1.00) |
0.112 (1.00) |
0.0354 (1.00) |
0.61 (1.00) |
| amp 7q32 3 | 132 (37%) | 227 |
0.0043 (1.00) |
3.17e-06 (0.000881) |
0.0789 (1.00) |
0.17 (1.00) |
0.0351 (1.00) |
0.613 (1.00) |
| amp 8q24 13 | 71 (20%) | 288 |
0.821 (1.00) |
0.2 (1.00) |
0.145 (1.00) |
0.14 (1.00) |
0.000165 (0.0439) |
0.879 (1.00) |
| amp 19p13 3 | 92 (26%) | 267 |
0.91 (1.00) |
0.0235 (1.00) |
0.809 (1.00) |
0.639 (1.00) |
2.01e-05 (0.00547) |
0.676 (1.00) |
| amp 19p13 2 | 86 (24%) | 273 |
0.714 (1.00) |
0.00447 (1.00) |
0.389 (1.00) |
0.472 (1.00) |
3.55e-06 (0.000983) |
1 (1.00) |
| del 5q34 | 47 (13%) | 312 |
0.0162 (1.00) |
0.449 (1.00) |
1 (1.00) |
0.944 (1.00) |
0.000553 (0.144) |
0.146 (1.00) |
| del 6p25 3 | 35 (10%) | 324 |
0.000141 (0.0376) |
0.326 (1.00) |
0.725 (1.00) |
0.144 (1.00) |
0.0807 (1.00) |
0.84 (1.00) |
| del 6q24 3 | 55 (15%) | 304 |
0.00245 (0.62) |
0.512 (1.00) |
0.464 (1.00) |
0.43 (1.00) |
9.3e-05 (0.0249) |
0.308 (1.00) |
| del 9p23 | 98 (27%) | 261 |
8.6e-05 (0.0231) |
0.00969 (1.00) |
0.813 (1.00) |
0.157 (1.00) |
0.00997 (1.00) |
0.00929 (1.00) |
| del 11p15 5 | 72 (20%) | 287 |
0.253 (1.00) |
0.0143 (1.00) |
0.0242 (1.00) |
0.532 (1.00) |
0.000504 (0.132) |
0.542 (1.00) |
| del 12p13 1 | 26 (7%) | 333 |
0.000396 (0.104) |
0.847 (1.00) |
0.541 (1.00) |
0.393 (1.00) |
0.0773 (1.00) |
0.241 (1.00) |
| del 14q24 3 | 82 (23%) | 277 |
0.000266 (0.0705) |
0.0444 (1.00) |
0.13 (1.00) |
0.536 (1.00) |
0.107 (1.00) |
0.663 (1.00) |
| del 19q13 42 | 191 (53%) | 168 |
0.0177 (1.00) |
0.305 (1.00) |
1 (1.00) |
0.632 (1.00) |
3.05e-17 (8.73e-15) |
0.903 (1.00) |
| amp 2p24 3 | 11 (3%) | 348 |
0.3 (1.00) |
0.532 (1.00) |
0.76 (1.00) |
0.585 (1.00) |
0.247 (1.00) |
0.737 (1.00) |
| amp 3q26 32 | 16 (4%) | 343 |
0.0054 (1.00) |
0.0942 (1.00) |
0.801 (1.00) |
0.533 (1.00) |
0.0151 (1.00) |
0.241 (1.00) |
| amp 4q12 | 17 (5%) | 342 |
0.0185 (1.00) |
0.21 (1.00) |
1 (1.00) |
0.383 (1.00) |
0.0419 (1.00) |
1 (1.00) |
| amp 11q23 3 | 61 (17%) | 298 |
0.698 (1.00) |
0.44 (1.00) |
0.204 (1.00) |
0.807 (1.00) |
0.892 (1.00) |
1 (1.00) |
| amp 12p13 32 | 53 (15%) | 306 |
0.321 (1.00) |
0.167 (1.00) |
0.036 (1.00) |
0.377 (1.00) |
0.133 (1.00) |
0.12 (1.00) |
| amp 13q34 | 16 (4%) | 343 |
0.398 (1.00) |
0.799 (1.00) |
1 (1.00) |
0.421 (1.00) |
0.769 (1.00) |
1 (1.00) |
| amp 15q26 3 | 13 (4%) | 346 |
0.00123 (0.315) |
0.761 (1.00) |
1 (1.00) |
0.148 (1.00) |
0.105 (1.00) |
0.743 (1.00) |
| amp 17q25 1 | 27 (8%) | 332 |
0.00163 (0.416) |
0.165 (1.00) |
0.689 (1.00) |
0.675 (1.00) |
0.153 (1.00) |
1 (1.00) |
| amp xp11 22 | 35 (10%) | 324 |
0.82 (1.00) |
0.335 (1.00) |
0.859 (1.00) |
0.952 (1.00) |
0.0104 (1.00) |
0.545 (1.00) |
| del 1q43 | 18 (5%) | 341 |
0.719 (1.00) |
0.922 (1.00) |
0.228 (1.00) |
0.23 (1.00) |
0.21 (1.00) |
0.781 (1.00) |
| del 2q37 3 | 52 (14%) | 307 |
0.8 (1.00) |
0.0935 (1.00) |
0.293 (1.00) |
0.778 (1.00) |
0.019 (1.00) |
0.489 (1.00) |
| del 3p21 1 | 29 (8%) | 330 |
0.0391 (1.00) |
0.588 (1.00) |
0.439 (1.00) |
0.0152 (1.00) |
0.369 (1.00) |
0.0421 (1.00) |
| del 3q29 | 29 (8%) | 330 |
0.0189 (1.00) |
0.854 (1.00) |
0.245 (1.00) |
0.274 (1.00) |
0.141 (1.00) |
0.5 (1.00) |
| del 4q34 3 | 101 (28%) | 258 |
0.573 (1.00) |
0.226 (1.00) |
0.638 (1.00) |
0.774 (1.00) |
0.862 (1.00) |
0.281 (1.00) |
| del 5p15 33 | 34 (9%) | 325 |
0.992 (1.00) |
0.132 (1.00) |
0.371 (1.00) |
0.103 (1.00) |
0.00468 (1.00) |
0.0109 (1.00) |
| del 7p22 3 | 17 (5%) | 342 |
0.774 (1.00) |
0.467 (1.00) |
0.458 (1.00) |
0.582 (1.00) |
0.295 (1.00) |
0.773 (1.00) |
| del 8q24 3 | 20 (6%) | 339 |
0.407 (1.00) |
0.728 (1.00) |
1 (1.00) |
0.981 (1.00) |
0.107 (1.00) |
0.597 (1.00) |
| del 12q12 | 46 (13%) | 313 |
0.682 (1.00) |
0.658 (1.00) |
0.429 (1.00) |
0.638 (1.00) |
0.00103 (0.266) |
0.855 (1.00) |
| del 13q14 2 | 100 (28%) | 259 |
0.0291 (1.00) |
0.752 (1.00) |
0.408 (1.00) |
0.0176 (1.00) |
0.261 (1.00) |
0.102 (1.00) |
| del 13q14 2 | 102 (28%) | 257 |
0.0411 (1.00) |
0.787 (1.00) |
0.411 (1.00) |
0.0187 (1.00) |
0.195 (1.00) |
0.137 (1.00) |
| del 13q34 | 76 (21%) | 283 |
0.0358 (1.00) |
0.868 (1.00) |
0.698 (1.00) |
0.358 (1.00) |
0.907 (1.00) |
0.232 (1.00) |
| del 18q23 | 57 (16%) | 302 |
0.916 (1.00) |
0.0721 (1.00) |
0.248 (1.00) |
0.524 (1.00) |
0.695 (1.00) |
0.741 (1.00) |
| del 22q13 31 | 52 (14%) | 307 |
0.00404 (0.999) |
0.00744 (1.00) |
0.881 (1.00) |
0.0364 (1.00) |
0.0034 (0.849) |
0.729 (1.00) |
| del 22q13 31 | 51 (14%) | 308 |
0.00366 (0.912) |
0.00953 (1.00) |
0.762 (1.00) |
0.0343 (1.00) |
0.006 (1.00) |
0.604 (1.00) |
| del xp21 1 | 69 (19%) | 290 |
0.15 (1.00) |
0.553 (1.00) |
0.107 (1.00) |
0.141 (1.00) |
0.956 (1.00) |
0.877 (1.00) |
| del xq21 1 | 49 (14%) | 310 |
0.199 (1.00) |
0.0347 (1.00) |
0.648 (1.00) |
0.643 (1.00) |
0.345 (1.00) |
1 (1.00) |
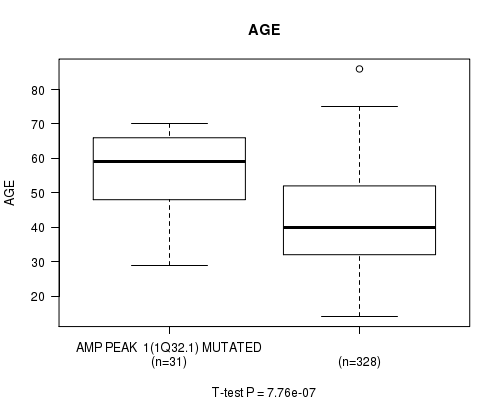
P value = 7.76e-07 (t-test), Q value = 0.00022
Table S1. Gene #1: 'amp_1q32.1' versus Clinical Feature #2: 'AGE'
| nPatients | Mean (Std.Dev) | |
|---|---|---|
| ALL | 359 | 43.6 (13.5) |
| AMP PEAK 1(1Q32.1) MUTATED | 31 | 55.5 (11.6) |
| AMP PEAK 1(1Q32.1) WILD-TYPE | 328 | 42.5 (13.1) |
Figure S1. Get High-res Image Gene #1: 'amp_1q32.1' versus Clinical Feature #2: 'AGE'
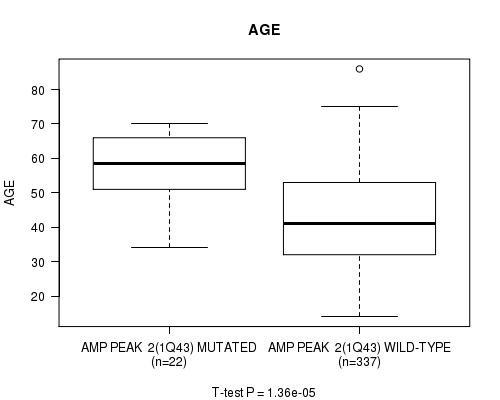
P value = 1.36e-05 (t-test), Q value = 0.0037
Table S2. Gene #2: 'amp_1q43' versus Clinical Feature #2: 'AGE'
| nPatients | Mean (Std.Dev) | |
|---|---|---|
| ALL | 359 | 43.6 (13.5) |
| AMP PEAK 2(1Q43) MUTATED | 22 | 55.8 (10.8) |
| AMP PEAK 2(1Q43) WILD-TYPE | 337 | 42.8 (13.3) |
Figure S2. Get High-res Image Gene #2: 'amp_1q43' versus Clinical Feature #2: 'AGE'
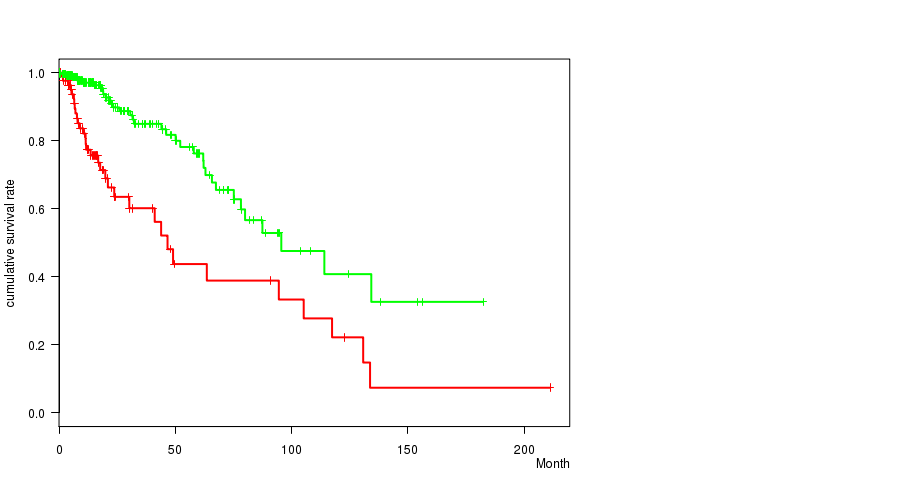
P value = 2.71e-06 (logrank test), Q value = 0.00076
Table S3. Gene #6: 'amp_7p11.2' versus Clinical Feature #1: 'Time to Death'
| nPatients | nDeath | Duration Range (Median), Month | |
|---|---|---|---|
| ALL | 356 | 68 | 0.0 - 211.2 (14.8) |
| AMP PEAK 6(7P11.2) MUTATED | 90 | 33 | 0.1 - 211.2 (13.1) |
| AMP PEAK 6(7P11.2) WILD-TYPE | 266 | 35 | 0.0 - 182.3 (15.1) |
Figure S3. Get High-res Image Gene #6: 'amp_7p11.2' versus Clinical Feature #1: 'Time to Death'
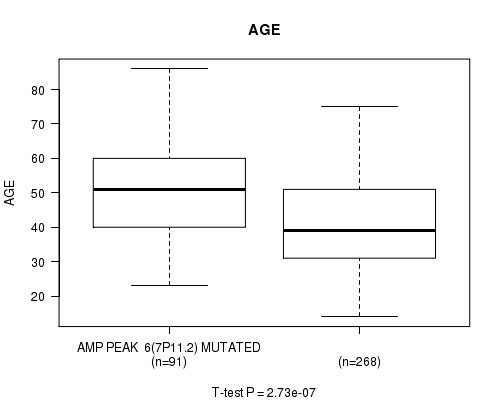
P value = 2.73e-07 (t-test), Q value = 7.7e-05
Table S4. Gene #6: 'amp_7p11.2' versus Clinical Feature #2: 'AGE'
| nPatients | Mean (Std.Dev) | |
|---|---|---|
| ALL | 359 | 43.6 (13.5) |
| AMP PEAK 6(7P11.2) MUTATED | 91 | 50.2 (13.9) |
| AMP PEAK 6(7P11.2) WILD-TYPE | 268 | 41.4 (12.6) |
Figure S4. Get High-res Image Gene #6: 'amp_7p11.2' versus Clinical Feature #2: 'AGE'
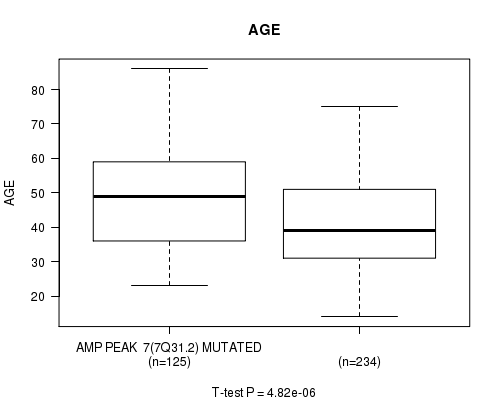
P value = 4.82e-06 (t-test), Q value = 0.0013
Table S5. Gene #7: 'amp_7q31.2' versus Clinical Feature #2: 'AGE'
| nPatients | Mean (Std.Dev) | |
|---|---|---|
| ALL | 359 | 43.6 (13.5) |
| AMP PEAK 7(7Q31.2) MUTATED | 125 | 48.1 (13.7) |
| AMP PEAK 7(7Q31.2) WILD-TYPE | 234 | 41.2 (12.8) |
Figure S5. Get High-res Image Gene #7: 'amp_7q31.2' versus Clinical Feature #2: 'AGE'
P value = 3.17e-06 (t-test), Q value = 0.00088
Table S6. Gene #8: 'amp_7q32.3' versus Clinical Feature #2: 'AGE'
| nPatients | Mean (Std.Dev) | |
|---|---|---|
| ALL | 359 | 43.6 (13.5) |
| AMP PEAK 8(7Q32.3) MUTATED | 132 | 48.0 (13.5) |
| AMP PEAK 8(7Q32.3) WILD-TYPE | 227 | 41.1 (12.8) |
Figure S6. Get High-res Image Gene #8: 'amp_7q32.3' versus Clinical Feature #2: 'AGE'

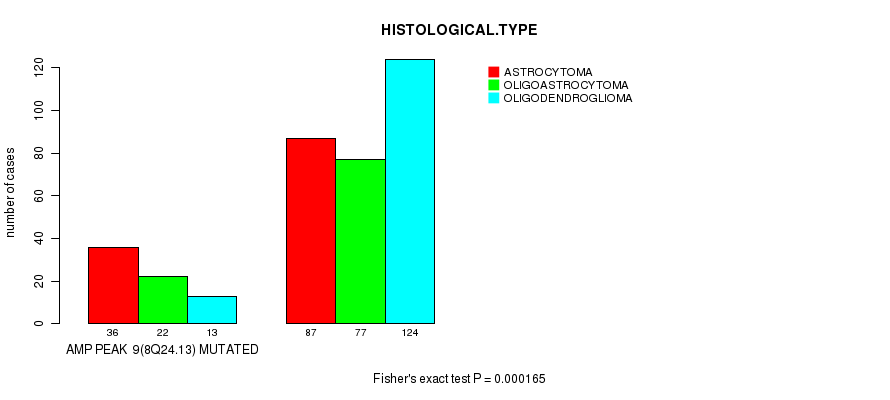
P value = 0.000165 (Fisher's exact test), Q value = 0.044
Table S7. Gene #9: 'amp_8q24.13' versus Clinical Feature #5: 'HISTOLOGICAL.TYPE'
| nPatients | ASTROCYTOMA | OLIGOASTROCYTOMA | OLIGODENDROGLIOMA |
|---|---|---|---|
| ALL | 123 | 99 | 137 |
| AMP PEAK 9(8Q24.13) MUTATED | 36 | 22 | 13 |
| AMP PEAK 9(8Q24.13) WILD-TYPE | 87 | 77 | 124 |
Figure S7. Get High-res Image Gene #9: 'amp_8q24.13' versus Clinical Feature #5: 'HISTOLOGICAL.TYPE'
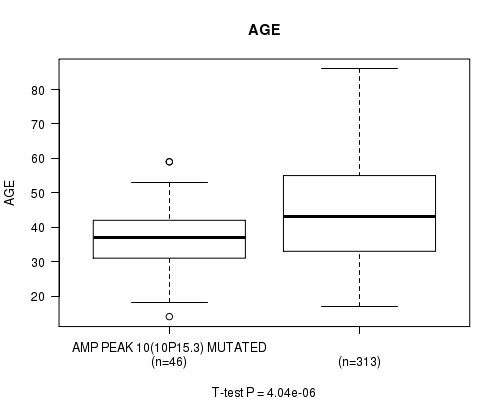
P value = 4.04e-06 (t-test), Q value = 0.0011
Table S8. Gene #10: 'amp_10p15.3' versus Clinical Feature #2: 'AGE'
| nPatients | Mean (Std.Dev) | |
|---|---|---|
| ALL | 359 | 43.6 (13.5) |
| AMP PEAK 10(10P15.3) MUTATED | 46 | 36.4 (9.9) |
| AMP PEAK 10(10P15.3) WILD-TYPE | 313 | 44.7 (13.6) |
Figure S8. Get High-res Image Gene #10: 'amp_10p15.3' versus Clinical Feature #2: 'AGE'
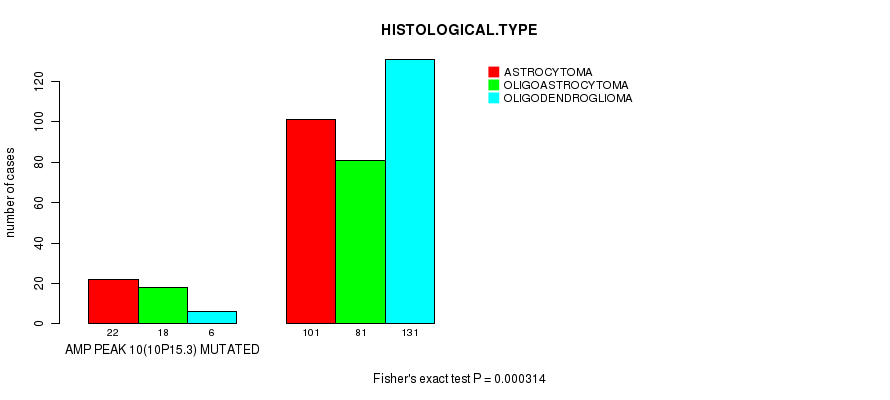
P value = 0.000314 (Fisher's exact test), Q value = 0.083
Table S9. Gene #10: 'amp_10p15.3' versus Clinical Feature #5: 'HISTOLOGICAL.TYPE'
| nPatients | ASTROCYTOMA | OLIGOASTROCYTOMA | OLIGODENDROGLIOMA |
|---|---|---|---|
| ALL | 123 | 99 | 137 |
| AMP PEAK 10(10P15.3) MUTATED | 22 | 18 | 6 |
| AMP PEAK 10(10P15.3) WILD-TYPE | 101 | 81 | 131 |
Figure S9. Get High-res Image Gene #10: 'amp_10p15.3' versus Clinical Feature #5: 'HISTOLOGICAL.TYPE'
P value = 2.57e-08 (logrank test), Q value = 7.3e-06
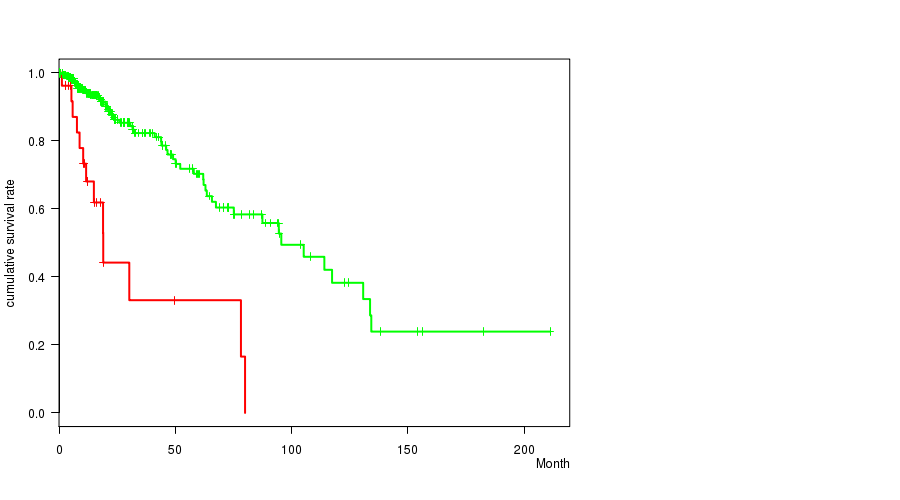
Table S10. Gene #13: 'amp_12q14.1' versus Clinical Feature #1: 'Time to Death'
| nPatients | nDeath | Duration Range (Median), Month | |
|---|---|---|---|
| ALL | 356 | 68 | 0.0 - 211.2 (14.8) |
| AMP PEAK 13(12Q14.1) MUTATED | 26 | 13 | 1.2 - 80.0 (11.9) |
| AMP PEAK 13(12Q14.1) WILD-TYPE | 330 | 55 | 0.0 - 211.2 (15.0) |
Figure S10. Get High-res Image Gene #13: 'amp_12q14.1' versus Clinical Feature #1: 'Time to Death'
P value = 0.000742 (t-test), Q value = 0.19
Table S11. Gene #13: 'amp_12q14.1' versus Clinical Feature #2: 'AGE'
| nPatients | Mean (Std.Dev) | |
|---|---|---|
| ALL | 359 | 43.6 (13.5) |
| AMP PEAK 13(12Q14.1) MUTATED | 26 | 52.7 (12.7) |
| AMP PEAK 13(12Q14.1) WILD-TYPE | 333 | 42.9 (13.3) |
Figure S11. Get High-res Image Gene #13: 'amp_12q14.1' versus Clinical Feature #2: 'AGE'
P value = 2.01e-05 (Fisher's exact test), Q value = 0.0055
Table S12. Gene #17: 'amp_19p13.3' versus Clinical Feature #5: 'HISTOLOGICAL.TYPE'
| nPatients | ASTROCYTOMA | OLIGOASTROCYTOMA | OLIGODENDROGLIOMA |
|---|---|---|---|
| ALL | 123 | 99 | 137 |
| AMP PEAK 17(19P13.3) MUTATED | 16 | 24 | 52 |
| AMP PEAK 17(19P13.3) WILD-TYPE | 107 | 75 | 85 |
Figure S12. Get High-res Image Gene #17: 'amp_19p13.3' versus Clinical Feature #5: 'HISTOLOGICAL.TYPE'
P value = 3.55e-06 (Fisher's exact test), Q value = 0.00098
Table S13. Gene #18: 'amp_19p13.2' versus Clinical Feature #5: 'HISTOLOGICAL.TYPE'
| nPatients | ASTROCYTOMA | OLIGOASTROCYTOMA | OLIGODENDROGLIOMA |
|---|---|---|---|
| ALL | 123 | 99 | 137 |
| AMP PEAK 18(19P13.2) MUTATED | 15 | 19 | 52 |
| AMP PEAK 18(19P13.2) WILD-TYPE | 108 | 80 | 85 |
Figure S13. Get High-res Image Gene #18: 'amp_19p13.2' versus Clinical Feature #5: 'HISTOLOGICAL.TYPE'
P value = 2.96e-06 (t-test), Q value = 0.00083
Table S14. Gene #20: 'del_1p36.23' versus Clinical Feature #2: 'AGE'
| nPatients | Mean (Std.Dev) | |
|---|---|---|
| ALL | 359 | 43.6 (13.5) |
| DEL PEAK 1(1P36.23) MUTATED | 152 | 47.4 (13.0) |
| DEL PEAK 1(1P36.23) WILD-TYPE | 207 | 40.8 (13.2) |
Figure S14. Get High-res Image Gene #20: 'del_1p36.23' versus Clinical Feature #2: 'AGE'
P value = 1.45e-24 (Fisher's exact test), Q value = 4.2e-22
Table S15. Gene #20: 'del_1p36.23' versus Clinical Feature #5: 'HISTOLOGICAL.TYPE'
| nPatients | ASTROCYTOMA | OLIGOASTROCYTOMA | OLIGODENDROGLIOMA |
|---|---|---|---|
| ALL | 123 | 99 | 137 |
| DEL PEAK 1(1P36.23) MUTATED | 15 | 36 | 101 |
| DEL PEAK 1(1P36.23) WILD-TYPE | 108 | 63 | 36 |
Figure S15. Get High-res Image Gene #20: 'del_1p36.23' versus Clinical Feature #5: 'HISTOLOGICAL.TYPE'
P value = 4.84e-05 (t-test), Q value = 0.013
Table S16. Gene #21: 'del_1p32.3' versus Clinical Feature #2: 'AGE'
| nPatients | Mean (Std.Dev) | |
|---|---|---|
| ALL | 359 | 43.6 (13.5) |
| DEL PEAK 2(1P32.3) MUTATED | 140 | 47.2 (13.1) |
| DEL PEAK 2(1P32.3) WILD-TYPE | 219 | 41.3 (13.3) |
Figure S16. Get High-res Image Gene #21: 'del_1p32.3' versus Clinical Feature #2: 'AGE'
P value = 1.96e-29 (Fisher's exact test), Q value = 5.7e-27
Table S17. Gene #21: 'del_1p32.3' versus Clinical Feature #5: 'HISTOLOGICAL.TYPE'
| nPatients | ASTROCYTOMA | OLIGOASTROCYTOMA | OLIGODENDROGLIOMA |
|---|---|---|---|
| ALL | 123 | 99 | 137 |
| DEL PEAK 2(1P32.3) MUTATED | 9 | 31 | 100 |
| DEL PEAK 2(1P32.3) WILD-TYPE | 114 | 68 | 37 |
Figure S17. Get High-res Image Gene #21: 'del_1p32.3' versus Clinical Feature #5: 'HISTOLOGICAL.TYPE'

P value = 0.000553 (Fisher's exact test), Q value = 0.14
Table S18. Gene #28: 'del_5q34' versus Clinical Feature #5: 'HISTOLOGICAL.TYPE'
| nPatients | ASTROCYTOMA | OLIGOASTROCYTOMA | OLIGODENDROGLIOMA |
|---|---|---|---|
| ALL | 123 | 99 | 137 |
| DEL PEAK 9(5Q34) MUTATED | 27 | 12 | 8 |
| DEL PEAK 9(5Q34) WILD-TYPE | 96 | 87 | 129 |
Figure S18. Get High-res Image Gene #28: 'del_5q34' versus Clinical Feature #5: 'HISTOLOGICAL.TYPE'
P value = 0.000141 (logrank test), Q value = 0.038
Table S19. Gene #29: 'del_6p25.3' versus Clinical Feature #1: 'Time to Death'
| nPatients | nDeath | Duration Range (Median), Month | |
|---|---|---|---|
| ALL | 356 | 68 | 0.0 - 211.2 (14.8) |
| DEL PEAK 10(6P25.3) MUTATED | 34 | 12 | 0.2 - 94.5 (17.9) |
| DEL PEAK 10(6P25.3) WILD-TYPE | 322 | 56 | 0.0 - 211.2 (14.5) |
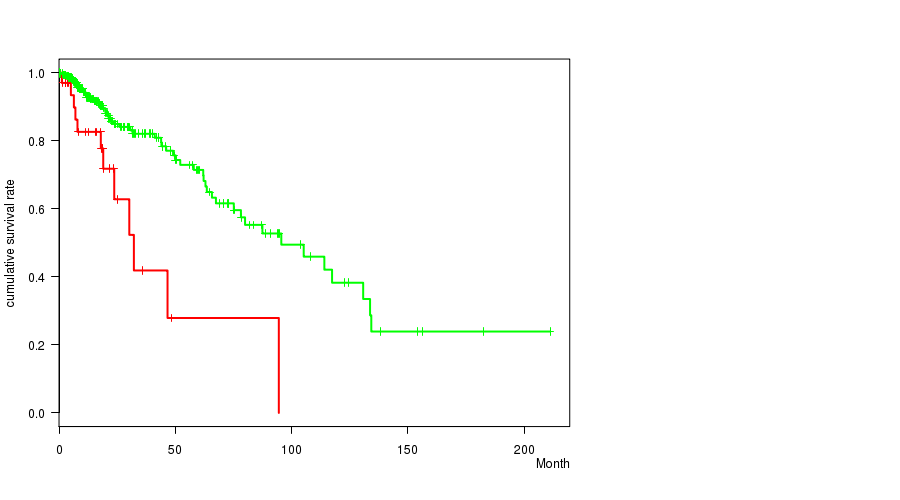
Figure S19. Get High-res Image Gene #29: 'del_6p25.3' versus Clinical Feature #1: 'Time to Death'
P value = 9.3e-05 (Fisher's exact test), Q value = 0.025
Table S20. Gene #30: 'del_6q24.3' versus Clinical Feature #5: 'HISTOLOGICAL.TYPE'
| nPatients | ASTROCYTOMA | OLIGOASTROCYTOMA | OLIGODENDROGLIOMA |
|---|---|---|---|
| ALL | 123 | 99 | 137 |
| DEL PEAK 11(6Q24.3) MUTATED | 33 | 11 | 11 |
| DEL PEAK 11(6Q24.3) WILD-TYPE | 90 | 88 | 126 |
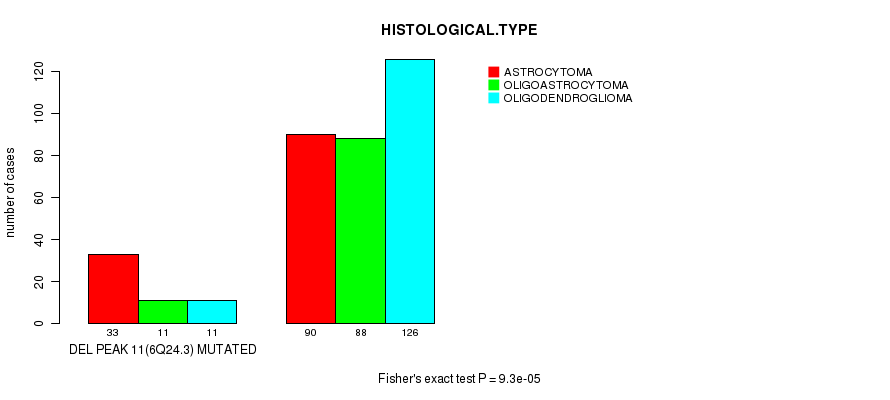
Figure S20. Get High-res Image Gene #30: 'del_6q24.3' versus Clinical Feature #5: 'HISTOLOGICAL.TYPE'
P value = 8.6e-05 (logrank test), Q value = 0.023
Table S21. Gene #33: 'del_9p23' versus Clinical Feature #1: 'Time to Death'
| nPatients | nDeath | Duration Range (Median), Month | |
|---|---|---|---|
| ALL | 356 | 68 | 0.0 - 211.2 (14.8) |
| DEL PEAK 14(9P23) MUTATED | 97 | 28 | 0.1 - 117.4 (14.7) |
| DEL PEAK 14(9P23) WILD-TYPE | 259 | 40 | 0.0 - 211.2 (15.0) |
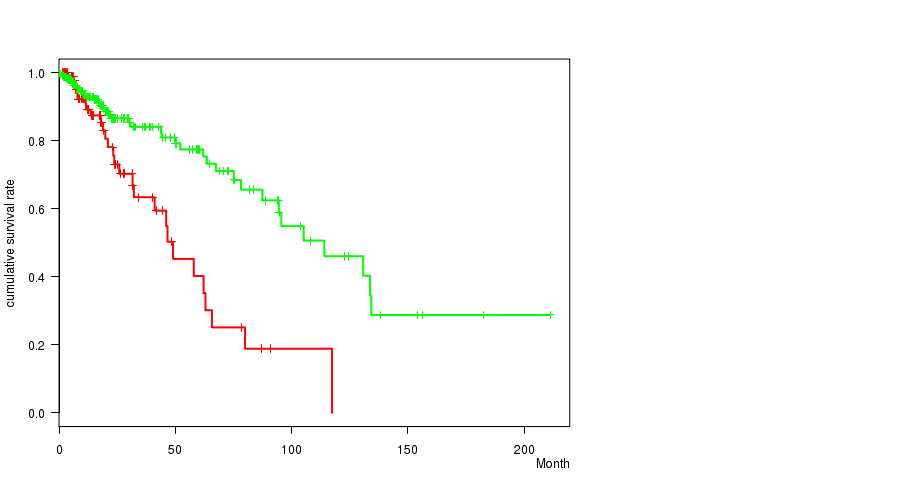
Figure S21. Get High-res Image Gene #33: 'del_9p23' versus Clinical Feature #1: 'Time to Death'
P value = 1.84e-10 (logrank test), Q value = 5.3e-08
Table S22. Gene #34: 'del_9p21.3' versus Clinical Feature #1: 'Time to Death'
| nPatients | nDeath | Duration Range (Median), Month | |
|---|---|---|---|
| ALL | 356 | 68 | 0.0 - 211.2 (14.8) |
| DEL PEAK 15(9P21.3) MUTATED | 117 | 39 | 0.1 - 117.4 (14.2) |
| DEL PEAK 15(9P21.3) WILD-TYPE | 239 | 29 | 0.0 - 211.2 (15.1) |
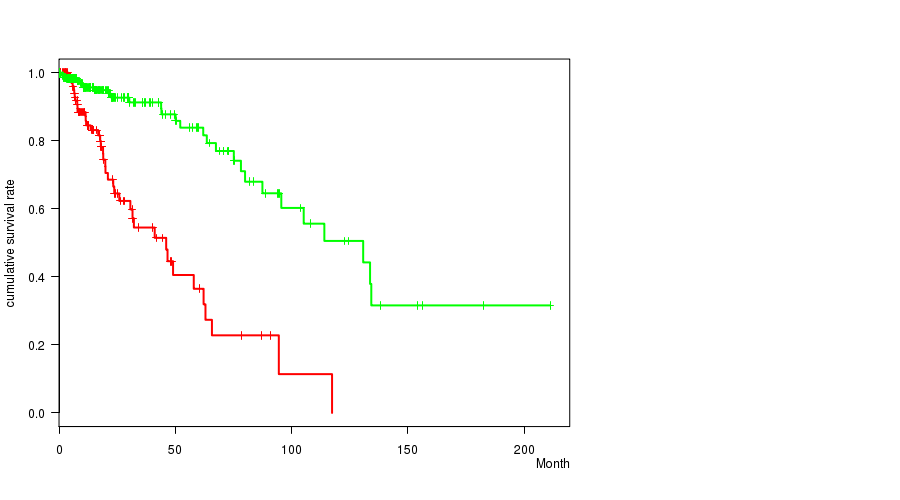
Figure S22. Get High-res Image Gene #34: 'del_9p21.3' versus Clinical Feature #1: 'Time to Death'
P value = 3.79e-06 (t-test), Q value = 0.001
Table S23. Gene #34: 'del_9p21.3' versus Clinical Feature #2: 'AGE'
| nPatients | Mean (Std.Dev) | |
|---|---|---|
| ALL | 359 | 43.6 (13.5) |
| DEL PEAK 15(9P21.3) MUTATED | 118 | 48.4 (13.9) |
| DEL PEAK 15(9P21.3) WILD-TYPE | 241 | 41.2 (12.6) |
Figure S23. Get High-res Image Gene #34: 'del_9p21.3' versus Clinical Feature #2: 'AGE'

P value = 1.71e-08 (logrank test), Q value = 4.9e-06
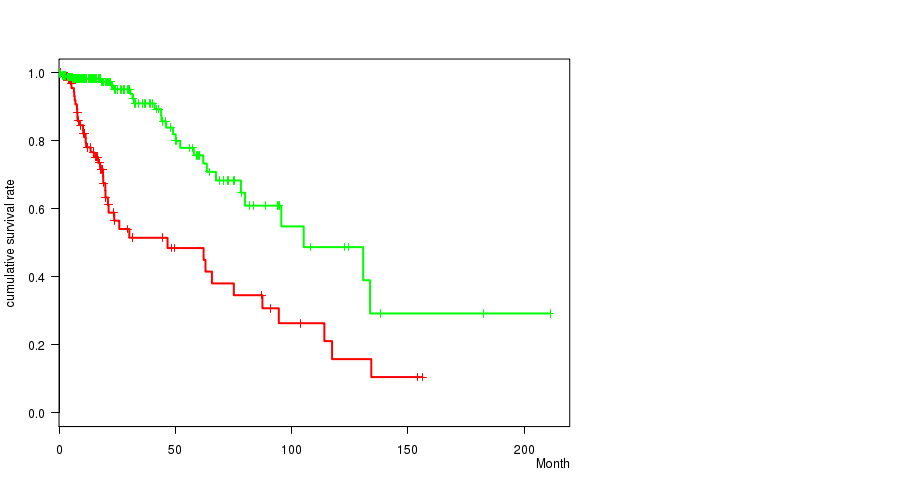
Table S24. Gene #35: 'del_10q26.3' versus Clinical Feature #1: 'Time to Death'
| nPatients | nDeath | Duration Range (Median), Month | |
|---|---|---|---|
| ALL | 356 | 68 | 0.0 - 211.2 (14.8) |
| DEL PEAK 16(10Q26.3) MUTATED | 103 | 41 | 0.1 - 156.2 (15.0) |
| DEL PEAK 16(10Q26.3) WILD-TYPE | 253 | 27 | 0.0 - 211.2 (14.6) |
Figure S24. Get High-res Image Gene #35: 'del_10q26.3' versus Clinical Feature #1: 'Time to Death'
P value = 2.45e-05 (t-test), Q value = 0.0066
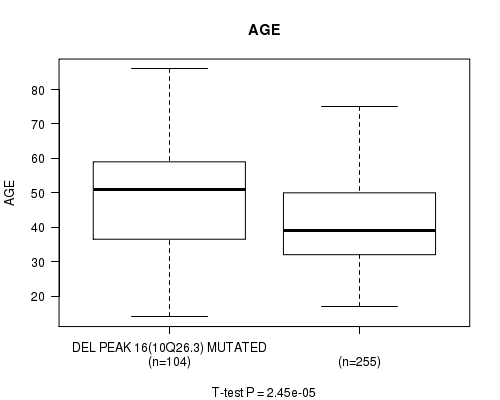
Table S25. Gene #35: 'del_10q26.3' versus Clinical Feature #2: 'AGE'
| nPatients | Mean (Std.Dev) | |
|---|---|---|
| ALL | 359 | 43.6 (13.5) |
| DEL PEAK 16(10Q26.3) MUTATED | 104 | 48.5 (14.2) |
| DEL PEAK 16(10Q26.3) WILD-TYPE | 255 | 41.6 (12.7) |
Figure S25. Get High-res Image Gene #35: 'del_10q26.3' versus Clinical Feature #2: 'AGE'
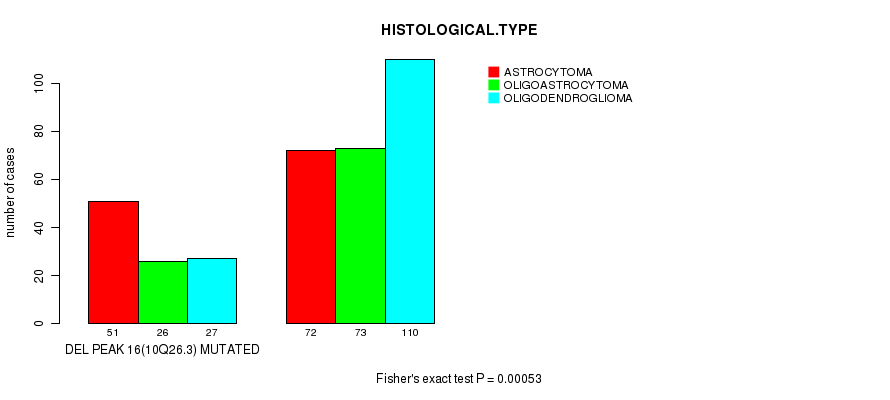
P value = 0.00053 (Fisher's exact test), Q value = 0.14
Table S26. Gene #35: 'del_10q26.3' versus Clinical Feature #5: 'HISTOLOGICAL.TYPE'
| nPatients | ASTROCYTOMA | OLIGOASTROCYTOMA | OLIGODENDROGLIOMA |
|---|---|---|---|
| ALL | 123 | 99 | 137 |
| DEL PEAK 16(10Q26.3) MUTATED | 51 | 26 | 27 |
| DEL PEAK 16(10Q26.3) WILD-TYPE | 72 | 73 | 110 |
Figure S26. Get High-res Image Gene #35: 'del_10q26.3' versus Clinical Feature #5: 'HISTOLOGICAL.TYPE'
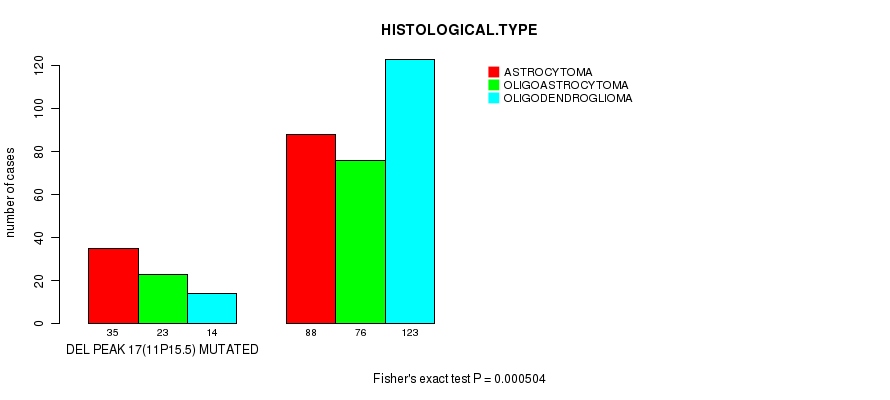
P value = 0.000504 (Fisher's exact test), Q value = 0.13
Table S27. Gene #36: 'del_11p15.5' versus Clinical Feature #5: 'HISTOLOGICAL.TYPE'
| nPatients | ASTROCYTOMA | OLIGOASTROCYTOMA | OLIGODENDROGLIOMA |
|---|---|---|---|
| ALL | 123 | 99 | 137 |
| DEL PEAK 17(11P15.5) MUTATED | 35 | 23 | 14 |
| DEL PEAK 17(11P15.5) WILD-TYPE | 88 | 76 | 123 |
Figure S27. Get High-res Image Gene #36: 'del_11p15.5' versus Clinical Feature #5: 'HISTOLOGICAL.TYPE'
P value = 0.000396 (logrank test), Q value = 0.1
Table S28. Gene #37: 'del_12p13.1' versus Clinical Feature #1: 'Time to Death'
| nPatients | nDeath | Duration Range (Median), Month | |
|---|---|---|---|
| ALL | 356 | 68 | 0.0 - 211.2 (14.8) |
| DEL PEAK 18(12P13.1) MUTATED | 26 | 9 | 0.1 - 63.0 (10.9) |
| DEL PEAK 18(12P13.1) WILD-TYPE | 330 | 59 | 0.0 - 211.2 (15.1) |
Figure S28. Get High-res Image Gene #37: 'del_12p13.1' versus Clinical Feature #1: 'Time to Death'
P value = 0.000266 (logrank test), Q value = 0.071
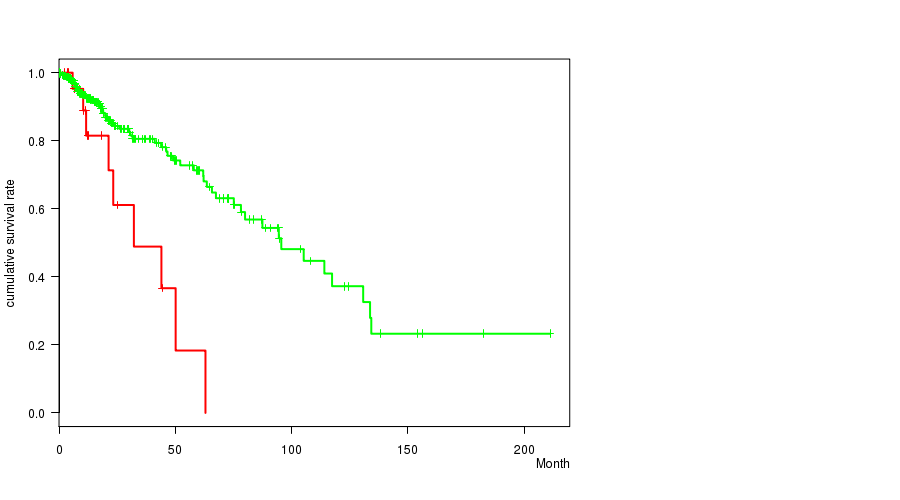
Table S29. Gene #42: 'del_14q24.3' versus Clinical Feature #1: 'Time to Death'
| nPatients | nDeath | Duration Range (Median), Month | |
|---|---|---|---|
| ALL | 356 | 68 | 0.0 - 211.2 (14.8) |
| DEL PEAK 23(14Q24.3) MUTATED | 81 | 28 | 0.2 - 130.8 (16.0) |
| DEL PEAK 23(14Q24.3) WILD-TYPE | 275 | 40 | 0.0 - 211.2 (14.3) |
Figure S29. Get High-res Image Gene #42: 'del_14q24.3' versus Clinical Feature #1: 'Time to Death'

P value = 3.05e-17 (Fisher's exact test), Q value = 8.7e-15
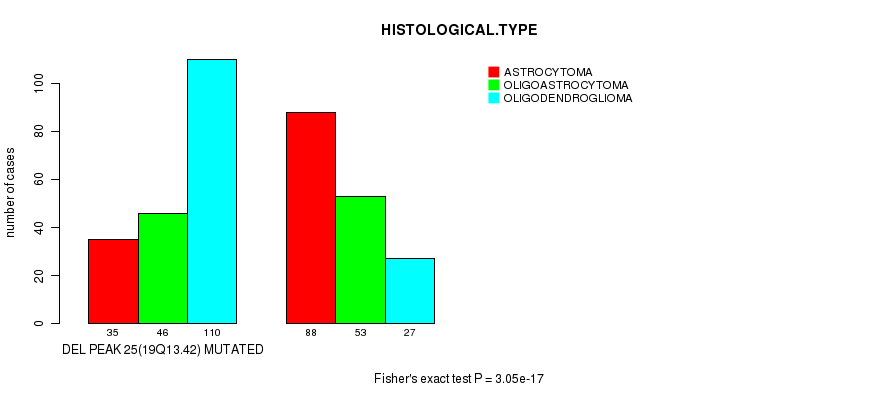
Table S30. Gene #44: 'del_19q13.42' versus Clinical Feature #5: 'HISTOLOGICAL.TYPE'
| nPatients | ASTROCYTOMA | OLIGOASTROCYTOMA | OLIGODENDROGLIOMA |
|---|---|---|---|
| ALL | 123 | 99 | 137 |
| DEL PEAK 25(19Q13.42) MUTATED | 35 | 46 | 110 |
| DEL PEAK 25(19Q13.42) WILD-TYPE | 88 | 53 | 27 |
Figure S30. Get High-res Image Gene #44: 'del_19q13.42' versus Clinical Feature #5: 'HISTOLOGICAL.TYPE'
-
Copy number data file = transformed.cor.cli.txt
-
Clinical data file = LGG-TP.merged_data.txt
-
Number of patients = 359
-
Number of significantly focal cnvs = 48
-
Number of selected clinical features = 6
-
Exclude genes that fewer than K tumors have mutations, K = 3
For survival clinical features, the Kaplan-Meier survival curves of tumors with and without gene mutations were plotted and the statistical significance P values were estimated by logrank test (Bland and Altman 2004) using the 'survdiff' function in R
For continuous numerical clinical features, two-tailed Student's t test with unequal variance (Lehmann and Romano 2005) was applied to compare the clinical values between tumors with and without gene mutations using 't.test' function in R
For binary or multi-class clinical features (nominal or ordinal), two-tailed Fisher's exact tests (Fisher 1922) were used to estimate the P values using the 'fisher.test' function in R
For multiple hypothesis correction, Q value is the False Discovery Rate (FDR) analogue of the P value (Benjamini and Hochberg 1995), defined as the minimum FDR at which the test may be called significant. We used the 'Benjamini and Hochberg' method of 'p.adjust' function in R to convert P values into Q values.
In addition to the links below, the full results of the analysis summarized in this report can also be downloaded programmatically using firehose_get, or interactively from either the Broad GDAC website or TCGA Data Coordination Center Portal.