This pipeline uses various statistical tests to identify genes whose promoter methylation levels correlated to selected clinical features.
Testing the association between 20136 genes and 6 clinical features across 357 samples, statistically thresholded by Q value < 0.05, 5 clinical features related to at least one genes.
-
866 genes correlated to 'AGE'.
-
TCHH , TRIM58 , SHISA2 , LOC150786 , FOXE3 , ...
-
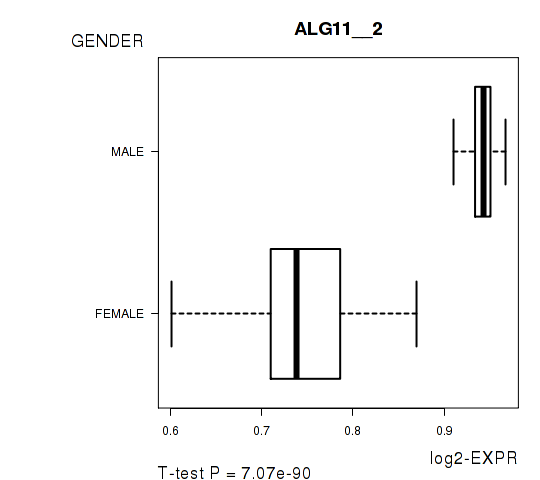
10 genes correlated to 'GENDER'.
-
ALG11__2 , UTP14C , POLDIP3 , RNU12 , KIF4B , ...
-
52 genes correlated to 'KARNOFSKY.PERFORMANCE.SCORE'.
-
PREP , TRIM26 , LNX1 , LAMB2L , DEGS1 , ...
-
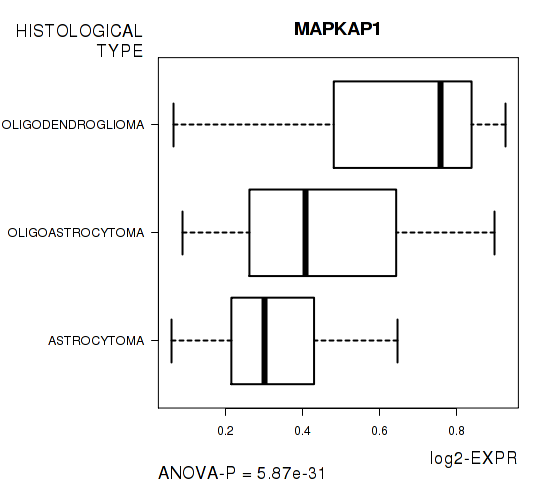
2101 genes correlated to 'HISTOLOGICAL.TYPE'.
-
MAPKAP1 , BVES , SLC2A4RG , REST , CBX2 , ...
-
624 genes correlated to 'RADIATIONS.RADIATION.REGIMENINDICATION'.
-
HSPA13 , DAZL , PPP1R8 , HNRNPK__1 , MIR7-1 , ...
-
No genes correlated to 'Time to Death'
Complete statistical result table is provided in Supplement Table 1
Table 1. Get Full Table This table shows the clinical features, statistical methods used, and the number of genes that are significantly associated with each clinical feature at Q value < 0.05.
| Clinical feature | Statistical test | Significant genes | Associated with | Associated with | ||
|---|---|---|---|---|---|---|
| Time to Death | Cox regression test | N=0 | ||||
| AGE | Spearman correlation test | N=866 | older | N=348 | younger | N=518 |
| GENDER | t test | N=10 | male | N=4 | female | N=6 |
| KARNOFSKY PERFORMANCE SCORE | Spearman correlation test | N=52 | higher score | N=52 | lower score | N=0 |
| HISTOLOGICAL TYPE | ANOVA test | N=2101 | ||||
| RADIATIONS RADIATION REGIMENINDICATION | t test | N=624 | yes | N=376 | no | N=248 |
Table S1. Basic characteristics of clinical feature: 'Time to Death'
| Time to Death | Duration (Months) | 0-211.2 (median=14.6) |
| censored | N = 290 | |
| death | N = 64 | |
| Significant markers | N = 0 |
Table S2. Basic characteristics of clinical feature: 'AGE'
| AGE | Mean (SD) | 43.46 (14) |
| Significant markers | N = 866 | |
| pos. correlated | 348 | |
| neg. correlated | 518 |
Table S3. Get Full Table List of top 10 genes significantly correlated to 'AGE' by Spearman correlation test
| SpearmanCorr | corrP | Q | |
|---|---|---|---|
| TCHH | 0.5448 | 5.502e-29 | 1.11e-24 |
| TRIM58 | 0.5378 | 3.757e-28 | 7.57e-24 |
| SHISA2 | 0.5313 | 2.119e-27 | 4.27e-23 |
| LOC150786 | 0.5258 | 9.044e-27 | 1.82e-22 |
| FOXE3 | 0.5091 | 8.395e-25 | 1.69e-20 |
| ADAMTSL3 | 0.5077 | 8.768e-25 | 1.77e-20 |
| GALNT14 | 0.502 | 3.426e-24 | 6.9e-20 |
| RELN | 0.4972 | 1.079e-23 | 2.17e-19 |
| SLC22A16 | 0.4938 | 2.409e-23 | 4.85e-19 |
| TFAP2B | 0.4927 | 3.13e-23 | 6.3e-19 |
Figure S1. Get High-res Image As an example, this figure shows the association of TCHH to 'AGE'. P value = 5.5e-29 with Spearman correlation analysis. The straight line presents the best linear regression.
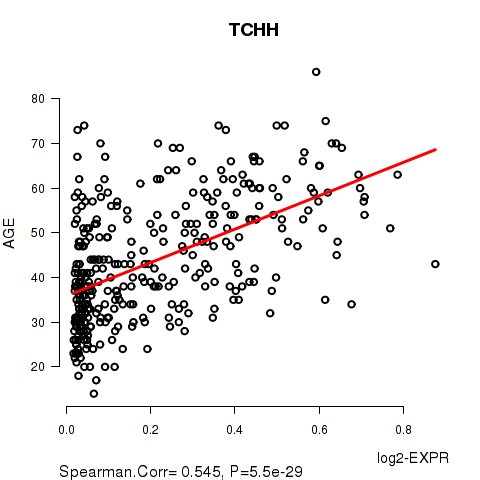
Table S4. Basic characteristics of clinical feature: 'GENDER'
| GENDER | Labels | N |
| FEMALE | 167 | |
| MALE | 190 | |
| Significant markers | N = 10 | |
| Higher in MALE | 4 | |
| Higher in FEMALE | 6 |
Table S5. Get Full Table List of 10 genes differentially expressed by 'GENDER'
| T(pos if higher in 'MALE') | ttestP | Q | AUC | |
|---|---|---|---|---|
| ALG11__2 | 33.65 | 7.068e-90 | 1.42e-85 | 0.983 |
| UTP14C | 33.65 | 7.068e-90 | 1.42e-85 | 0.983 |
| POLDIP3 | -20.17 | 1.121e-56 | 2.26e-52 | 0.9349 |
| RNU12 | -20.17 | 1.121e-56 | 2.26e-52 | 0.9349 |
| KIF4B | -11.1 | 5.943e-24 | 1.2e-19 | 0.7791 |
| WBP11P1 | 9.24 | 3.531e-18 | 7.11e-14 | 0.761 |
| B3GNT1__1 | 9.48 | 7.957e-18 | 1.6e-13 | 0.8276 |
| TLE1 | -6.48 | 3.313e-10 | 6.67e-06 | 0.7247 |
| ZNF839 | -6.35 | 7.226e-10 | 1.45e-05 | 0.7108 |
| FRG1B | -5.14 | 4.818e-07 | 0.0097 | 0.659 |
Figure S2. Get High-res Image As an example, this figure shows the association of ALG11__2 to 'GENDER'. P value = 7.07e-90 with T-test analysis.
52 genes related to 'KARNOFSKY.PERFORMANCE.SCORE'.
Table S6. Basic characteristics of clinical feature: 'KARNOFSKY.PERFORMANCE.SCORE'
| KARNOFSKY.PERFORMANCE.SCORE | Mean (SD) | 87.94 (12) |
| Significant markers | N = 52 | |
| pos. correlated | 52 | |
| neg. correlated | 0 |
Table S7. Get Full Table List of top 10 genes significantly correlated to 'KARNOFSKY.PERFORMANCE.SCORE' by Spearman correlation test
| SpearmanCorr | corrP | Q | |
|---|---|---|---|
| PREP | 0.3989 | 5.369e-09 | 0.000108 |
| TRIM26 | 0.3929 | 9.492e-09 | 0.000191 |
| LNX1 | 0.3636 | 1.304e-07 | 0.00263 |
| LAMB2L | 0.3633 | 1.337e-07 | 0.00269 |
| DEGS1 | 0.3615 | 1.549e-07 | 0.00312 |
| GXYLT1 | 0.3612 | 1.6e-07 | 0.00322 |
| PTGFRN | 0.3606 | 1.683e-07 | 0.00339 |
| PTN | 0.3596 | 1.83e-07 | 0.00368 |
| ALS2CR4 | 0.3571 | 2.245e-07 | 0.00452 |
| FAM131A | 0.3559 | 2.476e-07 | 0.00498 |
Figure S3. Get High-res Image As an example, this figure shows the association of PREP to 'KARNOFSKY.PERFORMANCE.SCORE'. P value = 5.37e-09 with Spearman correlation analysis. The straight line presents the best linear regression.

Table S8. Basic characteristics of clinical feature: 'HISTOLOGICAL.TYPE'
| HISTOLOGICAL.TYPE | Labels | N |
| ASTROCYTOMA | 122 | |
| OLIGOASTROCYTOMA | 98 | |
| OLIGODENDROGLIOMA | 137 | |
| Significant markers | N = 2101 |
Table S9. Get Full Table List of top 10 genes differentially expressed by 'HISTOLOGICAL.TYPE'
| ANOVA_P | Q | |
|---|---|---|
| MAPKAP1 | 5.867e-31 | 1.18e-26 |
| BVES | 3.587e-28 | 7.22e-24 |
| SLC2A4RG | 4.917e-28 | 9.9e-24 |
| REST | 1.166e-26 | 2.35e-22 |
| CBX2 | 3.073e-25 | 6.19e-21 |
| GLIS3 | 4.17e-25 | 8.39e-21 |
| CCDC88C | 6.911e-25 | 1.39e-20 |
| SNAPC2 | 1.103e-23 | 2.22e-19 |
| ASAP1 | 1.629e-23 | 3.28e-19 |
| P4HA1 | 4.191e-23 | 8.44e-19 |
Figure S4. Get High-res Image As an example, this figure shows the association of MAPKAP1 to 'HISTOLOGICAL.TYPE'. P value = 5.87e-31 with ANOVA analysis.
624 genes related to 'RADIATIONS.RADIATION.REGIMENINDICATION'.
Table S10. Basic characteristics of clinical feature: 'RADIATIONS.RADIATION.REGIMENINDICATION'
| RADIATIONS.RADIATION.REGIMENINDICATION | Labels | N |
| NO | 85 | |
| YES | 272 | |
| Significant markers | N = 624 | |
| Higher in YES | 376 | |
| Higher in NO | 248 |
Table S11. Get Full Table List of top 10 genes differentially expressed by 'RADIATIONS.RADIATION.REGIMENINDICATION'
| T(pos if higher in 'YES') | ttestP | Q | AUC | |
|---|---|---|---|---|
| HSPA13 | 12.96 | 1.468e-31 | 2.95e-27 | 0.7917 |
| DAZL | 11.13 | 1.897e-24 | 3.82e-20 | 0.77 |
| PPP1R8 | 10.99 | 3.888e-23 | 7.83e-19 | 0.7978 |
| HNRNPK__1 | 10.43 | 6.845e-22 | 1.38e-17 | 0.7614 |
| MIR7-1 | 10.43 | 6.845e-22 | 1.38e-17 | 0.7614 |
| ZFP91 | -10.4 | 1.172e-21 | 2.36e-17 | 0.7578 |
| ZFP91-CNTF | -10.4 | 1.172e-21 | 2.36e-17 | 0.7578 |
| ANKRD17 | 10.18 | 1.947e-21 | 3.92e-17 | 0.7594 |
| AMY2B | -10.12 | 2.656e-21 | 5.35e-17 | 0.7731 |
| RNPC3__1 | -10.12 | 2.656e-21 | 5.35e-17 | 0.7731 |
Figure S5. Get High-res Image As an example, this figure shows the association of HSPA13 to 'RADIATIONS.RADIATION.REGIMENINDICATION'. P value = 1.47e-31 with T-test analysis.

-
Expresson data file = LGG-TP.meth.by_min_clin_corr.data.txt
-
Clinical data file = LGG-TP.merged_data.txt
-
Number of patients = 357
-
Number of genes = 20136
-
Number of clinical features = 6
For survival clinical features, Wald's test in univariate Cox regression analysis with proportional hazards model (Andersen and Gill 1982) was used to estimate the P values using the 'coxph' function in R. Kaplan-Meier survival curves were plot using the four quartile subgroups of patients based on expression levels
For continuous numerical clinical features, Spearman's rank correlation coefficients (Spearman 1904) and two-tailed P values were estimated using 'cor.test' function in R
For two-class clinical features, two-tailed Student's t test with unequal variance (Lehmann and Romano 2005) was applied to compare the log2-expression levels between the two clinical classes using 't.test' function in R
For multi-class clinical features (ordinal or nominal), one-way analysis of variance (Howell 2002) was applied to compare the log2-expression levels between different clinical classes using 'anova' function in R
For multiple hypothesis correction, Q value is the False Discovery Rate (FDR) analogue of the P value (Benjamini and Hochberg 1995), defined as the minimum FDR at which the test may be called significant. We used the 'Benjamini and Hochberg' method of 'p.adjust' function in R to convert P values into Q values.
In addition to the links below, the full results of the analysis summarized in this report can also be downloaded programmatically using firehose_get, or interactively from either the Broad GDAC website or TCGA Data Coordination Center Portal.