This pipeline computes the correlation between significantly recurrent gene mutations and selected clinical features.
Testing the association between mutation status of 22 genes and 6 clinical features across 276 patients, 14 significant findings detected with Q value < 0.25.
-
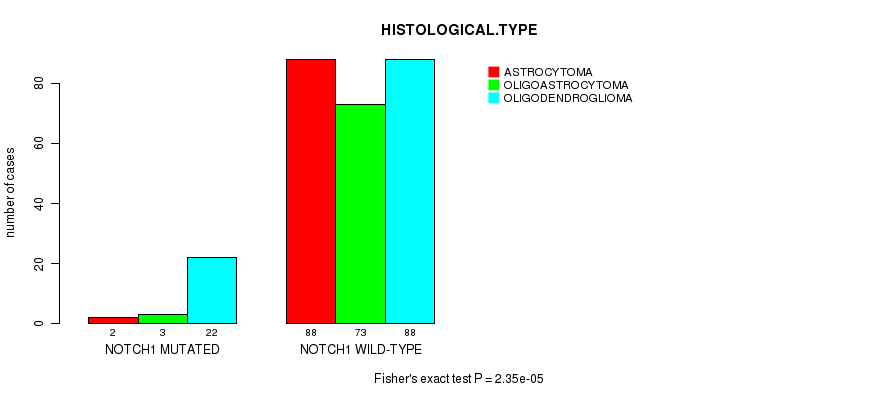
NOTCH1 mutation correlated to 'HISTOLOGICAL.TYPE'.
-
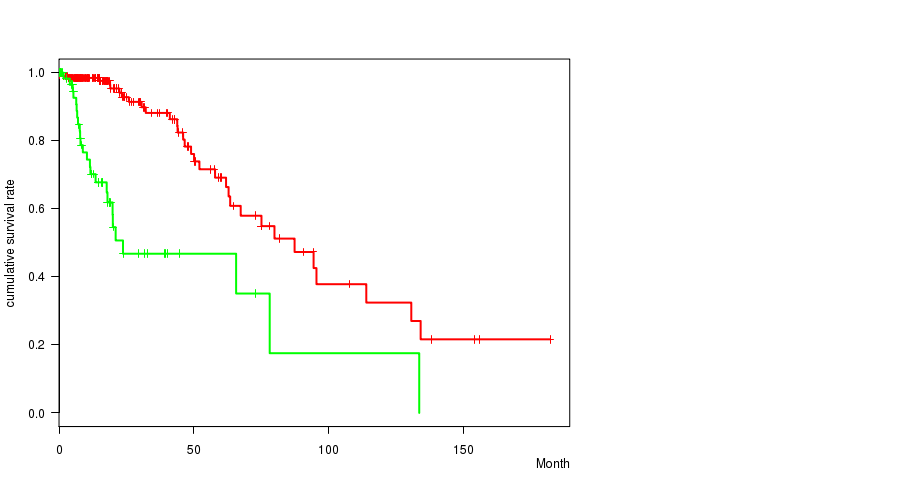
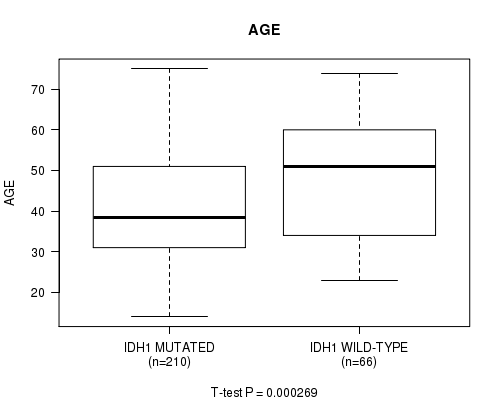
IDH1 mutation correlated to 'Time to Death' and 'AGE'.
-
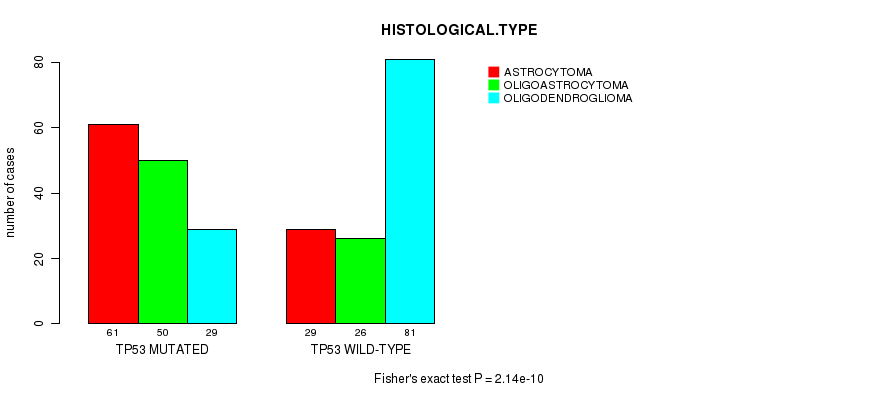
TP53 mutation correlated to 'AGE' and 'HISTOLOGICAL.TYPE'.
-
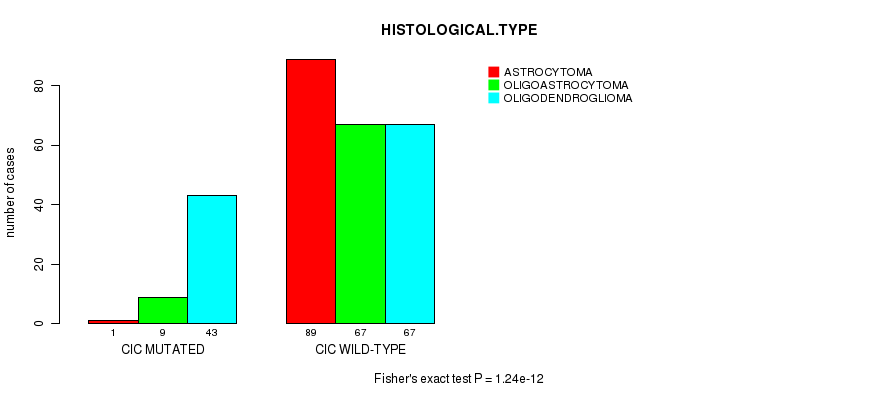
CIC mutation correlated to 'HISTOLOGICAL.TYPE'.
-
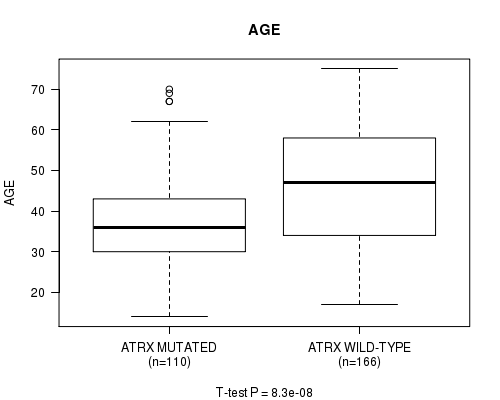
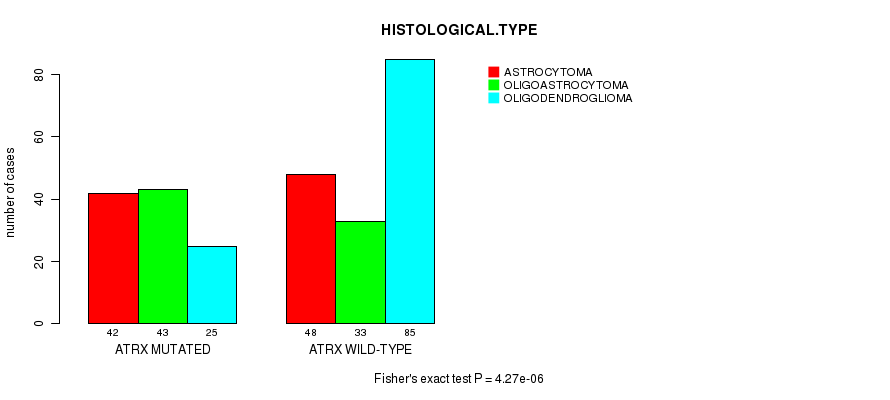
ATRX mutation correlated to 'AGE' and 'HISTOLOGICAL.TYPE'.
-
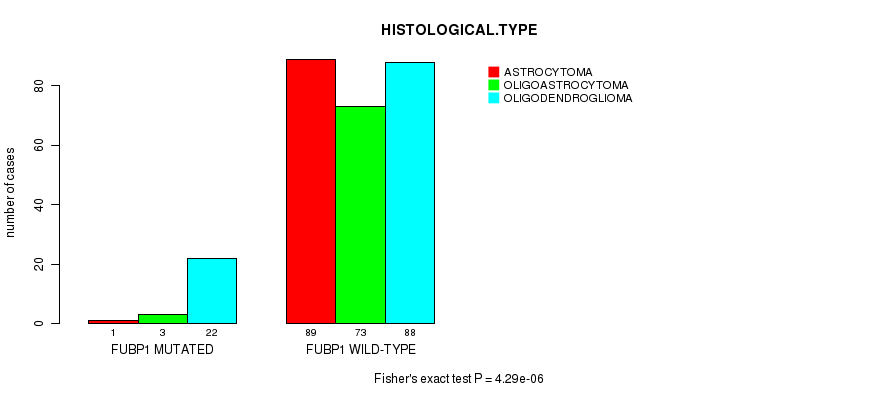
FUBP1 mutation correlated to 'HISTOLOGICAL.TYPE'.
-
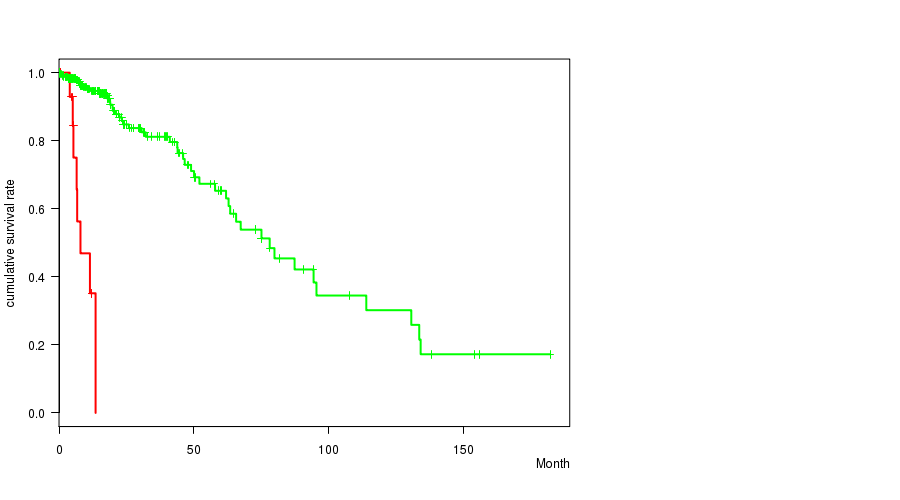
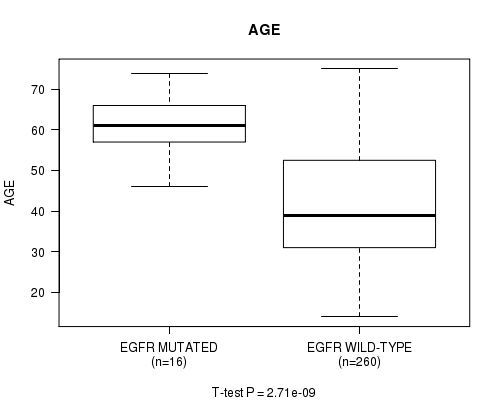
EGFR mutation correlated to 'Time to Death' and 'AGE'.
-
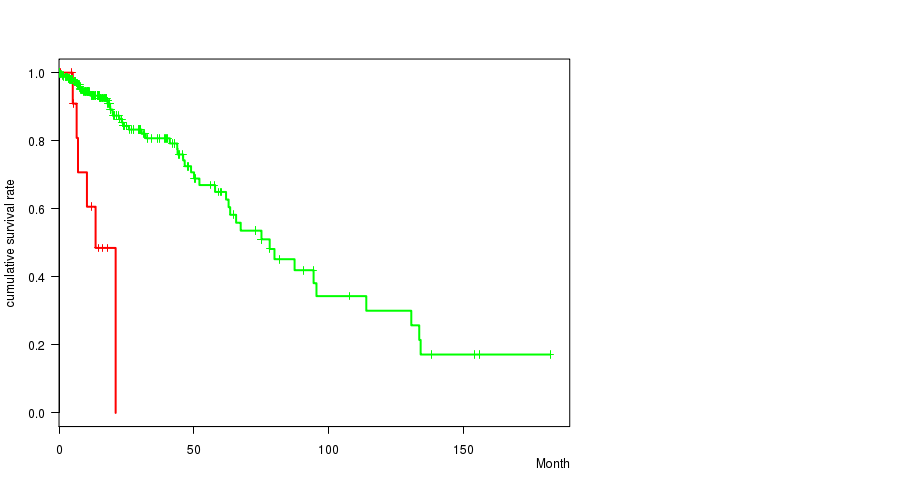
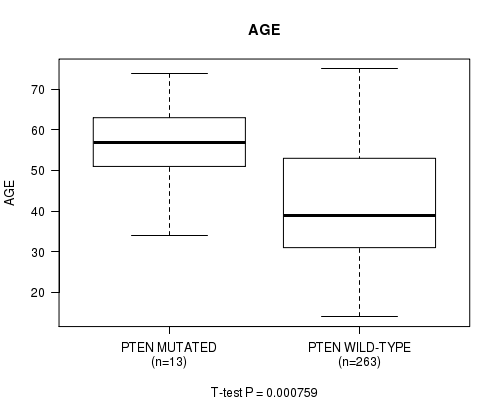
PTEN mutation correlated to 'Time to Death' and 'AGE'.
-
NF1 mutation correlated to 'Time to Death'.
Table 1. Get Full Table Overview of the association between mutation status of 22 genes and 6 clinical features. Shown in the table are P values (Q values). Thresholded by Q value < 0.25, 14 significant findings detected.
|
Clinical Features |
Time to Death |
AGE | GENDER |
KARNOFSKY PERFORMANCE SCORE |
HISTOLOGICAL TYPE |
RADIATIONS RADIATION REGIMENINDICATION |
||
| nMutated (%) | nWild-Type | logrank test | t-test | Fisher's exact test | t-test | Fisher's exact test | Fisher's exact test | |
| IDH1 | 210 (76%) | 66 |
4.56e-09 (5.74e-07) |
0.000269 (0.032) |
0.12 (1.00) |
0.0563 (1.00) |
0.0273 (1.00) |
0.761 (1.00) |
| TP53 | 140 (51%) | 136 |
0.358 (1.00) |
1.1e-07 (1.35e-05) |
0.146 (1.00) |
0.13 (1.00) |
2.14e-10 (2.74e-08) |
0.0264 (1.00) |
| ATRX | 110 (40%) | 166 |
0.0993 (1.00) |
8.3e-08 (1.03e-05) |
0.0853 (1.00) |
0.164 (1.00) |
4.27e-06 (0.000521) |
0.0633 (1.00) |
| EGFR | 16 (6%) | 260 |
0 (0) |
2.71e-09 (3.44e-07) |
0.797 (1.00) |
0.0484 (1.00) |
0.288 (1.00) |
0.161 (1.00) |
| PTEN | 13 (5%) | 263 |
3.91e-08 (4.89e-06) |
0.000759 (0.0888) |
0.573 (1.00) |
0.18 (1.00) |
0.00354 (0.408) |
0.547 (1.00) |
| NOTCH1 | 27 (10%) | 249 |
0.743 (1.00) |
0.0177 (1.00) |
1 (1.00) |
0.637 (1.00) |
2.35e-05 (0.00282) |
0.384 (1.00) |
| CIC | 53 (19%) | 223 |
0.0528 (1.00) |
0.372 (1.00) |
0.357 (1.00) |
0.364 (1.00) |
1.24e-12 (1.59e-10) |
0.0976 (1.00) |
| FUBP1 | 26 (9%) | 250 |
0.95 (1.00) |
0.00262 (0.304) |
0.839 (1.00) |
0.683 (1.00) |
4.29e-06 (0.000521) |
1 (1.00) |
| NF1 | 19 (7%) | 257 |
0.000494 (0.0583) |
0.235 (1.00) |
0.815 (1.00) |
0.453 (1.00) |
0.064 (1.00) |
0.124 (1.00) |
| PIK3CA | 25 (9%) | 251 |
0.0759 (1.00) |
0.139 (1.00) |
0.678 (1.00) |
0.545 (1.00) |
0.0455 (1.00) |
0.504 (1.00) |
| IDH2 | 12 (4%) | 264 |
0.253 (1.00) |
0.0376 (1.00) |
0.771 (1.00) |
0.983 (1.00) |
0.00834 (0.951) |
1 (1.00) |
| STK19 | 6 (2%) | 270 |
0.0724 (1.00) |
0.813 (1.00) |
0.412 (1.00) |
0.29 (1.00) |
0.249 (1.00) |
0.182 (1.00) |
| PIK3R1 | 12 (4%) | 264 |
0.537 (1.00) |
0.0594 (1.00) |
0.237 (1.00) |
0.927 (1.00) |
0.29 (1.00) |
0.198 (1.00) |
| PCDHAC2 | 14 (5%) | 262 |
0.673 (1.00) |
0.299 (1.00) |
0.785 (1.00) |
0.413 (1.00) |
0.379 (1.00) |
0.138 (1.00) |
| CREBZF | 4 (1%) | 272 |
0.746 (1.00) |
0.217 (1.00) |
0.327 (1.00) |
0.42 (1.00) |
0.464 (1.00) |
1 (1.00) |
| EIF1AX | 4 (1%) | 272 |
0.38 (1.00) |
0.993 (1.00) |
0.131 (1.00) |
0.983 (1.00) |
0.186 (1.00) |
0.589 (1.00) |
| HTRA2 | 4 (1%) | 272 |
0.847 (1.00) |
0.135 (1.00) |
0.631 (1.00) |
0.566 (1.00) |
0.315 (1.00) |
|
| VAV3 | 6 (2%) | 270 |
0.416 (1.00) |
0.921 (1.00) |
0.412 (1.00) |
0.0503 (1.00) |
0.882 (1.00) |
0.376 (1.00) |
| SPANXE | 4 (1%) | 272 |
0.388 (1.00) |
0.985 (1.00) |
1 (1.00) |
0.382 (1.00) |
1 (1.00) |
|
| TCF12 | 8 (3%) | 268 |
0.314 (1.00) |
0.0918 (1.00) |
1 (1.00) |
0.565 (1.00) |
0.161 (1.00) |
0.442 (1.00) |
| SMARCA4 | 13 (5%) | 263 |
0.106 (1.00) |
0.196 (1.00) |
0.779 (1.00) |
0.00975 (1.00) |
0.518 (1.00) |
0.119 (1.00) |
| BCOR | 9 (3%) | 267 |
0.958 (1.00) |
0.247 (1.00) |
0.0827 (1.00) |
0.0295 (1.00) |
0.58 (1.00) |
1 (1.00) |
P value = 2.35e-05 (Fisher's exact test), Q value = 0.0028
Table S1. Gene #1: 'NOTCH1 MUTATION STATUS' versus Clinical Feature #5: 'HISTOLOGICAL.TYPE'
| nPatients | ASTROCYTOMA | OLIGOASTROCYTOMA | OLIGODENDROGLIOMA |
|---|---|---|---|
| ALL | 90 | 76 | 110 |
| NOTCH1 MUTATED | 2 | 3 | 22 |
| NOTCH1 WILD-TYPE | 88 | 73 | 88 |
Figure S1. Get High-res Image Gene #1: 'NOTCH1 MUTATION STATUS' versus Clinical Feature #5: 'HISTOLOGICAL.TYPE'
P value = 4.56e-09 (logrank test), Q value = 5.7e-07
Table S2. Gene #4: 'IDH1 MUTATION STATUS' versus Clinical Feature #1: 'Time to Death'
| nPatients | nDeath | Duration Range (Median), Month | |
|---|---|---|---|
| ALL | 276 | 57 | 0.0 - 182.3 (15.1) |
| IDH1 MUTATED | 210 | 32 | 0.0 - 182.3 (16.0) |
| IDH1 WILD-TYPE | 66 | 25 | 0.1 - 133.7 (11.8) |
Figure S2. Get High-res Image Gene #4: 'IDH1 MUTATION STATUS' versus Clinical Feature #1: 'Time to Death'
P value = 0.000269 (t-test), Q value = 0.032
Table S3. Gene #4: 'IDH1 MUTATION STATUS' versus Clinical Feature #2: 'AGE'
| nPatients | Mean (Std.Dev) | |
|---|---|---|
| ALL | 276 | 42.9 (13.5) |
| IDH1 MUTATED | 210 | 41.1 (12.8) |
| IDH1 WILD-TYPE | 66 | 48.6 (14.3) |
Figure S3. Get High-res Image Gene #4: 'IDH1 MUTATION STATUS' versus Clinical Feature #2: 'AGE'
P value = 1.1e-07 (t-test), Q value = 1.4e-05
Table S4. Gene #5: 'TP53 MUTATION STATUS' versus Clinical Feature #2: 'AGE'
| nPatients | Mean (Std.Dev) | |
|---|---|---|
| ALL | 276 | 42.9 (13.5) |
| TP53 MUTATED | 140 | 38.8 (11.9) |
| TP53 WILD-TYPE | 136 | 47.2 (13.8) |
Figure S4. Get High-res Image Gene #5: 'TP53 MUTATION STATUS' versus Clinical Feature #2: 'AGE'

P value = 2.14e-10 (Fisher's exact test), Q value = 2.7e-08
Table S5. Gene #5: 'TP53 MUTATION STATUS' versus Clinical Feature #5: 'HISTOLOGICAL.TYPE'
| nPatients | ASTROCYTOMA | OLIGOASTROCYTOMA | OLIGODENDROGLIOMA |
|---|---|---|---|
| ALL | 90 | 76 | 110 |
| TP53 MUTATED | 61 | 50 | 29 |
| TP53 WILD-TYPE | 29 | 26 | 81 |
Figure S5. Get High-res Image Gene #5: 'TP53 MUTATION STATUS' versus Clinical Feature #5: 'HISTOLOGICAL.TYPE'
P value = 1.24e-12 (Fisher's exact test), Q value = 1.6e-10
Table S6. Gene #7: 'CIC MUTATION STATUS' versus Clinical Feature #5: 'HISTOLOGICAL.TYPE'
| nPatients | ASTROCYTOMA | OLIGOASTROCYTOMA | OLIGODENDROGLIOMA |
|---|---|---|---|
| ALL | 90 | 76 | 110 |
| CIC MUTATED | 1 | 9 | 43 |
| CIC WILD-TYPE | 89 | 67 | 67 |
Figure S6. Get High-res Image Gene #7: 'CIC MUTATION STATUS' versus Clinical Feature #5: 'HISTOLOGICAL.TYPE'
P value = 8.3e-08 (t-test), Q value = 1e-05
Table S7. Gene #8: 'ATRX MUTATION STATUS' versus Clinical Feature #2: 'AGE'
| nPatients | Mean (Std.Dev) | |
|---|---|---|
| ALL | 276 | 42.9 (13.5) |
| ATRX MUTATED | 110 | 37.8 (11.7) |
| ATRX WILD-TYPE | 166 | 46.3 (13.6) |
Figure S7. Get High-res Image Gene #8: 'ATRX MUTATION STATUS' versus Clinical Feature #2: 'AGE'
P value = 4.27e-06 (Fisher's exact test), Q value = 0.00052
Table S8. Gene #8: 'ATRX MUTATION STATUS' versus Clinical Feature #5: 'HISTOLOGICAL.TYPE'
| nPatients | ASTROCYTOMA | OLIGOASTROCYTOMA | OLIGODENDROGLIOMA |
|---|---|---|---|
| ALL | 90 | 76 | 110 |
| ATRX MUTATED | 42 | 43 | 25 |
| ATRX WILD-TYPE | 48 | 33 | 85 |
Figure S8. Get High-res Image Gene #8: 'ATRX MUTATION STATUS' versus Clinical Feature #5: 'HISTOLOGICAL.TYPE'
P value = 4.29e-06 (Fisher's exact test), Q value = 0.00052
Table S9. Gene #9: 'FUBP1 MUTATION STATUS' versus Clinical Feature #5: 'HISTOLOGICAL.TYPE'
| nPatients | ASTROCYTOMA | OLIGOASTROCYTOMA | OLIGODENDROGLIOMA |
|---|---|---|---|
| ALL | 90 | 76 | 110 |
| FUBP1 MUTATED | 1 | 3 | 22 |
| FUBP1 WILD-TYPE | 89 | 73 | 88 |
Figure S9. Get High-res Image Gene #9: 'FUBP1 MUTATION STATUS' versus Clinical Feature #5: 'HISTOLOGICAL.TYPE'
P value = 0 (logrank test), Q value = 0
Table S10. Gene #10: 'EGFR MUTATION STATUS' versus Clinical Feature #1: 'Time to Death'
| nPatients | nDeath | Duration Range (Median), Month | |
|---|---|---|---|
| ALL | 276 | 57 | 0.0 - 182.3 (15.1) |
| EGFR MUTATED | 16 | 8 | 0.5 - 13.6 (5.9) |
| EGFR WILD-TYPE | 260 | 49 | 0.0 - 182.3 (16.0) |
Figure S10. Get High-res Image Gene #10: 'EGFR MUTATION STATUS' versus Clinical Feature #1: 'Time to Death'
P value = 2.71e-09 (t-test), Q value = 3.4e-07
Table S11. Gene #10: 'EGFR MUTATION STATUS' versus Clinical Feature #2: 'AGE'
| nPatients | Mean (Std.Dev) | |
|---|---|---|
| ALL | 276 | 42.9 (13.5) |
| EGFR MUTATED | 16 | 61.1 (7.3) |
| EGFR WILD-TYPE | 260 | 41.8 (13.0) |
Figure S11. Get High-res Image Gene #10: 'EGFR MUTATION STATUS' versus Clinical Feature #2: 'AGE'
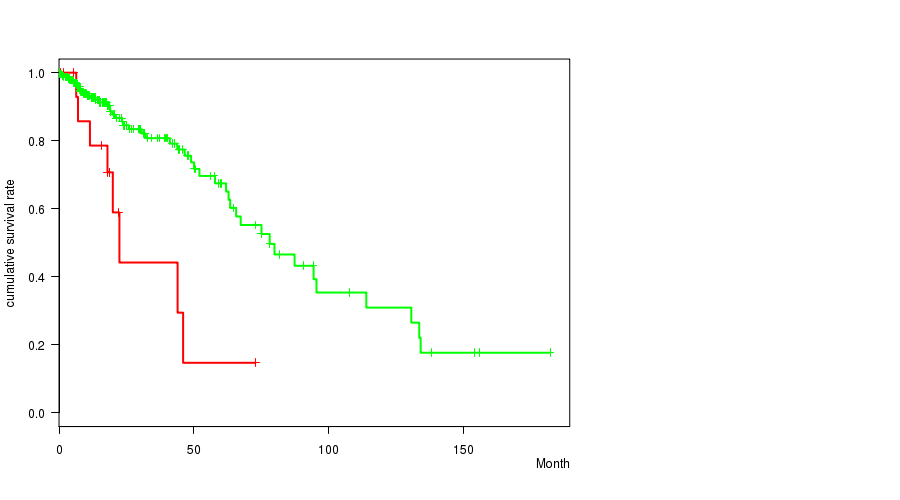
P value = 3.91e-08 (logrank test), Q value = 4.9e-06
Table S12. Gene #13: 'PTEN MUTATION STATUS' versus Clinical Feature #1: 'Time to Death'
| nPatients | nDeath | Duration Range (Median), Month | |
|---|---|---|---|
| ALL | 276 | 57 | 0.0 - 182.3 (15.1) |
| PTEN MUTATED | 13 | 6 | 0.5 - 21.0 (10.4) |
| PTEN WILD-TYPE | 263 | 51 | 0.0 - 182.3 (15.4) |
Figure S12. Get High-res Image Gene #13: 'PTEN MUTATION STATUS' versus Clinical Feature #1: 'Time to Death'
P value = 0.000759 (t-test), Q value = 0.089
Table S13. Gene #13: 'PTEN MUTATION STATUS' versus Clinical Feature #2: 'AGE'
| nPatients | Mean (Std.Dev) | |
|---|---|---|
| ALL | 276 | 42.9 (13.5) |
| PTEN MUTATED | 13 | 55.3 (10.5) |
| PTEN WILD-TYPE | 263 | 42.3 (13.4) |
Figure S13. Get High-res Image Gene #13: 'PTEN MUTATION STATUS' versus Clinical Feature #2: 'AGE'
P value = 0.000494 (logrank test), Q value = 0.058
Table S14. Gene #21: 'NF1 MUTATION STATUS' versus Clinical Feature #1: 'Time to Death'
| nPatients | nDeath | Duration Range (Median), Month | |
|---|---|---|---|
| ALL | 276 | 57 | 0.0 - 182.3 (15.1) |
| NF1 MUTATED | 19 | 8 | 0.2 - 73.0 (18.0) |
| NF1 WILD-TYPE | 257 | 49 | 0.0 - 182.3 (15.0) |
Figure S14. Get High-res Image Gene #21: 'NF1 MUTATION STATUS' versus Clinical Feature #1: 'Time to Death'
-
Mutation data file = transformed.cor.cli.txt
-
Clinical data file = LGG-TP.merged_data.txt
-
Number of patients = 276
-
Number of significantly mutated genes = 22
-
Number of selected clinical features = 6
-
Exclude genes that fewer than K tumors have mutations, K = 3
For survival clinical features, the Kaplan-Meier survival curves of tumors with and without gene mutations were plotted and the statistical significance P values were estimated by logrank test (Bland and Altman 2004) using the 'survdiff' function in R
For continuous numerical clinical features, two-tailed Student's t test with unequal variance (Lehmann and Romano 2005) was applied to compare the clinical values between tumors with and without gene mutations using 't.test' function in R
For binary or multi-class clinical features (nominal or ordinal), two-tailed Fisher's exact tests (Fisher 1922) were used to estimate the P values using the 'fisher.test' function in R
For multiple hypothesis correction, Q value is the False Discovery Rate (FDR) analogue of the P value (Benjamini and Hochberg 1995), defined as the minimum FDR at which the test may be called significant. We used the 'Benjamini and Hochberg' method of 'p.adjust' function in R to convert P values into Q values.
In addition to the links below, the full results of the analysis summarized in this report can also be downloaded programmatically using firehose_get, or interactively from either the Broad GDAC website or TCGA Data Coordination Center Portal.