This pipeline uses various statistical tests to identify RPPAs whose expression levels correlated to selected clinical features.
Testing the association between 189 genes and 6 clinical features across 248 samples, statistically thresholded by Q value < 0.05, 5 clinical features related to at least one genes.
-
12 genes correlated to 'Time to Death'.
-
ANXA1|ANNEXIN-1-M-E , MAPK14|P38_MAPK-R-V , SERPINE1|PAI-1-M-E , PGR|PR-R-V , CHEK2|CHK2_PT68-R-E , ...
-
3 genes correlated to 'AGE'.
-
IGFBP2|IGFBP2-R-V , PEA15|PEA15-R-V , SERPINE1|PAI-1-M-E
-
1 gene correlated to 'GENDER'.
-
RAB11A RAB11B|RAB11-R-E
-
1 gene correlated to 'KARNOFSKY.PERFORMANCE.SCORE'.
-
IGFBP2|IGFBP2-R-V
-
27 genes correlated to 'HISTOLOGICAL.TYPE'.
-
SYK|SYK-M-V , ANXA1|ANNEXIN-1-M-E , BAX|BAX-R-V , AR|AR-R-V , PTEN|PTEN-R-V , ...
-
No genes correlated to 'RADIATIONS.RADIATION.REGIMENINDICATION'
Complete statistical result table is provided in Supplement Table 1
Table 1. Get Full Table This table shows the clinical features, statistical methods used, and the number of genes that are significantly associated with each clinical feature at Q value < 0.05.
| Clinical feature | Statistical test | Significant genes | Associated with | Associated with | ||
|---|---|---|---|---|---|---|
| Time to Death | Cox regression test | N=12 | shorter survival | N=7 | longer survival | N=5 |
| AGE | Spearman correlation test | N=3 | older | N=2 | younger | N=1 |
| GENDER | t test | N=1 | male | N=1 | female | N=0 |
| KARNOFSKY PERFORMANCE SCORE | Spearman correlation test | N=1 | higher score | N=0 | lower score | N=1 |
| HISTOLOGICAL TYPE | ANOVA test | N=27 | ||||
| RADIATIONS RADIATION REGIMENINDICATION | t test | N=0 |
Table S1. Basic characteristics of clinical feature: 'Time to Death'
| Time to Death | Duration (Months) | 0-211.2 (median=16.4) |
| censored | N = 193 | |
| death | N = 55 | |
| Significant markers | N = 12 | |
| associated with shorter survival | 7 | |
| associated with longer survival | 5 |
Table S2. Get Full Table List of top 10 genes significantly associated with 'Time to Death' by Cox regression test
| HazardRatio | Wald_P | Q | C_index | |
|---|---|---|---|---|
| ANXA1|ANNEXIN-1-M-E | 2.1 | 2.03e-07 | 3.8e-05 | 0.721 |
| MAPK14|P38_MAPK-R-V | 3.7 | 1.378e-05 | 0.0026 | 0.691 |
| SERPINE1|PAI-1-M-E | 2.3 | 1.509e-05 | 0.0028 | 0.68 |
| PGR|PR-R-V | 0 | 4.747e-05 | 0.0088 | 0.3 |
| CHEK2|CHK2_PT68-R-E | 0.03 | 0.0001022 | 0.019 | 0.317 |
| SMAD1|SMAD1-R-V | 5.3 | 0.0001085 | 0.02 | 0.645 |
| INPP4B|INPP4B-G-E | 0.13 | 0.0001132 | 0.021 | 0.358 |
| BAX|BAX-R-V | 5.1 | 0.0001653 | 0.03 | 0.669 |
| IGFBP2|IGFBP2-R-V | 2.1 | 0.0001816 | 0.033 | 0.735 |
| RAB11A RAB11B|RAB11-R-E | 0.04 | 0.0002358 | 0.042 | 0.309 |
Figure S1. Get High-res Image As an example, this figure shows the association of ANXA1|ANNEXIN-1-M-E to 'Time to Death'. four curves present the cumulative survival rates of 4 quartile subsets of patients. P value = 2.03e-07 with univariate Cox regression analysis using continuous log-2 expression values.
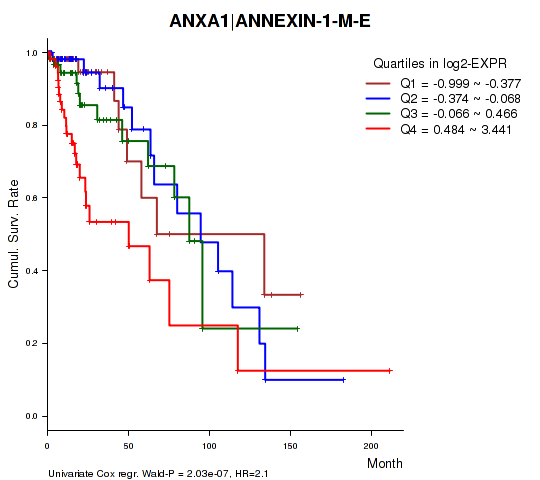
Table S3. Basic characteristics of clinical feature: 'AGE'
| AGE | Mean (SD) | 42.79 (13) |
| Significant markers | N = 3 | |
| pos. correlated | 2 | |
| neg. correlated | 1 |
Table S4. Get Full Table List of 3 genes significantly correlated to 'AGE' by Spearman correlation test
| SpearmanCorr | corrP | Q | |
|---|---|---|---|
| IGFBP2|IGFBP2-R-V | 0.3275 | 1.303e-07 | 2.46e-05 |
| PEA15|PEA15-R-V | -0.2942 | 2.421e-06 | 0.000455 |
| SERPINE1|PAI-1-M-E | 0.2843 | 5.417e-06 | 0.00101 |
Figure S2. Get High-res Image As an example, this figure shows the association of IGFBP2|IGFBP2-R-V to 'AGE'. P value = 1.3e-07 with Spearman correlation analysis. The straight line presents the best linear regression.
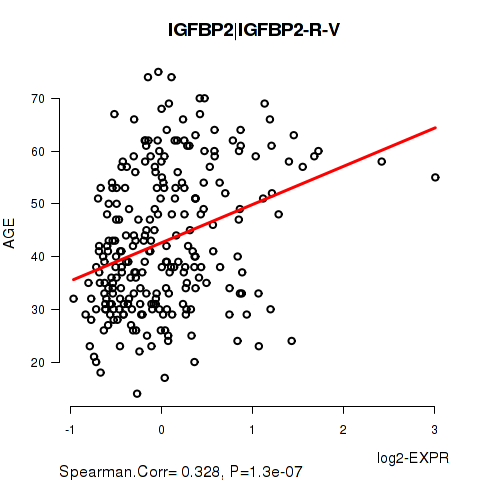
Table S5. Basic characteristics of clinical feature: 'GENDER'
| GENDER | Labels | N |
| FEMALE | 107 | |
| MALE | 141 | |
| Significant markers | N = 1 | |
| Higher in MALE | 1 | |
| Higher in FEMALE | 0 |
Table S6. Get Full Table List of one gene differentially expressed by 'GENDER'
| T(pos if higher in 'MALE') | ttestP | Q | AUC | |
|---|---|---|---|---|
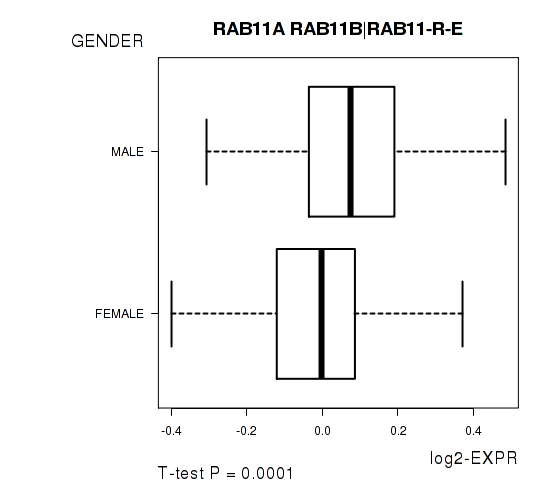
| RAB11A RAB11B|RAB11-R-E | 3.96 | 0.0001003 | 0.019 | 0.642 |
Figure S3. Get High-res Image As an example, this figure shows the association of RAB11A RAB11B|RAB11-R-E to 'GENDER'. P value = 0.0001 with T-test analysis.
One gene related to 'KARNOFSKY.PERFORMANCE.SCORE'.
Table S7. Basic characteristics of clinical feature: 'KARNOFSKY.PERFORMANCE.SCORE'
| KARNOFSKY.PERFORMANCE.SCORE | Mean (SD) | 87.43 (11) |
| Significant markers | N = 1 | |
| pos. correlated | 0 | |
| neg. correlated | 1 |
Table S8. Get Full Table List of one gene significantly correlated to 'KARNOFSKY.PERFORMANCE.SCORE' by Spearman correlation test
| SpearmanCorr | corrP | Q | |
|---|---|---|---|
| IGFBP2|IGFBP2-R-V | -0.3524 | 0.0001709 | 0.0323 |
Figure S4. Get High-res Image As an example, this figure shows the association of IGFBP2|IGFBP2-R-V to 'KARNOFSKY.PERFORMANCE.SCORE'. P value = 0.000171 with Spearman correlation analysis. The straight line presents the best linear regression.
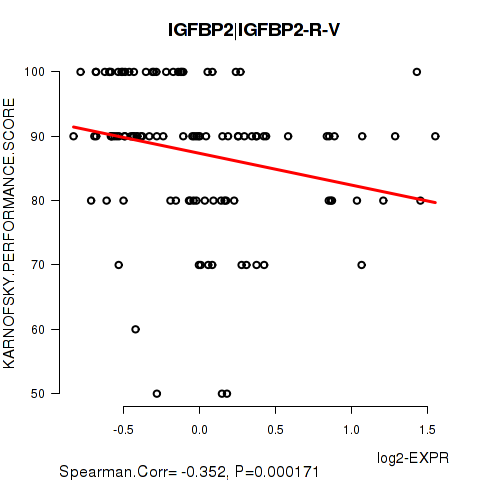
Table S9. Basic characteristics of clinical feature: 'HISTOLOGICAL.TYPE'
| HISTOLOGICAL.TYPE | Labels | N |
| ASTROCYTOMA | 79 | |
| OLIGOASTROCYTOMA | 70 | |
| OLIGODENDROGLIOMA | 99 | |
| Significant markers | N = 27 |
Table S10. Get Full Table List of top 10 genes differentially expressed by 'HISTOLOGICAL.TYPE'
| ANOVA_P | Q | |
|---|---|---|
| SYK|SYK-M-V | 6.511e-15 | 1.23e-12 |
| ANXA1|ANNEXIN-1-M-E | 2.047e-09 | 3.85e-07 |
| BAX|BAX-R-V | 4.87e-08 | 9.11e-06 |
| AR|AR-R-V | 1.041e-07 | 1.94e-05 |
| PTEN|PTEN-R-V | 1.955e-07 | 3.62e-05 |
| MAPK14|P38_MAPK-R-V | 2.036e-07 | 3.75e-05 |
| YAP1|YAP_PS127-R-E | 2.194e-07 | 4.02e-05 |
| ERBB3|HER3_PY1289-R-C | 2.118e-06 | 0.000385 |
| ACACA|ACC1-R-E | 4.219e-06 | 0.000764 |
| KIT|C-KIT-R-V | 5.348e-06 | 0.000963 |
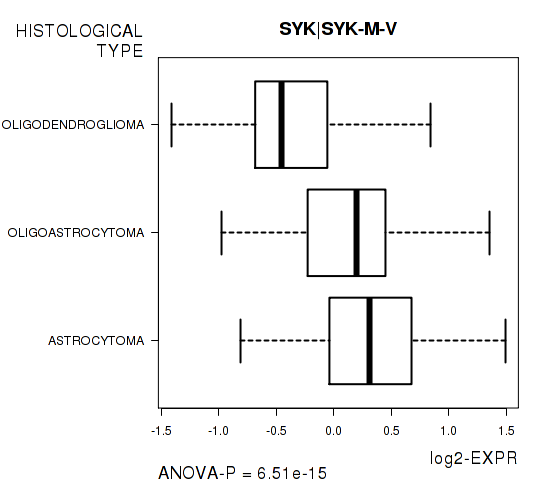
Figure S5. Get High-res Image As an example, this figure shows the association of SYK|SYK-M-V to 'HISTOLOGICAL.TYPE'. P value = 6.51e-15 with ANOVA analysis.
No gene related to 'RADIATIONS.RADIATION.REGIMENINDICATION'.
Table S11. Basic characteristics of clinical feature: 'RADIATIONS.RADIATION.REGIMENINDICATION'
| RADIATIONS.RADIATION.REGIMENINDICATION | Labels | N |
| NO | 84 | |
| YES | 164 | |
| Significant markers | N = 0 |
-
Expresson data file = LGG-TP.rppa.txt
-
Clinical data file = LGG-TP.merged_data.txt
-
Number of patients = 248
-
Number of genes = 189
-
Number of clinical features = 6
For survival clinical features, Wald's test in univariate Cox regression analysis with proportional hazards model (Andersen and Gill 1982) was used to estimate the P values using the 'coxph' function in R. Kaplan-Meier survival curves were plot using the four quartile subgroups of patients based on expression levels
For continuous numerical clinical features, Spearman's rank correlation coefficients (Spearman 1904) and two-tailed P values were estimated using 'cor.test' function in R
For two-class clinical features, two-tailed Student's t test with unequal variance (Lehmann and Romano 2005) was applied to compare the log2-expression levels between the two clinical classes using 't.test' function in R
For multi-class clinical features (ordinal or nominal), one-way analysis of variance (Howell 2002) was applied to compare the log2-expression levels between different clinical classes using 'anova' function in R
For multiple hypothesis correction, Q value is the False Discovery Rate (FDR) analogue of the P value (Benjamini and Hochberg 1995), defined as the minimum FDR at which the test may be called significant. We used the 'Benjamini and Hochberg' method of 'p.adjust' function in R to convert P values into Q values.
In addition to the links below, the full results of the analysis summarized in this report can also be downloaded programmatically using firehose_get, or interactively from either the Broad GDAC website or TCGA Data Coordination Center Portal.