This pipeline uses various statistical tests to identify mRNAs whose expression levels correlated to selected clinical features.
Testing the association between 18339 genes and 6 clinical features across 359 samples, statistically thresholded by Q value < 0.05, 6 clinical features related to at least one genes.
-
1429 genes correlated to 'Time to Death'.
-
CRTAC1|55118 , SLITRK5|26050 , FNDC3B|64778 , LOC254559|254559 , ARL3|403 , ...
-
755 genes correlated to 'AGE'.
-
SYT6|148281 , PRSS35|167681 , ABI1|10006 , EN1|2019 , IL17RC|84818 , ...
-
34 genes correlated to 'GENDER'.
-
XIST|7503 , ZFY|7544 , PRKY|5616 , RPS4Y1|6192 , NLGN4Y|22829 , ...
-
30 genes correlated to 'KARNOFSKY.PERFORMANCE.SCORE'.
-
RPL3|6122 , RPL15|6138 , C12ORF5|57103 , VAV3|10451 , EEF1A1|1915 , ...
-
3904 genes correlated to 'HISTOLOGICAL.TYPE'.
-
AK2|204 , TXNDC12|51060 , NADK|65220 , HDAC1|3065 , ASAP3|55616 , ...
-
334 genes correlated to 'RADIATIONS.RADIATION.REGIMENINDICATION'.
-
EXD3|54932 , NSUN5P2|260294 , RHOT2|89941 , MAN2C1|4123 , CENPT|80152 , ...
Complete statistical result table is provided in Supplement Table 1
Table 1. Get Full Table This table shows the clinical features, statistical methods used, and the number of genes that are significantly associated with each clinical feature at Q value < 0.05.
| Clinical feature | Statistical test | Significant genes | Associated with | Associated with | ||
|---|---|---|---|---|---|---|
| Time to Death | Cox regression test | N=1429 | shorter survival | N=779 | longer survival | N=650 |
| AGE | Spearman correlation test | N=755 | older | N=361 | younger | N=394 |
| GENDER | t test | N=34 | male | N=19 | female | N=15 |
| KARNOFSKY PERFORMANCE SCORE | Spearman correlation test | N=30 | higher score | N=18 | lower score | N=12 |
| HISTOLOGICAL TYPE | ANOVA test | N=3904 | ||||
| RADIATIONS RADIATION REGIMENINDICATION | t test | N=334 | yes | N=299 | no | N=35 |
Table S1. Basic characteristics of clinical feature: 'Time to Death'
| Time to Death | Duration (Months) | 0-211.2 (median=14.9) |
| censored | N = 288 | |
| death | N = 68 | |
| Significant markers | N = 1429 | |
| associated with shorter survival | 779 | |
| associated with longer survival | 650 |
Table S2. Get Full Table List of top 10 genes significantly associated with 'Time to Death' by Cox regression test
| HazardRatio | Wald_P | Q | C_index | |
|---|---|---|---|---|
| CRTAC1|55118 | 0.61 | 0 | 0 | 0.214 |
| SLITRK5|26050 | 0.47 | 1.11e-16 | 2e-12 | 0.25 |
| FNDC3B|64778 | 3.7 | 3.331e-16 | 6.1e-12 | 0.789 |
| LOC254559|254559 | 0.55 | 1.221e-15 | 2.2e-11 | 0.198 |
| ARL3|403 | 0.17 | 1.665e-15 | 3.1e-11 | 0.2 |
| CUEDC2|79004 | 0.1 | 3.109e-15 | 5.7e-11 | 0.221 |
| IGFBP2|3485 | 1.56 | 8.216e-15 | 1.5e-10 | 0.806 |
| RANBP17|64901 | 0.63 | 9.77e-15 | 1.8e-10 | 0.293 |
| CNRIP1|25927 | 0.3 | 9.992e-15 | 1.8e-10 | 0.24 |
| IGF2BP3|10643 | 1.5 | 1.721e-14 | 3.2e-10 | 0.768 |
Figure S1. Get High-res Image As an example, this figure shows the association of CRTAC1|55118 to 'Time to Death'. four curves present the cumulative survival rates of 4 quartile subsets of patients. P value = 0 with univariate Cox regression analysis using continuous log-2 expression values.
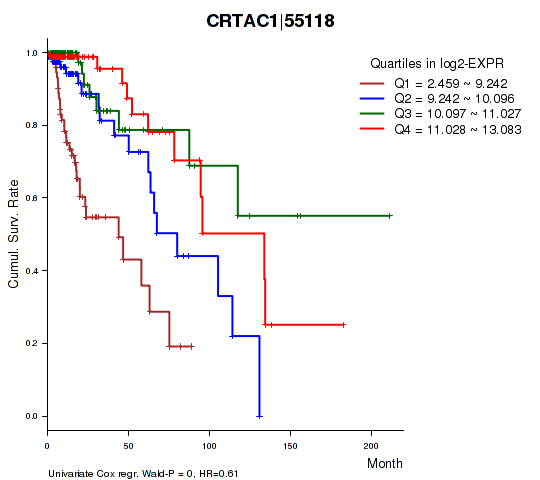
Table S3. Basic characteristics of clinical feature: 'AGE'
| AGE | Mean (SD) | 43.57 (14) |
| Significant markers | N = 755 | |
| pos. correlated | 361 | |
| neg. correlated | 394 |
Table S4. Get Full Table List of top 10 genes significantly correlated to 'AGE' by Spearman correlation test
| SpearmanCorr | corrP | Q | |
|---|---|---|---|
| SYT6|148281 | -0.4568 | 6.54e-20 | 1.2e-15 |
| PRSS35|167681 | -0.4265 | 2.677e-17 | 4.91e-13 |
| ABI1|10006 | -0.4215 | 6.815e-17 | 1.25e-12 |
| EN1|2019 | 0.4627 | 1.589e-16 | 2.91e-12 |
| IL17RC|84818 | 0.4026 | 2.006e-15 | 3.68e-11 |
| RIN1|9610 | 0.4008 | 2.773e-15 | 5.08e-11 |
| CTBP2|1488 | -0.4003 | 3.021e-15 | 5.54e-11 |
| SFRP2|6423 | -0.3992 | 3.625e-15 | 6.65e-11 |
| CNTN3|5067 | -0.3986 | 4.064e-15 | 7.45e-11 |
| TCTA|6988 | 0.3975 | 4.846e-15 | 8.88e-11 |
Figure S2. Get High-res Image As an example, this figure shows the association of SYT6|148281 to 'AGE'. P value = 6.54e-20 with Spearman correlation analysis. The straight line presents the best linear regression.

Table S5. Basic characteristics of clinical feature: 'GENDER'
| GENDER | Labels | N |
| FEMALE | 165 | |
| MALE | 194 | |
| Significant markers | N = 34 | |
| Higher in MALE | 19 | |
| Higher in FEMALE | 15 |
Table S6. Get Full Table List of top 10 genes differentially expressed by 'GENDER'
| T(pos if higher in 'MALE') | ttestP | Q | AUC | |
|---|---|---|---|---|
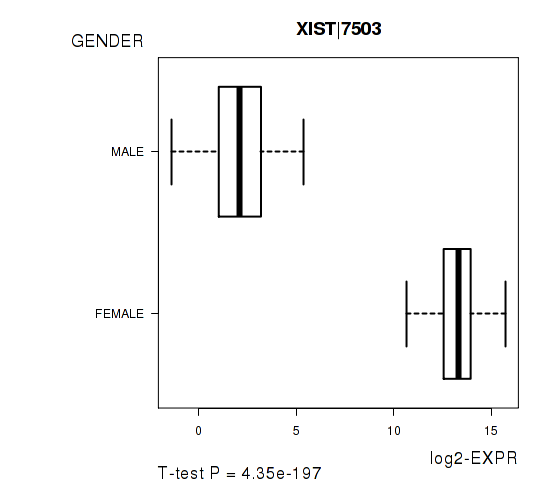
| XIST|7503 | -67.1 | 4.35e-197 | 7.98e-193 | 0.9998 |
| ZFY|7544 | 79.71 | 1.071e-143 | 1.96e-139 | 0.9999 |
| PRKY|5616 | 45.7 | 5.208e-134 | 9.55e-130 | 0.9996 |
| RPS4Y1|6192 | 67.79 | 2.96e-118 | 5.43e-114 | 0.9997 |
| NLGN4Y|22829 | 43.23 | 3.162e-115 | 5.8e-111 | 0.9976 |
| DDX3Y|8653 | 75.5 | 8.097e-103 | 1.48e-98 | 0.9998 |
| KDM5D|8284 | 69.07 | 4.7e-93 | 8.61e-89 | 0.9998 |
| TSIX|9383 | -30.81 | 3.631e-89 | 6.65e-85 | 0.997 |
| USP9Y|8287 | 72.32 | 6.872e-82 | 1.26e-77 | 0.9998 |
| NCRNA00183|554203 | -17.33 | 5.516e-49 | 1.01e-44 | 0.9112 |
Figure S3. Get High-res Image As an example, this figure shows the association of XIST|7503 to 'GENDER'. P value = 4.35e-197 with T-test analysis.
30 genes related to 'KARNOFSKY.PERFORMANCE.SCORE'.
Table S7. Basic characteristics of clinical feature: 'KARNOFSKY.PERFORMANCE.SCORE'
| KARNOFSKY.PERFORMANCE.SCORE | Mean (SD) | 87.97 (12) |
| Significant markers | N = 30 | |
| pos. correlated | 18 | |
| neg. correlated | 12 |
Table S8. Get Full Table List of top 10 genes significantly correlated to 'KARNOFSKY.PERFORMANCE.SCORE' by Spearman correlation test
| SpearmanCorr | corrP | Q | |
|---|---|---|---|
| RPL3|6122 | 0.3719 | 7.441e-08 | 0.00136 |
| RPL15|6138 | 0.3704 | 8.444e-08 | 0.00155 |
| C12ORF5|57103 | -0.3664 | 1.189e-07 | 0.00218 |
| VAV3|10451 | -0.3651 | 1.323e-07 | 0.00243 |
| EEF1A1|1915 | 0.3641 | 1.441e-07 | 0.00264 |
| RPL23|9349 | 0.3603 | 1.987e-07 | 0.00364 |
| HNRNPA1|3178 | 0.3545 | 3.193e-07 | 0.00585 |
| BCAT1|586 | -0.3544 | 3.244e-07 | 0.00595 |
| CD101|9398 | -0.3474 | 5.705e-07 | 0.0105 |
| UGP2|7360 | -0.3465 | 6.085e-07 | 0.0112 |
Figure S4. Get High-res Image As an example, this figure shows the association of RPL3|6122 to 'KARNOFSKY.PERFORMANCE.SCORE'. P value = 7.44e-08 with Spearman correlation analysis. The straight line presents the best linear regression.
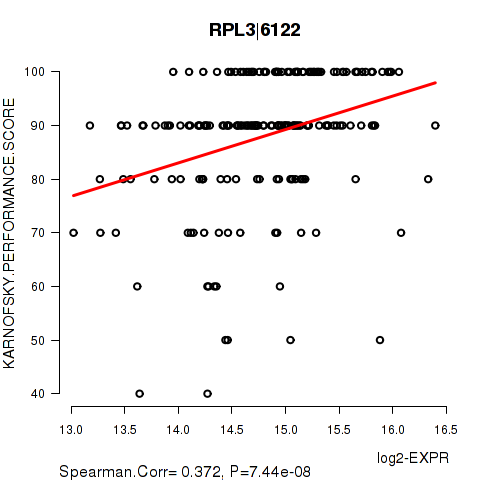
Table S9. Basic characteristics of clinical feature: 'HISTOLOGICAL.TYPE'
| HISTOLOGICAL.TYPE | Labels | N |
| ASTROCYTOMA | 122 | |
| OLIGOASTROCYTOMA | 100 | |
| OLIGODENDROGLIOMA | 137 | |
| Significant markers | N = 3904 |
Table S10. Get Full Table List of top 10 genes differentially expressed by 'HISTOLOGICAL.TYPE'
| ANOVA_P | Q | |
|---|---|---|
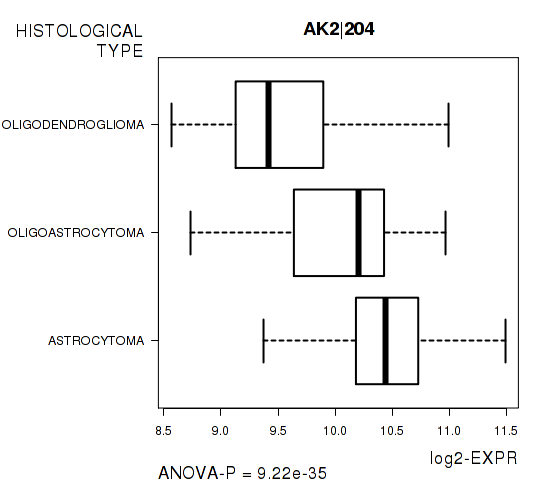
| AK2|204 | 9.22e-35 | 1.69e-30 |
| TXNDC12|51060 | 3.278e-34 | 6.01e-30 |
| NADK|65220 | 1.627e-33 | 2.98e-29 |
| HDAC1|3065 | 8.19e-32 | 1.5e-27 |
| ASAP3|55616 | 2.468e-31 | 4.53e-27 |
| CAPZB|832 | 4.913e-31 | 9.01e-27 |
| RPF1|80135 | 9.039e-31 | 1.66e-26 |
| STK40|83931 | 1.078e-30 | 1.98e-26 |
| SF3A3|10946 | 1.571e-30 | 2.88e-26 |
| WDR77|79084 | 3.306e-30 | 6.06e-26 |
Figure S5. Get High-res Image As an example, this figure shows the association of AK2|204 to 'HISTOLOGICAL.TYPE'. P value = 9.22e-35 with ANOVA analysis.
334 genes related to 'RADIATIONS.RADIATION.REGIMENINDICATION'.
Table S11. Basic characteristics of clinical feature: 'RADIATIONS.RADIATION.REGIMENINDICATION'
| RADIATIONS.RADIATION.REGIMENINDICATION | Labels | N |
| NO | 89 | |
| YES | 270 | |
| Significant markers | N = 334 | |
| Higher in YES | 299 | |
| Higher in NO | 35 |
Table S12. Get Full Table List of top 10 genes differentially expressed by 'RADIATIONS.RADIATION.REGIMENINDICATION'
| T(pos if higher in 'YES') | ttestP | Q | AUC | |
|---|---|---|---|---|
| EXD3|54932 | 7.97 | 9.323e-14 | 1.71e-09 | 0.7333 |
| NSUN5P2|260294 | 7.99 | 1.44e-13 | 2.64e-09 | 0.7436 |
| RHOT2|89941 | 7.98 | 2.221e-13 | 4.07e-09 | 0.7532 |
| MAN2C1|4123 | 7.88 | 3.414e-13 | 6.26e-09 | 0.746 |
| CENPT|80152 | 7.83 | 3.679e-13 | 6.75e-09 | 0.7402 |
| CSAD|51380 | 7.84 | 7.317e-13 | 1.34e-08 | 0.7559 |
| HOOK2|29911 | 7.68 | 7.944e-13 | 1.46e-08 | 0.739 |
| CCDC154|645811 | 7.66 | 2.296e-12 | 4.21e-08 | 0.7457 |
| MAMDC4|158056 | 7.66 | 3.173e-12 | 5.82e-08 | 0.7541 |
| NCRNA00105|80161 | 7.44 | 5.31e-12 | 9.73e-08 | 0.7377 |
Figure S6. Get High-res Image As an example, this figure shows the association of EXD3|54932 to 'RADIATIONS.RADIATION.REGIMENINDICATION'. P value = 9.32e-14 with T-test analysis.

-
Expresson data file = LGG-TP.uncv2.mRNAseq_RSEM_normalized_log2.txt
-
Clinical data file = LGG-TP.merged_data.txt
-
Number of patients = 359
-
Number of genes = 18339
-
Number of clinical features = 6
For survival clinical features, Wald's test in univariate Cox regression analysis with proportional hazards model (Andersen and Gill 1982) was used to estimate the P values using the 'coxph' function in R. Kaplan-Meier survival curves were plot using the four quartile subgroups of patients based on expression levels
For continuous numerical clinical features, Spearman's rank correlation coefficients (Spearman 1904) and two-tailed P values were estimated using 'cor.test' function in R
For two-class clinical features, two-tailed Student's t test with unequal variance (Lehmann and Romano 2005) was applied to compare the log2-expression levels between the two clinical classes using 't.test' function in R
For multi-class clinical features (ordinal or nominal), one-way analysis of variance (Howell 2002) was applied to compare the log2-expression levels between different clinical classes using 'anova' function in R
For multiple hypothesis correction, Q value is the False Discovery Rate (FDR) analogue of the P value (Benjamini and Hochberg 1995), defined as the minimum FDR at which the test may be called significant. We used the 'Benjamini and Hochberg' method of 'p.adjust' function in R to convert P values into Q values.
In addition to the links below, the full results of the analysis summarized in this report can also be downloaded programmatically using firehose_get, or interactively from either the Broad GDAC website or TCGA Data Coordination Center Portal.