This pipeline uses various statistical tests to identify miRs whose expression levels correlated to selected clinical features.
Testing the association between 543 miRs and 6 clinical features across 348 samples, statistically thresholded by Q value < 0.05, 4 clinical features related to at least one miRs.
-
31 miRs correlated to 'Time to Death'.
-
HSA-MIR-155 , HSA-MIR-10A , HSA-MIR-15B , HSA-MIR-346 , HSA-MIR-196B , ...
-
23 miRs correlated to 'AGE'.
-
HSA-MIR-34A , HSA-MIR-155 , HSA-MIR-25 , HSA-MIR-10A , HSA-MIR-146A , ...
-
56 miRs correlated to 'HISTOLOGICAL.TYPE'.
-
HSA-MIR-1262 , HSA-MIR-186 , HSA-MIR-3074 , HSA-MIR-3065 , HSA-MIR-219-1 , ...
-
25 miRs correlated to 'RADIATIONS.RADIATION.REGIMENINDICATION'.
-
HSA-MIR-628 , HSA-MIR-1274B , HSA-MIR-3130-1 , HSA-MIR-30E , HSA-MIR-296 , ...
-
No miRs correlated to 'GENDER', and 'KARNOFSKY.PERFORMANCE.SCORE'.
Complete statistical result table is provided in Supplement Table 1
Table 1. Get Full Table This table shows the clinical features, statistical methods used, and the number of miRs that are significantly associated with each clinical feature at Q value < 0.05.
| Clinical feature | Statistical test | Significant miRs | Associated with | Associated with | ||
|---|---|---|---|---|---|---|
| Time to Death | Cox regression test | N=31 | shorter survival | N=28 | longer survival | N=3 |
| AGE | Spearman correlation test | N=23 | older | N=19 | younger | N=4 |
| GENDER | t test | N=0 | ||||
| KARNOFSKY PERFORMANCE SCORE | Spearman correlation test | N=0 | ||||
| HISTOLOGICAL TYPE | ANOVA test | N=56 | ||||
| RADIATIONS RADIATION REGIMENINDICATION | t test | N=25 | yes | N=3 | no | N=22 |
Table S1. Basic characteristics of clinical feature: 'Time to Death'
| Time to Death | Duration (Months) | 0-211.2 (median=14.9) |
| censored | N = 280 | |
| death | N = 67 | |
| Significant markers | N = 31 | |
| associated with shorter survival | 28 | |
| associated with longer survival | 3 |
Table S2. Get Full Table List of top 10 miRs significantly associated with 'Time to Death' by Cox regression test
| HazardRatio | Wald_P | Q | C_index | |
|---|---|---|---|---|
| HSA-MIR-155 | 1.91 | 1.644e-12 | 8.9e-10 | 0.781 |
| HSA-MIR-10A | 1.33 | 6.747e-11 | 3.7e-08 | 0.72 |
| HSA-MIR-15B | 1.87 | 3.41e-09 | 1.8e-06 | 0.786 |
| HSA-MIR-346 | 0.61 | 5.45e-09 | 2.9e-06 | 0.338 |
| HSA-MIR-196B | 1.22 | 1.04e-08 | 5.6e-06 | 0.713 |
| HSA-MIR-148A | 1.57 | 5.738e-08 | 3.1e-05 | 0.747 |
| HSA-MIR-9-1 | 0.42 | 1.759e-07 | 9.4e-05 | 0.244 |
| HSA-MIR-9-2 | 0.42 | 1.788e-07 | 9.6e-05 | 0.244 |
| HSA-MIR-21 | 1.45 | 4.3e-07 | 0.00023 | 0.715 |
| HSA-MIR-944 | 1.55 | 2.126e-06 | 0.0011 | 0.79 |
Figure S1. Get High-res Image As an example, this figure shows the association of HSA-MIR-155 to 'Time to Death'. four curves present the cumulative survival rates of 4 quartile subsets of patients. P value = 1.64e-12 with univariate Cox regression analysis using continuous log-2 expression values.
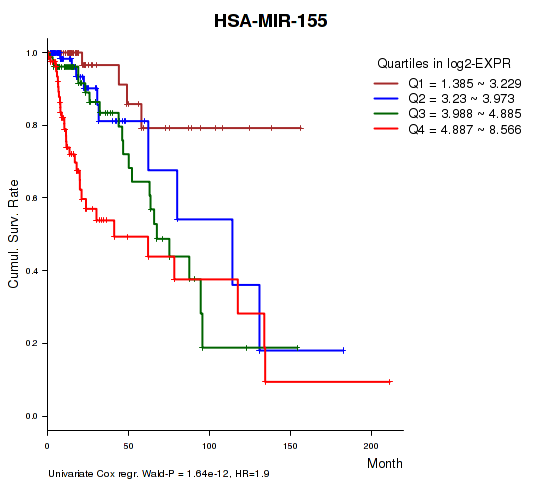
Table S3. Basic characteristics of clinical feature: 'AGE'
| AGE | Mean (SD) | 43.47 (14) |
| Significant markers | N = 23 | |
| pos. correlated | 19 | |
| neg. correlated | 4 |
Table S4. Get Full Table List of top 10 miRs significantly correlated to 'AGE' by Spearman correlation test
| SpearmanCorr | corrP | Q | |
|---|---|---|---|
| HSA-MIR-34A | 0.3429 | 4.9e-11 | 2.66e-08 |
| HSA-MIR-155 | 0.2893 | 3.895e-08 | 2.11e-05 |
| HSA-MIR-25 | 0.2804 | 1.038e-07 | 5.62e-05 |
| HSA-MIR-10A | 0.2609 | 8.032e-07 | 0.000434 |
| HSA-MIR-146A | 0.253 | 1.739e-06 | 0.000937 |
| HSA-MIR-2115 | 0.2632 | 1.946e-06 | 0.00105 |
| HSA-MIR-10B | 0.2515 | 2.016e-06 | 0.00108 |
| HSA-MIR-126 | 0.2492 | 2.529e-06 | 0.00136 |
| HSA-MIR-664 | 0.2455 | 4.778e-06 | 0.00256 |
| HSA-MIR-429 | 0.2836 | 6.491e-06 | 0.00347 |
Figure S2. Get High-res Image As an example, this figure shows the association of HSA-MIR-34A to 'AGE'. P value = 4.9e-11 with Spearman correlation analysis. The straight line presents the best linear regression.
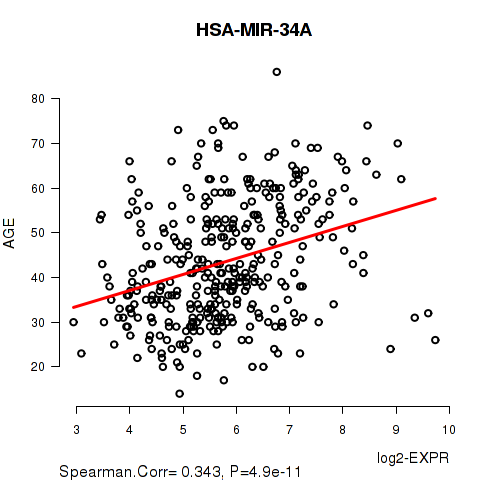
Table S5. Basic characteristics of clinical feature: 'GENDER'
| GENDER | Labels | N |
| FEMALE | 160 | |
| MALE | 188 | |
| Significant markers | N = 0 |
No miR related to 'KARNOFSKY.PERFORMANCE.SCORE'.
Table S6. Basic characteristics of clinical feature: 'KARNOFSKY.PERFORMANCE.SCORE'
| KARNOFSKY.PERFORMANCE.SCORE | Mean (SD) | 87.97 (12) |
| Significant markers | N = 0 |
Table S7. Basic characteristics of clinical feature: 'HISTOLOGICAL.TYPE'
| HISTOLOGICAL.TYPE | Labels | N |
| ASTROCYTOMA | 118 | |
| OLIGOASTROCYTOMA | 95 | |
| OLIGODENDROGLIOMA | 135 | |
| Significant markers | N = 56 |
Table S8. Get Full Table List of top 10 miRs differentially expressed by 'HISTOLOGICAL.TYPE'
| ANOVA_P | Q | |
|---|---|---|
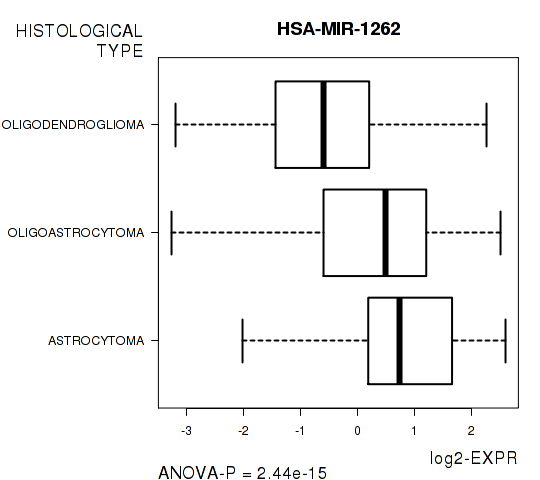
| HSA-MIR-1262 | 2.444e-15 | 1.33e-12 |
| HSA-MIR-186 | 3.074e-13 | 1.67e-10 |
| HSA-MIR-3074 | 1.106e-11 | 5.98e-09 |
| HSA-MIR-3065 | 1.625e-11 | 8.78e-09 |
| HSA-MIR-219-1 | 2.366e-11 | 1.28e-08 |
| HSA-MIR-592 | 3.29e-11 | 1.77e-08 |
| HSA-MIR-576 | 3.059e-10 | 1.64e-07 |
| HSA-MIR-301A | 8.364e-10 | 4.48e-07 |
| HSA-MIR-21 | 2.864e-09 | 1.53e-06 |
| HSA-MIR-23A | 4.749e-09 | 2.54e-06 |
Figure S3. Get High-res Image As an example, this figure shows the association of HSA-MIR-1262 to 'HISTOLOGICAL.TYPE'. P value = 2.44e-15 with ANOVA analysis.
25 miRs related to 'RADIATIONS.RADIATION.REGIMENINDICATION'.
Table S9. Basic characteristics of clinical feature: 'RADIATIONS.RADIATION.REGIMENINDICATION'
| RADIATIONS.RADIATION.REGIMENINDICATION | Labels | N |
| NO | 88 | |
| YES | 260 | |
| Significant markers | N = 25 | |
| Higher in YES | 3 | |
| Higher in NO | 22 |
Table S10. Get Full Table List of top 10 miRs differentially expressed by 'RADIATIONS.RADIATION.REGIMENINDICATION'
| T(pos if higher in 'YES') | ttestP | Q | AUC | |
|---|---|---|---|---|
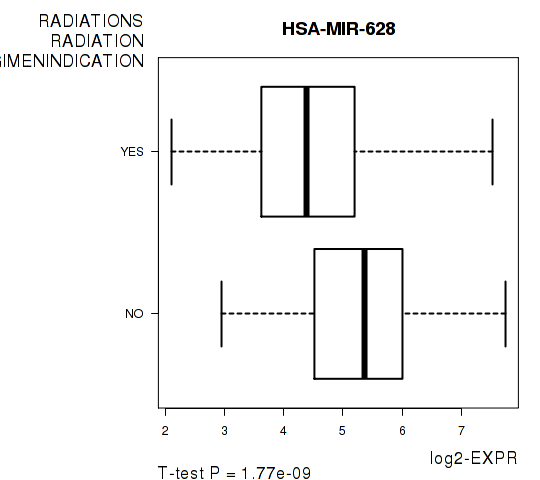
| HSA-MIR-628 | -6.37 | 1.771e-09 | 9.62e-07 | 0.7174 |
| HSA-MIR-1274B | -5.96 | 1.193e-08 | 6.47e-06 | 0.6909 |
| HSA-MIR-3130-1 | -5.7 | 6.832e-08 | 3.7e-05 | 0.7044 |
| HSA-MIR-30E | -5.39 | 2.118e-07 | 0.000114 | 0.687 |
| HSA-MIR-296 | -5.23 | 4.783e-07 | 0.000258 | 0.663 |
| HSA-MIR-30C-1 | -5.14 | 6.251e-07 | 0.000336 | 0.6544 |
| HSA-MIR-424 | -5.14 | 9.368e-07 | 0.000503 | 0.6903 |
| HSA-MIR-331 | -5 | 1.255e-06 | 0.000673 | 0.6535 |
| HSA-MIR-32 | -4.94 | 2.151e-06 | 0.00115 | 0.6648 |
| HSA-MIR-3613 | -4.87 | 2.674e-06 | 0.00143 | 0.6552 |
Figure S4. Get High-res Image As an example, this figure shows the association of HSA-MIR-628 to 'RADIATIONS.RADIATION.REGIMENINDICATION'. P value = 1.77e-09 with T-test analysis.
-
Expresson data file = LGG-TP.miRseq_RPKM_log2.txt
-
Clinical data file = LGG-TP.merged_data.txt
-
Number of patients = 348
-
Number of miRs = 543
-
Number of clinical features = 6
For survival clinical features, Wald's test in univariate Cox regression analysis with proportional hazards model (Andersen and Gill 1982) was used to estimate the P values using the 'coxph' function in R. Kaplan-Meier survival curves were plot using the four quartile subgroups of patients based on expression levels
For continuous numerical clinical features, Spearman's rank correlation coefficients (Spearman 1904) and two-tailed P values were estimated using 'cor.test' function in R
For two-class clinical features, two-tailed Student's t test with unequal variance (Lehmann and Romano 2005) was applied to compare the log2-expression levels between the two clinical classes using 't.test' function in R
For multi-class clinical features (ordinal or nominal), one-way analysis of variance (Howell 2002) was applied to compare the log2-expression levels between different clinical classes using 'anova' function in R
For multiple hypothesis correction, Q value is the False Discovery Rate (FDR) analogue of the P value (Benjamini and Hochberg 1995), defined as the minimum FDR at which the test may be called significant. We used the 'Benjamini and Hochberg' method of 'p.adjust' function in R to convert P values into Q values.
In addition to the links below, the full results of the analysis summarized in this report can also be downloaded programmatically using firehose_get, or interactively from either the Broad GDAC website or TCGA Data Coordination Center Portal.