This pipeline computes the correlation between significant copy number variation (cnv focal) genes and selected clinical features.
Testing the association between copy number variation 56 focal events and 8 clinical features across 149 patients, one significant finding detected with Q value < 0.25.
-
del_13q14.2 cnv correlated to 'PATHOLOGY.T.STAGE'.
Table 1. Get Full Table Overview of the association between significant copy number variation of 56 focal events and 8 clinical features. Shown in the table are P values (Q values). Thresholded by Q value < 0.25, one significant finding detected.
|
Clinical Features |
Time to Death |
AGE |
NEOPLASM DISEASESTAGE |
PATHOLOGY T STAGE |
PATHOLOGY N STAGE |
PATHOLOGY M STAGE |
GENDER |
COMPLETENESS OF RESECTION |
||
| nCNV (%) | nWild-Type | logrank test | t-test | Chi-square test | Fisher's exact test | Fisher's exact test | Fisher's exact test | Fisher's exact test | Fisher's exact test | |
| del 13q14 2 | 68 (46%) | 81 |
0.185 (1.00) |
0.781 (1.00) |
0.0591 (1.00) |
0.000294 (0.132) |
1 (1.00) |
0.563 (1.00) |
0.243 (1.00) |
0.329 (1.00) |
| amp 1p22 3 | 34 (23%) | 115 |
0.584 (1.00) |
0.235 (1.00) |
0.338 (1.00) |
0.675 (1.00) |
0.492 (1.00) |
0.128 (1.00) |
1 (1.00) |
0.0582 (1.00) |
| amp 1q22 | 110 (74%) | 39 |
0.0345 (1.00) |
0.394 (1.00) |
0.367 (1.00) |
0.173 (1.00) |
1 (1.00) |
0.64 (1.00) |
0.567 (1.00) |
0.6 (1.00) |
| amp 1q42 3 | 104 (70%) | 45 |
0.135 (1.00) |
0.805 (1.00) |
0.0811 (1.00) |
0.0199 (1.00) |
0.552 (1.00) |
0.666 (1.00) |
0.368 (1.00) |
0.75 (1.00) |
| amp 2p24 1 | 35 (23%) | 114 |
0.545 (1.00) |
0.22 (1.00) |
0.749 (1.00) |
0.388 (1.00) |
0.121 (1.00) |
0.488 (1.00) |
0.0468 (1.00) |
0.628 (1.00) |
| amp 2q31 2 | 31 (21%) | 118 |
0.131 (1.00) |
0.659 (1.00) |
0.576 (1.00) |
0.557 (1.00) |
0.452 (1.00) |
0.659 (1.00) |
0.0218 (1.00) |
0.546 (1.00) |
| amp 3q26 31 | 31 (21%) | 118 |
0.483 (1.00) |
0.335 (1.00) |
0.389 (1.00) |
0.291 (1.00) |
0.389 (1.00) |
0.659 (1.00) |
0.836 (1.00) |
1 (1.00) |
| amp 4q13 3 | 15 (10%) | 134 |
0.904 (1.00) |
0.536 (1.00) |
0.602 (1.00) |
0.821 (1.00) |
1 (1.00) |
0.502 (1.00) |
0.269 (1.00) |
0.00994 (1.00) |
| amp 5p15 33 | 71 (48%) | 78 |
0.901 (1.00) |
0.917 (1.00) |
0.0259 (1.00) |
0.00574 (1.00) |
1 (1.00) |
0.322 (1.00) |
0.868 (1.00) |
1 (1.00) |
| amp 5q35 3 | 54 (36%) | 95 |
0.72 (1.00) |
0.14 (1.00) |
0.464 (1.00) |
0.597 (1.00) |
0.549 (1.00) |
1 (1.00) |
0.6 (1.00) |
0.0705 (1.00) |
| amp 6p25 2 | 62 (42%) | 87 |
0.0946 (1.00) |
0.701 (1.00) |
0.354 (1.00) |
0.242 (1.00) |
1 (1.00) |
0.75 (1.00) |
0.61 (1.00) |
0.673 (1.00) |
| amp 6p21 1 | 62 (42%) | 87 |
0.581 (1.00) |
0.315 (1.00) |
0.326 (1.00) |
0.993 (1.00) |
0.286 (1.00) |
0.653 (1.00) |
0.395 (1.00) |
0.673 (1.00) |
| amp 6q12 | 44 (30%) | 105 |
0.832 (1.00) |
0.814 (1.00) |
0.121 (1.00) |
0.96 (1.00) |
0.201 (1.00) |
0.119 (1.00) |
0.358 (1.00) |
0.453 (1.00) |
| amp 6q12 | 31 (21%) | 118 |
0.771 (1.00) |
0.34 (1.00) |
0.559 (1.00) |
0.978 (1.00) |
1 (1.00) |
0.185 (1.00) |
0.535 (1.00) |
0.301 (1.00) |
| amp 7q21 2 | 56 (38%) | 93 |
0.986 (1.00) |
0.104 (1.00) |
0.13 (1.00) |
0.227 (1.00) |
0.28 (1.00) |
0.525 (1.00) |
0.604 (1.00) |
0.566 (1.00) |
| amp 7q31 2 | 53 (36%) | 96 |
0.581 (1.00) |
0.238 (1.00) |
0.14 (1.00) |
0.3 (1.00) |
0.226 (1.00) |
0.683 (1.00) |
0.726 (1.00) |
0.656 (1.00) |
| amp 8q11 1 | 58 (39%) | 91 |
0.388 (1.00) |
0.663 (1.00) |
0.239 (1.00) |
0.169 (1.00) |
0.55 (1.00) |
0.526 (1.00) |
0.00347 (1.00) |
0.924 (1.00) |
| amp 8q24 21 | 88 (59%) | 61 |
0.533 (1.00) |
0.651 (1.00) |
0.352 (1.00) |
0.961 (1.00) |
0.571 (1.00) |
0.746 (1.00) |
0.0168 (1.00) |
0.929 (1.00) |
| amp 9q34 2 | 20 (13%) | 129 |
0.47 (1.00) |
0.19 (1.00) |
0.112 (1.00) |
0.347 (1.00) |
0.344 (1.00) |
0.85 (1.00) |
1 (1.00) |
0.16 (1.00) |
| amp 10p15 1 | 30 (20%) | 119 |
0.462 (1.00) |
0.401 (1.00) |
0.017 (1.00) |
0.0108 (1.00) |
1 (1.00) |
0.0748 (1.00) |
0.676 (1.00) |
1 (1.00) |
| amp 11q13 3 | 28 (19%) | 121 |
0.367 (1.00) |
0.382 (1.00) |
0.081 (1.00) |
0.0311 (1.00) |
1 (1.00) |
0.202 (1.00) |
1 (1.00) |
0.114 (1.00) |
| amp 13q32 3 | 23 (15%) | 126 |
0.0232 (1.00) |
0.599 (1.00) |
0.983 (1.00) |
0.951 (1.00) |
0.344 (1.00) |
0.87 (1.00) |
0.36 (1.00) |
0.157 (1.00) |
| amp 15q26 3 | 26 (17%) | 123 |
0.954 (1.00) |
0.316 (1.00) |
0.863 (1.00) |
0.338 (1.00) |
1 (1.00) |
1 (1.00) |
0.825 (1.00) |
1 (1.00) |
| amp 16q12 1 | 13 (9%) | 136 |
0.659 (1.00) |
0.375 (1.00) |
0.445 (1.00) |
0.0918 (1.00) |
0.273 (1.00) |
0.8 (1.00) |
0.372 (1.00) |
0.416 (1.00) |
| amp 17p11 2 | 26 (17%) | 123 |
0.723 (1.00) |
0.651 (1.00) |
0.237 (1.00) |
0.131 (1.00) |
1 (1.00) |
0.205 (1.00) |
0.385 (1.00) |
0.0228 (1.00) |
| amp 17q25 3 | 70 (47%) | 79 |
0.291 (1.00) |
0.891 (1.00) |
0.662 (1.00) |
0.588 (1.00) |
1 (1.00) |
0.819 (1.00) |
0.0931 (1.00) |
0.0705 (1.00) |
| amp 19q13 11 | 41 (28%) | 108 |
0.999 (1.00) |
0.369 (1.00) |
0.237 (1.00) |
0.562 (1.00) |
1 (1.00) |
0.296 (1.00) |
0.458 (1.00) |
0.238 (1.00) |
| amp 20q13 33 | 50 (34%) | 99 |
0.954 (1.00) |
0.166 (1.00) |
0.315 (1.00) |
0.788 (1.00) |
0.28 (1.00) |
0.39 (1.00) |
0.218 (1.00) |
0.554 (1.00) |
| amp xq28 | 38 (26%) | 111 |
0.669 (1.00) |
0.0403 (1.00) |
0.825 (1.00) |
0.757 (1.00) |
1 (1.00) |
0.704 (1.00) |
0.0117 (1.00) |
0.943 (1.00) |
| del 1p36 23 | 71 (48%) | 78 |
0.273 (1.00) |
0.523 (1.00) |
0.853 (1.00) |
0.438 (1.00) |
0.587 (1.00) |
0.61 (1.00) |
0.502 (1.00) |
0.602 (1.00) |
| del 2q22 1 | 15 (10%) | 134 |
0.00709 (1.00) |
0.788 (1.00) |
0.695 (1.00) |
0.258 (1.00) |
1 (1.00) |
1 (1.00) |
1 (1.00) |
0.748 (1.00) |
| del 2q37 3 | 28 (19%) | 121 |
0.868 (1.00) |
0.556 (1.00) |
0.335 (1.00) |
0.0298 (1.00) |
0.411 (1.00) |
0.27 (1.00) |
0.395 (1.00) |
0.854 (1.00) |
| del 3p13 | 26 (17%) | 123 |
0.186 (1.00) |
0.979 (1.00) |
0.389 (1.00) |
0.063 (1.00) |
0.432 (1.00) |
0.602 (1.00) |
0.0451 (1.00) |
1 (1.00) |
| del 4p16 3 | 26 (17%) | 123 |
0.457 (1.00) |
0.462 (1.00) |
0.134 (1.00) |
0.985 (1.00) |
0.0506 (1.00) |
0.525 (1.00) |
0.191 (1.00) |
0.301 (1.00) |
| del 4q24 | 64 (43%) | 85 |
0.176 (1.00) |
0.114 (1.00) |
0.0552 (1.00) |
0.324 (1.00) |
1 (1.00) |
0.267 (1.00) |
0.611 (1.00) |
0.374 (1.00) |
| del 4q34 3 | 59 (40%) | 90 |
0.023 (1.00) |
0.177 (1.00) |
0.507 (1.00) |
0.63 (1.00) |
0.553 (1.00) |
0.421 (1.00) |
0.391 (1.00) |
0.753 (1.00) |
| del 6q16 3 | 56 (38%) | 93 |
0.823 (1.00) |
0.279 (1.00) |
0.45 (1.00) |
0.655 (1.00) |
0.559 (1.00) |
0.0897 (1.00) |
0.3 (1.00) |
0.589 (1.00) |
| del 6q27 | 58 (39%) | 91 |
0.775 (1.00) |
0.216 (1.00) |
0.502 (1.00) |
0.753 (1.00) |
0.559 (1.00) |
0.0169 (1.00) |
1 (1.00) |
0.632 (1.00) |
| del 8p23 2 | 97 (65%) | 52 |
0.167 (1.00) |
0.0213 (1.00) |
0.35 (1.00) |
1 (1.00) |
0.279 (1.00) |
0.37 (1.00) |
0.219 (1.00) |
0.959 (1.00) |
| del 9p21 3 | 57 (38%) | 92 |
0.0678 (1.00) |
0.838 (1.00) |
0.123 (1.00) |
0.11 (1.00) |
0.294 (1.00) |
0.352 (1.00) |
0.303 (1.00) |
0.141 (1.00) |
| del 9q34 2 | 51 (34%) | 98 |
0.351 (1.00) |
0.844 (1.00) |
0.149 (1.00) |
0.34 (1.00) |
0.239 (1.00) |
0.0815 (1.00) |
0.725 (1.00) |
0.554 (1.00) |
| del 10q23 31 | 40 (27%) | 109 |
0.993 (1.00) |
0.889 (1.00) |
0.0603 (1.00) |
0.0921 (1.00) |
0.142 (1.00) |
0.644 (1.00) |
0.576 (1.00) |
0.235 (1.00) |
| del 10q24 33 | 39 (26%) | 110 |
0.267 (1.00) |
0.612 (1.00) |
0.217 (1.00) |
0.236 (1.00) |
0.131 (1.00) |
0.921 (1.00) |
0.705 (1.00) |
0.2 (1.00) |
| del 11q14 1 | 26 (17%) | 123 |
0.791 (1.00) |
0.268 (1.00) |
0.419 (1.00) |
0.446 (1.00) |
0.058 (1.00) |
0.885 (1.00) |
0.665 (1.00) |
0.34 (1.00) |
| del 11q23 3 | 30 (20%) | 119 |
0.714 (1.00) |
0.295 (1.00) |
0.555 (1.00) |
0.462 (1.00) |
0.0826 (1.00) |
0.9 (1.00) |
0.836 (1.00) |
0.411 (1.00) |
| del 12p12 1 | 33 (22%) | 116 |
0.0729 (1.00) |
0.463 (1.00) |
0.398 (1.00) |
0.842 (1.00) |
0.111 (1.00) |
0.828 (1.00) |
0.841 (1.00) |
0.297 (1.00) |
| del 12q24 33 | 24 (16%) | 125 |
0.272 (1.00) |
0.37 (1.00) |
0.0519 (1.00) |
0.152 (1.00) |
1 (1.00) |
0.308 (1.00) |
0.821 (1.00) |
0.912 (1.00) |
| del 13q12 11 | 47 (32%) | 102 |
0.814 (1.00) |
0.855 (1.00) |
0.0358 (1.00) |
0.00821 (1.00) |
1 (1.00) |
0.0422 (1.00) |
0.589 (1.00) |
0.585 (1.00) |
| del 13q22 2 | 54 (36%) | 95 |
0.935 (1.00) |
0.258 (1.00) |
0.283 (1.00) |
0.00168 (0.753) |
0.55 (1.00) |
0.345 (1.00) |
0.221 (1.00) |
0.816 (1.00) |
| del 14q23 3 | 51 (34%) | 98 |
0.936 (1.00) |
0.987 (1.00) |
0.512 (1.00) |
0.279 (1.00) |
1 (1.00) |
0.591 (1.00) |
0.86 (1.00) |
0.269 (1.00) |
| del 14q32 33 | 52 (35%) | 97 |
0.457 (1.00) |
0.68 (1.00) |
0.498 (1.00) |
0.25 (1.00) |
1 (1.00) |
0.474 (1.00) |
1 (1.00) |
0.749 (1.00) |
| del 16q23 1 | 62 (42%) | 87 |
0.102 (1.00) |
0.138 (1.00) |
0.34 (1.00) |
0.188 (1.00) |
0.576 (1.00) |
0.93 (1.00) |
0.61 (1.00) |
0.554 (1.00) |
| del 17p11 2 | 79 (53%) | 70 |
0.0917 (1.00) |
0.559 (1.00) |
0.34 (1.00) |
0.2 (1.00) |
0.245 (1.00) |
1 (1.00) |
0.402 (1.00) |
0.381 (1.00) |
| del 19p13 3 | 32 (21%) | 117 |
0.658 (1.00) |
0.795 (1.00) |
0.189 (1.00) |
0.095 (1.00) |
0.511 (1.00) |
0.314 (1.00) |
0.414 (1.00) |
0.928 (1.00) |
| del 20p12 1 | 11 (7%) | 138 |
0.317 (1.00) |
0.838 (1.00) |
0.171 (1.00) |
0.737 (1.00) |
1 (1.00) |
0.191 (1.00) |
0.751 (1.00) |
0.838 (1.00) |
| del 22q13 32 | 41 (28%) | 108 |
0.216 (1.00) |
0.412 (1.00) |
0.642 (1.00) |
0.0816 (1.00) |
1 (1.00) |
0.36 (1.00) |
0.458 (1.00) |
0.518 (1.00) |
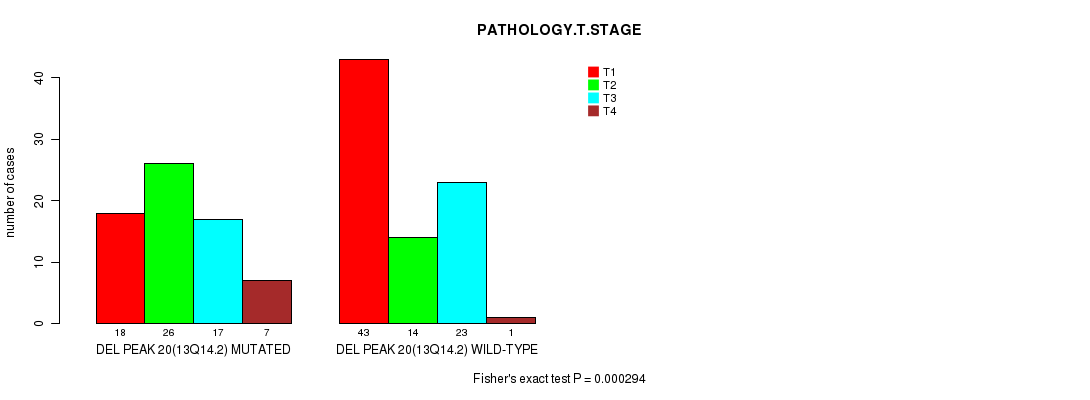
P value = 0.000294 (Fisher's exact test), Q value = 0.13
Table S1. Gene #48: 'del_13q14.2' versus Clinical Feature #4: 'PATHOLOGY.T.STAGE'
| nPatients | T1 | T2 | T3 | T4 |
|---|---|---|---|---|
| ALL | 61 | 40 | 40 | 8 |
| DEL PEAK 20(13Q14.2) MUTATED | 18 | 26 | 17 | 7 |
| DEL PEAK 20(13Q14.2) WILD-TYPE | 43 | 14 | 23 | 1 |
Figure S1. Get High-res Image Gene #48: 'del_13q14.2' versus Clinical Feature #4: 'PATHOLOGY.T.STAGE'
-
Copy number data file = transformed.cor.cli.txt
-
Clinical data file = LIHC-TP.merged_data.txt
-
Number of patients = 149
-
Number of significantly focal cnvs = 56
-
Number of selected clinical features = 8
-
Exclude genes that fewer than K tumors have mutations, K = 3
For survival clinical features, the Kaplan-Meier survival curves of tumors with and without gene mutations were plotted and the statistical significance P values were estimated by logrank test (Bland and Altman 2004) using the 'survdiff' function in R
For continuous numerical clinical features, two-tailed Student's t test with unequal variance (Lehmann and Romano 2005) was applied to compare the clinical values between tumors with and without gene mutations using 't.test' function in R
For multi-class clinical features (nominal or ordinal), Chi-square tests (Greenwood and Nikulin 1996) were used to estimate the P values using the 'chisq.test' function in R
For binary or multi-class clinical features (nominal or ordinal), two-tailed Fisher's exact tests (Fisher 1922) were used to estimate the P values using the 'fisher.test' function in R
For multiple hypothesis correction, Q value is the False Discovery Rate (FDR) analogue of the P value (Benjamini and Hochberg 1995), defined as the minimum FDR at which the test may be called significant. We used the 'Benjamini and Hochberg' method of 'p.adjust' function in R to convert P values into Q values.
In addition to the links below, the full results of the analysis summarized in this report can also be downloaded programmatically using firehose_get, or interactively from either the Broad GDAC website or TCGA Data Coordination Center Portal.