This pipeline uses various statistical tests to identify genes whose promoter methylation levels correlated to selected clinical features.
Testing the association between 19515 genes and 8 clinical features across 154 samples, statistically thresholded by Q value < 0.05, 6 clinical features related to at least one genes.
-
15 genes correlated to 'AGE'.
-
KCNS2 , WTIP , RAB3D , ZIC1 , CDCA7 , ...
-
61 genes correlated to 'NEOPLASM.DISEASESTAGE'.
-
SEPSECS , SMU1 , BIVM , KDELC1 , MSRB2 , ...
-
261 genes correlated to 'PATHOLOGY.N.STAGE'.
-
MSC , PTP4A3 , FAM157A , GRAMD1A , THBD , ...
-
24 genes correlated to 'PATHOLOGY.M.STAGE'.
-
SEPSECS , ANKAR , MMP2 , SLC12A9 , AHR , ...
-
24 genes correlated to 'GENDER'.
-
ALG11__1 , UTP14C , ALDH3A1 , C14ORF182 , CCDC23__1 , ...
-
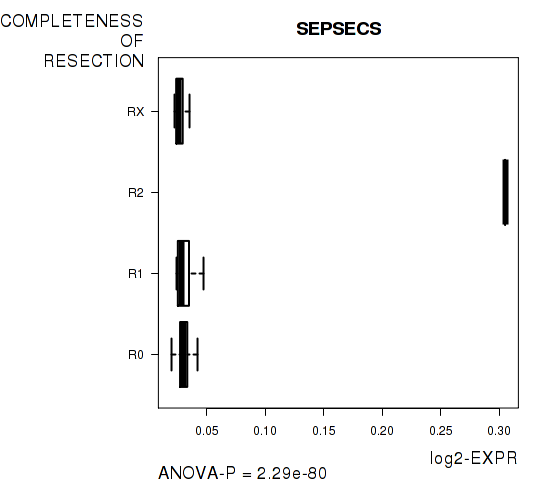
8 genes correlated to 'COMPLETENESS.OF.RESECTION'.
-
SEPSECS , BIVM , KDELC1 , CCDC94 , C5ORF42 , ...
-
No genes correlated to 'Time to Death', and 'PATHOLOGY.T.STAGE'.
Complete statistical result table is provided in Supplement Table 1
Table 1. Get Full Table This table shows the clinical features, statistical methods used, and the number of genes that are significantly associated with each clinical feature at Q value < 0.05.
| Clinical feature | Statistical test | Significant genes | Associated with | Associated with | ||
|---|---|---|---|---|---|---|
| Time to Death | Cox regression test | N=0 | ||||
| AGE | Spearman correlation test | N=15 | older | N=14 | younger | N=1 |
| NEOPLASM DISEASESTAGE | ANOVA test | N=61 | ||||
| PATHOLOGY T STAGE | Spearman correlation test | N=0 | ||||
| PATHOLOGY N STAGE | t test | N=261 | class1 | N=59 | class0 | N=202 |
| PATHOLOGY M STAGE | ANOVA test | N=24 | ||||
| GENDER | t test | N=24 | male | N=6 | female | N=18 |
| COMPLETENESS OF RESECTION | ANOVA test | N=8 |
Table S1. Basic characteristics of clinical feature: 'Time to Death'
| Time to Death | Duration (Months) | 0-113 (median=13.9) |
| censored | N = 88 | |
| death | N = 63 | |
| Significant markers | N = 0 |
Table S2. Basic characteristics of clinical feature: 'AGE'
| AGE | Mean (SD) | 61.2 (14) |
| Significant markers | N = 15 | |
| pos. correlated | 14 | |
| neg. correlated | 1 |
Table S3. Get Full Table List of top 10 genes significantly correlated to 'AGE' by Spearman correlation test
| SpearmanCorr | corrP | Q | |
|---|---|---|---|
| KCNS2 | 0.4529 | 4.654e-09 | 9.08e-05 |
| WTIP | 0.4214 | 6.416e-08 | 0.00125 |
| RAB3D | 0.4163 | 9.604e-08 | 0.00187 |
| ZIC1 | 0.4026 | 2.728e-07 | 0.00532 |
| CDCA7 | 0.4018 | 2.89e-07 | 0.00564 |
| SHOX2 | 0.3982 | 3.76e-07 | 0.00734 |
| MAP1B | 0.3937 | 5.236e-07 | 0.0102 |
| DCHS1 | 0.3973 | 5.245e-07 | 0.0102 |
| BAALC__1 | 0.3868 | 8.535e-07 | 0.0166 |
| C8ORF56__1 | 0.3868 | 8.535e-07 | 0.0166 |
Figure S1. Get High-res Image As an example, this figure shows the association of KCNS2 to 'AGE'. P value = 4.65e-09 with Spearman correlation analysis. The straight line presents the best linear regression.
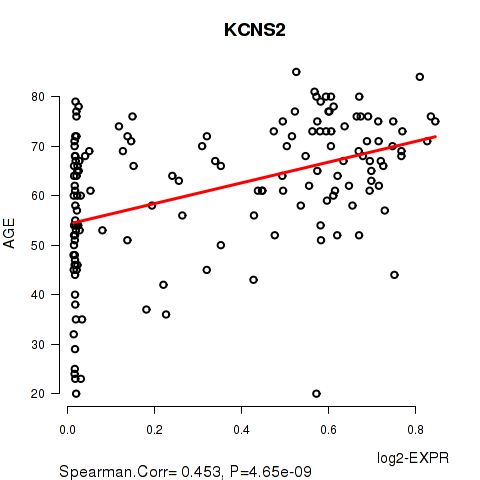
Table S4. Basic characteristics of clinical feature: 'NEOPLASM.DISEASESTAGE'
| NEOPLASM.DISEASESTAGE | Labels | N |
| STAGE I | 58 | |
| STAGE II | 36 | |
| STAGE III | 2 | |
| STAGE IIIA | 34 | |
| STAGE IIIB | 4 | |
| STAGE IIIC | 6 | |
| STAGE IV | 1 | |
| STAGE IVA | 1 | |
| STAGE IVB | 2 | |
| Significant markers | N = 61 |
Table S5. Get Full Table List of top 10 genes differentially expressed by 'NEOPLASM.DISEASESTAGE'
| ANOVA_P | Q | |
|---|---|---|
| SEPSECS | 1.621e-72 | 3.16e-68 |
| SMU1 | 3.666e-47 | 7.15e-43 |
| BIVM | 6.512e-26 | 1.27e-21 |
| KDELC1 | 6.512e-26 | 1.27e-21 |
| MSRB2 | 3.412e-20 | 6.66e-16 |
| CCDC94 | 2.642e-19 | 5.16e-15 |
| ANKAR | 6.243e-17 | 1.22e-12 |
| TRIM5 | 1.583e-16 | 3.09e-12 |
| EIF5 | 6.425e-16 | 1.25e-11 |
| CD47 | 2.827e-15 | 5.51e-11 |
Figure S2. Get High-res Image As an example, this figure shows the association of SEPSECS to 'NEOPLASM.DISEASESTAGE'. P value = 1.62e-72 with ANOVA analysis.
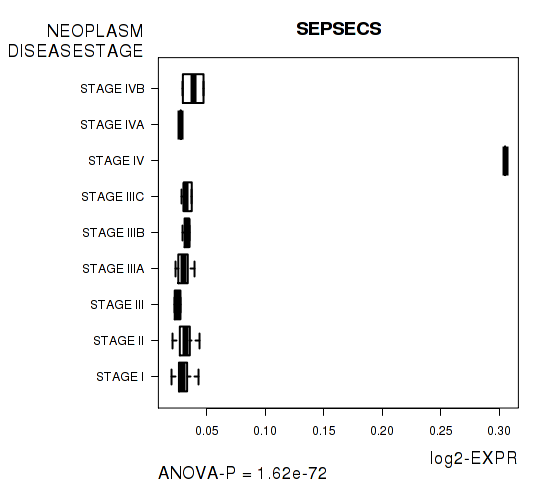
Table S6. Basic characteristics of clinical feature: 'PATHOLOGY.T.STAGE'
| PATHOLOGY.T.STAGE | Mean (SD) | 2.01 (0.96) |
| N | ||
| 1 | 61 | |
| 2 | 40 | |
| 3 | 44 | |
| 4 | 9 | |
| Significant markers | N = 0 |
Table S7. Basic characteristics of clinical feature: 'PATHOLOGY.N.STAGE'
| PATHOLOGY.N.STAGE | Labels | N |
| class0 | 101 | |
| class1 | 3 | |
| Significant markers | N = 261 | |
| Higher in class1 | 59 | |
| Higher in class0 | 202 |
Table S8. Get Full Table List of top 10 genes differentially expressed by 'PATHOLOGY.N.STAGE'
| T(pos if higher in 'class1') | ttestP | Q | AUC | |
|---|---|---|---|---|
| MSC | -11.95 | 2.142e-20 | 4.18e-16 | 0.9109 |
| PTP4A3 | -16.66 | 2.228e-20 | 4.35e-16 | 0.9604 |
| FAM157A | -15.47 | 4.439e-19 | 8.66e-15 | 0.9538 |
| GRAMD1A | -10.43 | 9.053e-18 | 1.77e-13 | 0.8086 |
| THBD | -11 | 1.882e-17 | 3.67e-13 | 0.8218 |
| TSPAN15 | -10.22 | 3.229e-17 | 6.3e-13 | 0.8647 |
| PCDHGA1__14 | -10.04 | 6.598e-17 | 1.29e-12 | 0.8647 |
| PCDHGA2__14 | -10.04 | 6.598e-17 | 1.29e-12 | 0.8647 |
| PCDHGA3__12 | -10.04 | 6.598e-17 | 1.29e-12 | 0.8647 |
| PCDHGA4__11 | -10.04 | 6.598e-17 | 1.29e-12 | 0.8647 |
Figure S3. Get High-res Image As an example, this figure shows the association of MSC to 'PATHOLOGY.N.STAGE'. P value = 2.14e-20 with T-test analysis.
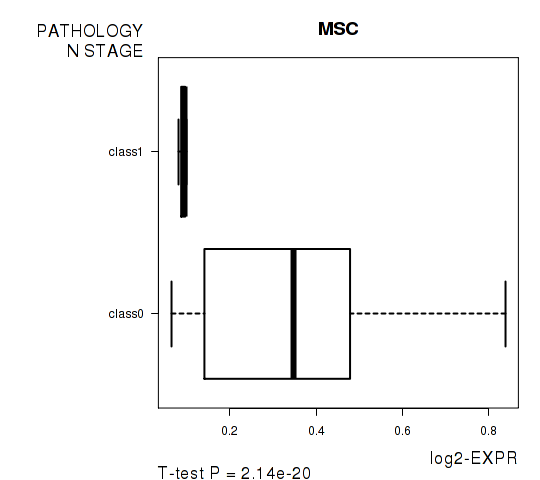
Table S9. Basic characteristics of clinical feature: 'PATHOLOGY.M.STAGE'
| PATHOLOGY.M.STAGE | Labels | N |
| M0 | 121 | |
| M1 | 3 | |
| MX | 30 | |
| Significant markers | N = 24 |
Table S10. Get Full Table List of top 10 genes differentially expressed by 'PATHOLOGY.M.STAGE'
| ANOVA_P | Q | |
|---|---|---|
| SEPSECS | 3.196e-14 | 6.24e-10 |
| ANKAR | 9.604e-14 | 1.87e-09 |
| MMP2 | 2.024e-12 | 3.95e-08 |
| SLC12A9 | 5.334e-12 | 1.04e-07 |
| AHR | 5.732e-10 | 1.12e-05 |
| HSPB11 | 7.718e-09 | 0.000151 |
| LRRC42 | 7.718e-09 | 0.000151 |
| C12ORF34__1 | 2.06e-08 | 0.000402 |
| MGC14436__1 | 2.06e-08 | 0.000402 |
| PTPN4 | 3.854e-08 | 0.000752 |
Figure S4. Get High-res Image As an example, this figure shows the association of SEPSECS to 'PATHOLOGY.M.STAGE'. P value = 3.2e-14 with ANOVA analysis.
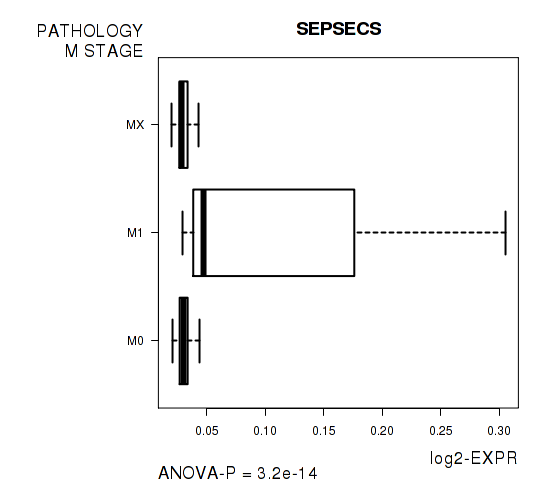
Table S11. Basic characteristics of clinical feature: 'GENDER'
| GENDER | Labels | N |
| FEMALE | 61 | |
| MALE | 93 | |
| Significant markers | N = 24 | |
| Higher in MALE | 6 | |
| Higher in FEMALE | 18 |
Table S12. Get Full Table List of top 10 genes differentially expressed by 'GENDER'
| T(pos if higher in 'MALE') | ttestP | Q | AUC | |
|---|---|---|---|---|
| ALG11__1 | 14.03 | 8.073e-22 | 1.58e-17 | 0.9542 |
| UTP14C | 14.03 | 8.073e-22 | 1.58e-17 | 0.9542 |
| ALDH3A1 | -7.07 | 5.386e-11 | 1.05e-06 | 0.7876 |
| C14ORF182 | -5.51 | 2.238e-07 | 0.00437 | 0.7446 |
| CCDC23__1 | -5.41 | 2.616e-07 | 0.0051 | 0.7243 |
| ERMAP__1 | -5.41 | 2.616e-07 | 0.0051 | 0.7243 |
| FAM83A | -5.43 | 2.746e-07 | 0.00536 | 0.7379 |
| LOC100131726 | -5.43 | 2.746e-07 | 0.00536 | 0.7379 |
| ZC3H4 | 5.38 | 2.793e-07 | 0.00545 | 0.7233 |
| CCDC121__1 | 5.45 | 2.935e-07 | 0.00573 | 0.7564 |
Figure S5. Get High-res Image As an example, this figure shows the association of ALG11__1 to 'GENDER'. P value = 8.07e-22 with T-test analysis.
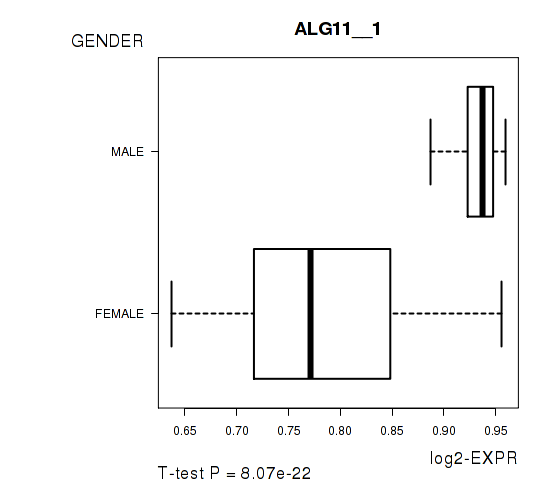
Table S13. Basic characteristics of clinical feature: 'COMPLETENESS.OF.RESECTION'
| COMPLETENESS.OF.RESECTION | Labels | N |
| R0 | 126 | |
| R1 | 11 | |
| R2 | 1 | |
| RX | 11 | |
| Significant markers | N = 8 |
Table S14. Get Full Table List of 8 genes differentially expressed by 'COMPLETENESS.OF.RESECTION'
| ANOVA_P | Q | |
|---|---|---|
| SEPSECS | 2.291e-80 | 4.47e-76 |
| BIVM | 4.095e-28 | 7.99e-24 |
| KDELC1 | 4.095e-28 | 7.99e-24 |
| CCDC94 | 7.863e-25 | 1.53e-20 |
| C5ORF42 | 2.59e-15 | 5.05e-11 |
| MMP2 | 2.6e-11 | 5.07e-07 |
| C1ORF101 | 1.099e-09 | 2.14e-05 |
| ACAD9 | 4.569e-07 | 0.00891 |
Figure S6. Get High-res Image As an example, this figure shows the association of SEPSECS to 'COMPLETENESS.OF.RESECTION'. P value = 2.29e-80 with ANOVA analysis.
-
Expresson data file = LIHC-TP.meth.by_min_clin_corr.data.txt
-
Clinical data file = LIHC-TP.merged_data.txt
-
Number of patients = 154
-
Number of genes = 19515
-
Number of clinical features = 8
For survival clinical features, Wald's test in univariate Cox regression analysis with proportional hazards model (Andersen and Gill 1982) was used to estimate the P values using the 'coxph' function in R. Kaplan-Meier survival curves were plot using the four quartile subgroups of patients based on expression levels
For continuous numerical clinical features, Spearman's rank correlation coefficients (Spearman 1904) and two-tailed P values were estimated using 'cor.test' function in R
For multi-class clinical features (ordinal or nominal), one-way analysis of variance (Howell 2002) was applied to compare the log2-expression levels between different clinical classes using 'anova' function in R
For two-class clinical features, two-tailed Student's t test with unequal variance (Lehmann and Romano 2005) was applied to compare the log2-expression levels between the two clinical classes using 't.test' function in R
For multiple hypothesis correction, Q value is the False Discovery Rate (FDR) analogue of the P value (Benjamini and Hochberg 1995), defined as the minimum FDR at which the test may be called significant. We used the 'Benjamini and Hochberg' method of 'p.adjust' function in R to convert P values into Q values.
In addition to the links below, the full results of the analysis summarized in this report can also be downloaded programmatically using firehose_get, or interactively from either the Broad GDAC website or TCGA Data Coordination Center Portal.