This pipeline uses various statistical tests to identify mRNAs whose expression levels correlated to selected clinical features.
Testing the association between 17786 genes and 8 clinical features across 147 samples, statistically thresholded by Q value < 0.05, 6 clinical features related to at least one genes.
-
2 genes correlated to 'AGE'.
-
PCM1|5108 , FUT4|2526
-
2 genes correlated to 'NEOPLASM.DISEASESTAGE'.
-
KCNT1|57582 , YSK4|80122
-
42 genes correlated to 'PATHOLOGY.N.STAGE'.
-
AGPAT2|10555 , PI4KAP2|375133 , ATP5F1|515 , LRRC1|55227 , STAB2|55576 , ...
-
1 gene correlated to 'PATHOLOGY.M.STAGE'.
-
KCNT1|57582
-
53 genes correlated to 'GENDER'.
-
XIST|7503 , RPS4Y1|6192 , ZFY|7544 , TSIX|9383 , DDX3Y|8653 , ...
-
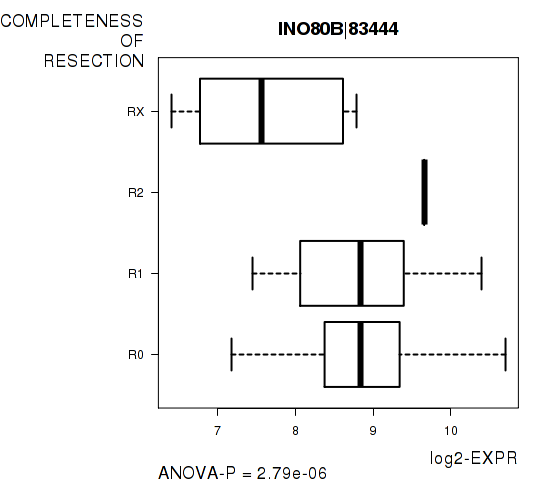
1 gene correlated to 'COMPLETENESS.OF.RESECTION'.
-
INO80B|83444
-
No genes correlated to 'Time to Death', and 'PATHOLOGY.T.STAGE'.
Complete statistical result table is provided in Supplement Table 1
Table 1. Get Full Table This table shows the clinical features, statistical methods used, and the number of genes that are significantly associated with each clinical feature at Q value < 0.05.
| Clinical feature | Statistical test | Significant genes | Associated with | Associated with | ||
|---|---|---|---|---|---|---|
| Time to Death | Cox regression test | N=0 | ||||
| AGE | Spearman correlation test | N=2 | older | N=0 | younger | N=2 |
| NEOPLASM DISEASESTAGE | ANOVA test | N=2 | ||||
| PATHOLOGY T STAGE | Spearman correlation test | N=0 | ||||
| PATHOLOGY N STAGE | t test | N=42 | class1 | N=31 | class0 | N=11 |
| PATHOLOGY M STAGE | ANOVA test | N=1 | ||||
| GENDER | t test | N=53 | male | N=34 | female | N=19 |
| COMPLETENESS OF RESECTION | ANOVA test | N=1 |
Table S1. Basic characteristics of clinical feature: 'Time to Death'
| Time to Death | Duration (Months) | 0-113 (median=14.1) |
| censored | N = 83 | |
| death | N = 62 | |
| Significant markers | N = 0 |
Table S2. Basic characteristics of clinical feature: 'AGE'
| AGE | Mean (SD) | 61.72 (14) |
| Significant markers | N = 2 | |
| pos. correlated | 0 | |
| neg. correlated | 2 |
Table S3. Get Full Table List of 2 genes significantly correlated to 'AGE' by Spearman correlation test
| SpearmanCorr | corrP | Q | |
|---|---|---|---|
| PCM1|5108 | -0.3919 | 1.087e-06 | 0.0193 |
| FUT4|2526 | -0.382 | 2.12e-06 | 0.0377 |
Figure S1. Get High-res Image As an example, this figure shows the association of PCM1|5108 to 'AGE'. P value = 1.09e-06 with Spearman correlation analysis. The straight line presents the best linear regression.
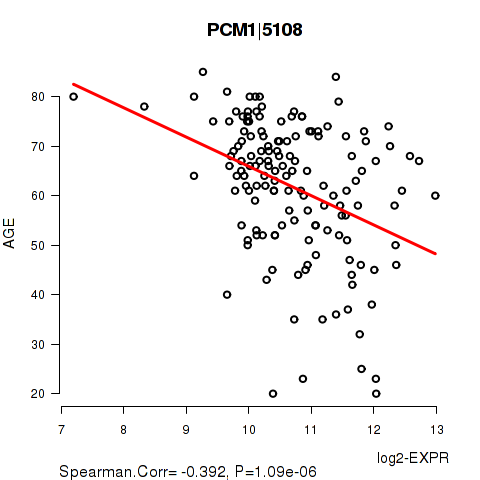
Table S4. Basic characteristics of clinical feature: 'NEOPLASM.DISEASESTAGE'
| NEOPLASM.DISEASESTAGE | Labels | N |
| STAGE I | 57 | |
| STAGE II | 34 | |
| STAGE III | 2 | |
| STAGE IIIA | 31 | |
| STAGE IIIB | 3 | |
| STAGE IIIC | 6 | |
| STAGE IV | 1 | |
| STAGE IVA | 1 | |
| STAGE IVB | 2 | |
| Significant markers | N = 2 |
Table S5. Get Full Table List of 2 genes differentially expressed by 'NEOPLASM.DISEASESTAGE'
| ANOVA_P | Q | |
|---|---|---|
| KCNT1|57582 | 1.477e-07 | 0.00263 |
| YSK4|80122 | 1.138e-06 | 0.0202 |
Figure S2. Get High-res Image As an example, this figure shows the association of KCNT1|57582 to 'NEOPLASM.DISEASESTAGE'. P value = 1.48e-07 with ANOVA analysis.
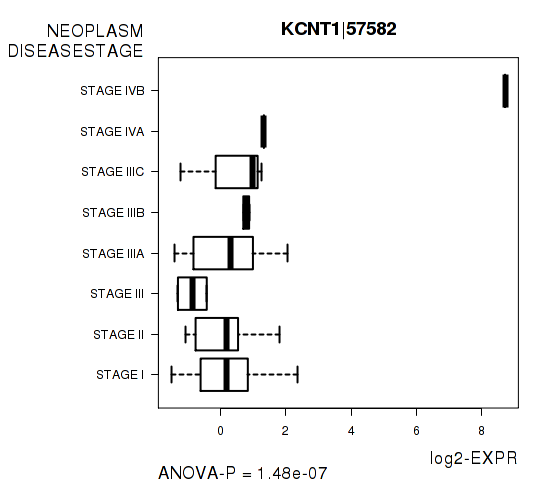
Table S6. Basic characteristics of clinical feature: 'PATHOLOGY.T.STAGE'
| PATHOLOGY.T.STAGE | Mean (SD) | 1.99 (0.97) |
| N | ||
| 1 | 60 | |
| 2 | 38 | |
| 3 | 40 | |
| 4 | 9 | |
| Significant markers | N = 0 |
Table S7. Basic characteristics of clinical feature: 'PATHOLOGY.N.STAGE'
| PATHOLOGY.N.STAGE | Labels | N |
| class0 | 95 | |
| class1 | 3 | |
| Significant markers | N = 42 | |
| Higher in class1 | 31 | |
| Higher in class0 | 11 |
Table S8. Get Full Table List of top 10 genes differentially expressed by 'PATHOLOGY.N.STAGE'
| T(pos if higher in 'class1') | ttestP | Q | AUC | |
|---|---|---|---|---|
| AGPAT2|10555 | 7.95 | 3.956e-12 | 6.3e-08 | 0.8105 |
| PI4KAP2|375133 | 10.5 | 1.286e-10 | 2.05e-06 | 0.9228 |
| ATP5F1|515 | 7.16 | 4.1e-10 | 6.53e-06 | 0.786 |
| LRRC1|55227 | 7.78 | 5.939e-10 | 9.46e-06 | 0.8246 |
| STAB2|55576 | -7.48 | 8.585e-10 | 1.37e-05 | 0.7851 |
| ARMCX3|51566 | 8.03 | 9.992e-10 | 1.59e-05 | 0.7965 |
| WARS2|10352 | 10.14 | 1.413e-09 | 2.25e-05 | 0.9228 |
| SFRS6|6431 | 7.66 | 2.989e-09 | 4.76e-05 | 0.793 |
| BAT4|7918 | -6.53 | 3.107e-09 | 4.95e-05 | 0.7158 |
| CYTH4|27128 | 6.44 | 4.803e-09 | 7.64e-05 | 0.7649 |
Figure S3. Get High-res Image As an example, this figure shows the association of AGPAT2|10555 to 'PATHOLOGY.N.STAGE'. P value = 3.96e-12 with T-test analysis.
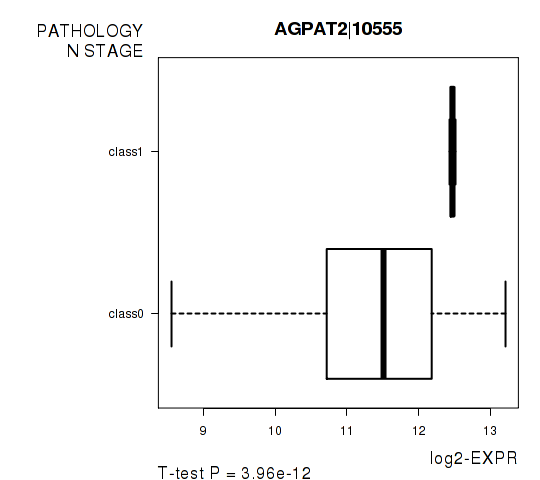
Table S9. Basic characteristics of clinical feature: 'PATHOLOGY.M.STAGE'
| PATHOLOGY.M.STAGE | Labels | N |
| M0 | 113 | |
| M1 | 3 | |
| MX | 31 | |
| Significant markers | N = 1 |
Table S10. Get Full Table List of one gene differentially expressed by 'PATHOLOGY.M.STAGE'
| ANOVA_P | Q | |
|---|---|---|
| KCNT1|57582 | 1.026e-09 | 1.83e-05 |
Figure S4. Get High-res Image As an example, this figure shows the association of KCNT1|57582 to 'PATHOLOGY.M.STAGE'. P value = 1.03e-09 with ANOVA analysis.
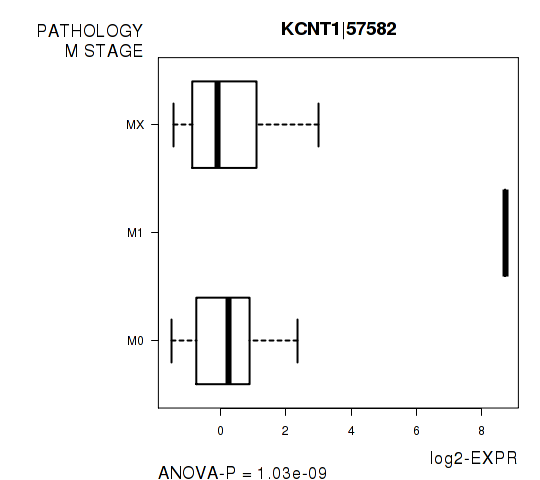
Table S11. Basic characteristics of clinical feature: 'GENDER'
| GENDER | Labels | N |
| FEMALE | 56 | |
| MALE | 91 | |
| Significant markers | N = 53 | |
| Higher in MALE | 34 | |
| Higher in FEMALE | 19 |
Table S12. Get Full Table List of top 10 genes differentially expressed by 'GENDER'
| T(pos if higher in 'MALE') | ttestP | Q | AUC | |
|---|---|---|---|---|
| XIST|7503 | -16.59 | 6.457e-32 | 1.15e-27 | 0.9714 |
| RPS4Y1|6192 | 27.17 | 1.77e-29 | 3.15e-25 | 0.9974 |
| ZFY|7544 | 24.45 | 9.349e-26 | 1.66e-21 | 0.9961 |
| TSIX|9383 | -15.13 | 1.134e-24 | 2.02e-20 | 0.9759 |
| DDX3Y|8653 | 25.72 | 1.194e-21 | 2.12e-17 | 0.9986 |
| PRKY|5616 | 18.9 | 1.285e-20 | 2.28e-16 | 0.9943 |
| KDM5D|8284 | 20.92 | 1.697e-16 | 3.02e-12 | 0.9969 |
| NLGN4Y|22829 | 13.37 | 9.035e-16 | 1.61e-11 | 0.9718 |
| KDM5C|8242 | -8.26 | 1.981e-13 | 3.52e-09 | 0.8373 |
| NCRNA00183|554203 | -6.61 | 1.282e-09 | 2.28e-05 | 0.7906 |
Figure S5. Get High-res Image As an example, this figure shows the association of XIST|7503 to 'GENDER'. P value = 6.46e-32 with T-test analysis.
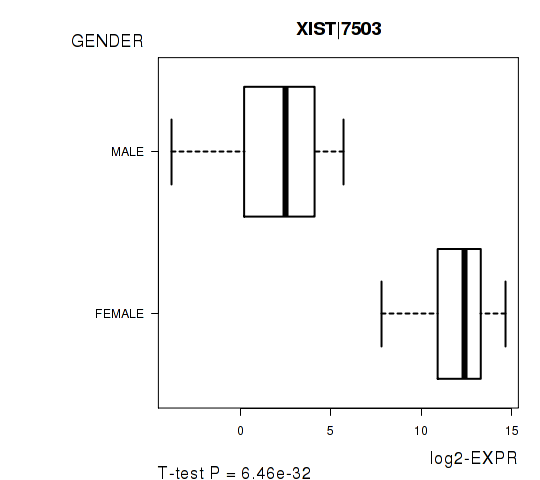
Table S13. Basic characteristics of clinical feature: 'COMPLETENESS.OF.RESECTION'
| COMPLETENESS.OF.RESECTION | Labels | N |
| R0 | 120 | |
| R1 | 11 | |
| R2 | 1 | |
| RX | 10 | |
| Significant markers | N = 1 |
Table S14. Get Full Table List of one gene differentially expressed by 'COMPLETENESS.OF.RESECTION'
| ANOVA_P | Q | |
|---|---|---|
| INO80B|83444 | 2.792e-06 | 0.0497 |
Figure S6. Get High-res Image As an example, this figure shows the association of INO80B|83444 to 'COMPLETENESS.OF.RESECTION'. P value = 2.79e-06 with ANOVA analysis.
-
Expresson data file = LIHC-TP.uncv2.mRNAseq_RSEM_normalized_log2.txt
-
Clinical data file = LIHC-TP.merged_data.txt
-
Number of patients = 147
-
Number of genes = 17786
-
Number of clinical features = 8
For survival clinical features, Wald's test in univariate Cox regression analysis with proportional hazards model (Andersen and Gill 1982) was used to estimate the P values using the 'coxph' function in R. Kaplan-Meier survival curves were plot using the four quartile subgroups of patients based on expression levels
For continuous numerical clinical features, Spearman's rank correlation coefficients (Spearman 1904) and two-tailed P values were estimated using 'cor.test' function in R
For multi-class clinical features (ordinal or nominal), one-way analysis of variance (Howell 2002) was applied to compare the log2-expression levels between different clinical classes using 'anova' function in R
For two-class clinical features, two-tailed Student's t test with unequal variance (Lehmann and Romano 2005) was applied to compare the log2-expression levels between the two clinical classes using 't.test' function in R
For multiple hypothesis correction, Q value is the False Discovery Rate (FDR) analogue of the P value (Benjamini and Hochberg 1995), defined as the minimum FDR at which the test may be called significant. We used the 'Benjamini and Hochberg' method of 'p.adjust' function in R to convert P values into Q values.
In addition to the links below, the full results of the analysis summarized in this report can also be downloaded programmatically using firehose_get, or interactively from either the Broad GDAC website or TCGA Data Coordination Center Portal.