This pipeline computes the correlation between significant copy number variation (cnv focal) genes and selected clinical features.
Testing the association between copy number variation 68 focal events and 6 clinical features across 562 patients, 9 significant findings detected with Q value < 0.25.
-
amp_1q21.3 cnv correlated to 'AGE'.
-
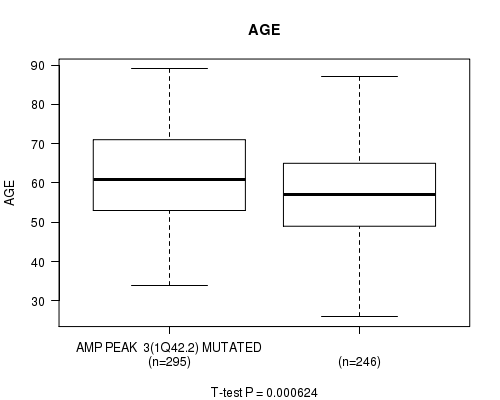
amp_1q42.2 cnv correlated to 'AGE'.
-
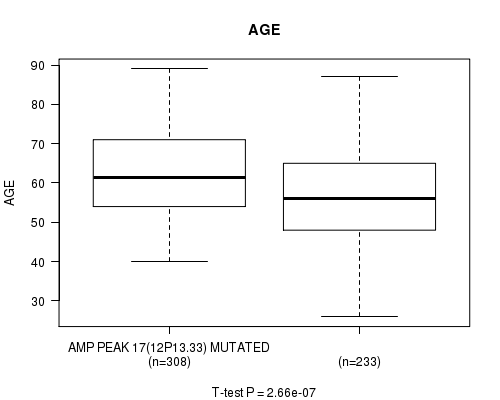
amp_12p13.33 cnv correlated to 'AGE'.
-
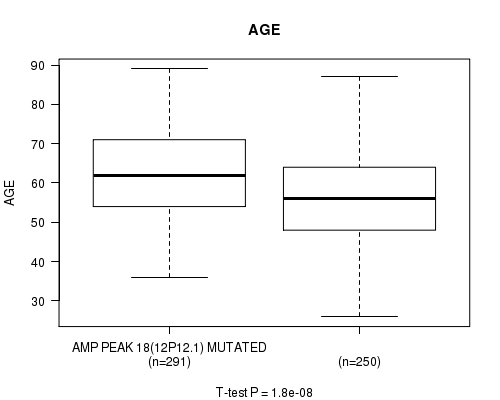
amp_12p12.1 cnv correlated to 'AGE'.
-
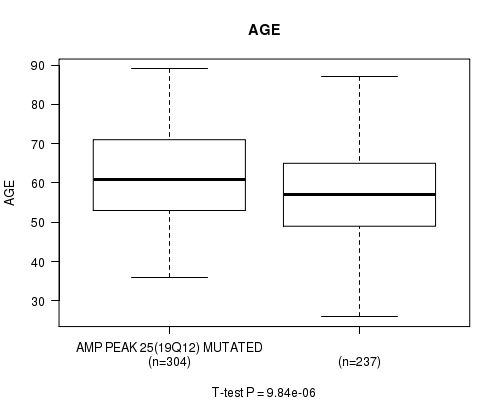
amp_19q12 cnv correlated to 'AGE'.
-
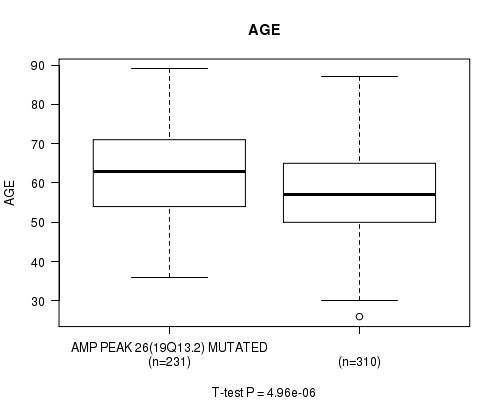
amp_19q13.2 cnv correlated to 'AGE'.
-
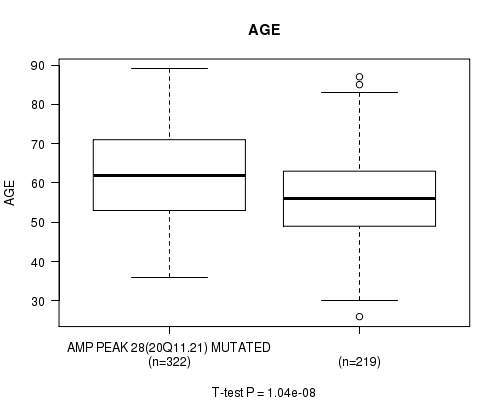
amp_20q11.21 cnv correlated to 'AGE'.
-
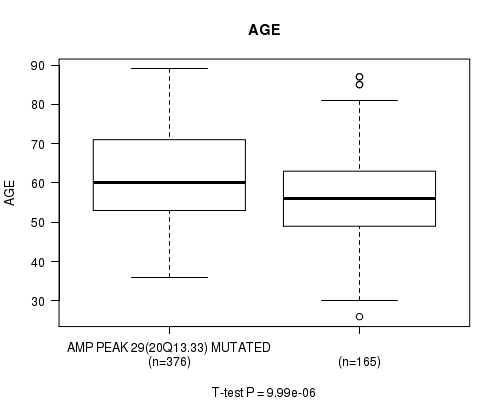
amp_20q13.33 cnv correlated to 'AGE'.
-
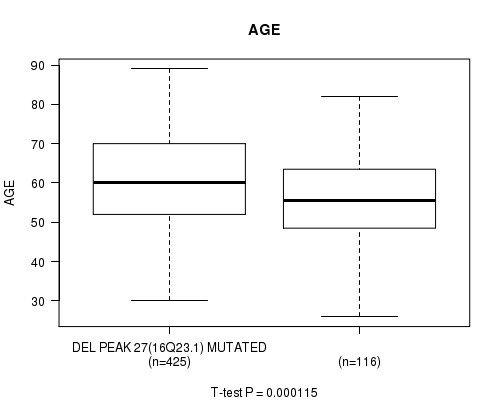
del_16q23.1 cnv correlated to 'AGE'.
Table 1. Get Full Table Overview of the association between significant copy number variation of 68 focal events and 6 clinical features. Shown in the table are P values (Q values). Thresholded by Q value < 0.25, 9 significant findings detected.
|
Clinical Features |
Time to Death |
AGE |
PRIMARY SITE OF DISEASE |
KARNOFSKY PERFORMANCE SCORE |
RADIATIONS RADIATION REGIMENINDICATION |
COMPLETENESS OF RESECTION |
||
| nCNV (%) | nWild-Type | logrank test | t-test | Fisher's exact test | t-test | Fisher's exact test | Fisher's exact test | |
| amp 1q21 3 | 358 (64%) | 204 |
0.246 (1.00) |
4.74e-06 (0.00192) |
0.125 (1.00) |
0.408 (1.00) |
1 (1.00) |
0.349 (1.00) |
| amp 1q42 2 | 308 (55%) | 254 |
0.196 (1.00) |
0.000624 (0.25) |
0.253 (1.00) |
0.736 (1.00) |
0.592 (1.00) |
0.875 (1.00) |
| amp 12p13 33 | 320 (57%) | 242 |
0.63 (1.00) |
2.66e-07 (0.000108) |
0.758 (1.00) |
0.673 (1.00) |
1 (1.00) |
0.339 (1.00) |
| amp 12p12 1 | 305 (54%) | 257 |
0.0495 (1.00) |
1.8e-08 (7.31e-06) |
0.252 (1.00) |
0.295 (1.00) |
0.595 (1.00) |
1 (1.00) |
| amp 19q12 | 315 (56%) | 247 |
0.479 (1.00) |
9.84e-06 (0.00397) |
0.158 (1.00) |
0.51 (1.00) |
1 (1.00) |
1 (1.00) |
| amp 19q13 2 | 238 (42%) | 324 |
0.0118 (1.00) |
4.96e-06 (0.002) |
0.152 (1.00) |
0.989 (1.00) |
0.577 (1.00) |
0.211 (1.00) |
| amp 20q11 21 | 335 (60%) | 227 |
0.0825 (1.00) |
1.04e-08 (4.22e-06) |
1 (1.00) |
0.264 (1.00) |
1 (1.00) |
0.584 (1.00) |
| amp 20q13 33 | 389 (69%) | 173 |
0.392 (1.00) |
9.99e-06 (0.00401) |
1 (1.00) |
0.752 (1.00) |
1 (1.00) |
0.0802 (1.00) |
| del 16q23 1 | 439 (78%) | 123 |
0.238 (1.00) |
0.000115 (0.0463) |
0.629 (1.00) |
0.0778 (1.00) |
1 (1.00) |
0.0955 (1.00) |
| amp 1p34 3 | 285 (51%) | 277 |
0.0217 (1.00) |
0.00611 (1.00) |
1 (1.00) |
0.985 (1.00) |
0.249 (1.00) |
0.478 (1.00) |
| amp 2p23 2 | 240 (43%) | 322 |
0.735 (1.00) |
0.0735 (1.00) |
0.76 (1.00) |
0.923 (1.00) |
1 (1.00) |
0.664 (1.00) |
| amp 2q31 2 | 256 (46%) | 306 |
0.145 (1.00) |
0.0159 (1.00) |
0.754 (1.00) |
0.756 (1.00) |
0.0939 (1.00) |
0.873 (1.00) |
| amp 3q26 2 | 469 (83%) | 93 |
0.879 (1.00) |
0.00153 (0.604) |
1 (1.00) |
0.00131 (0.517) |
1 (1.00) |
0.778 (1.00) |
| amp 4p16 3 | 156 (28%) | 406 |
0.587 (1.00) |
0.548 (1.00) |
0.725 (1.00) |
0.088 (1.00) |
0.188 (1.00) |
0.529 (1.00) |
| amp 4q13 3 | 110 (20%) | 452 |
0.294 (1.00) |
0.18 (1.00) |
0.586 (1.00) |
0.187 (1.00) |
0.48 (1.00) |
0.411 (1.00) |
| amp 5p15 33 | 301 (54%) | 261 |
0.0818 (1.00) |
0.00644 (1.00) |
0.752 (1.00) |
0.736 (1.00) |
0.6 (1.00) |
0.0469 (1.00) |
| amp 6p22 3 | 293 (52%) | 269 |
0.119 (1.00) |
0.00518 (1.00) |
1 (1.00) |
0.597 (1.00) |
1 (1.00) |
0.513 (1.00) |
| amp 7q36 3 | 306 (54%) | 256 |
0.134 (1.00) |
0.752 (1.00) |
1 (1.00) |
0.027 (1.00) |
0.594 (1.00) |
0.211 (1.00) |
| amp 8p11 21 | 206 (37%) | 356 |
0.245 (1.00) |
0.00067 (0.268) |
0.124 (1.00) |
0.725 (1.00) |
0.558 (1.00) |
0.161 (1.00) |
| amp 8q24 21 | 444 (79%) | 118 |
0.489 (1.00) |
0.128 (1.00) |
1 (1.00) |
0.628 (1.00) |
0.508 (1.00) |
0.391 (1.00) |
| amp 10p15 3 | 244 (43%) | 318 |
0.166 (1.00) |
0.000703 (0.278) |
0.158 (1.00) |
0.923 (1.00) |
0.582 (1.00) |
0.76 (1.00) |
| amp 10q22 3 | 178 (32%) | 384 |
0.562 (1.00) |
0.129 (1.00) |
0.0994 (1.00) |
0.989 (1.00) |
1 (1.00) |
0.456 (1.00) |
| amp 11q14 1 | 249 (44%) | 313 |
0.473 (1.00) |
0.451 (1.00) |
0.255 (1.00) |
0.474 (1.00) |
1 (1.00) |
1 (1.00) |
| amp 14q11 2 | 144 (26%) | 418 |
0.738 (1.00) |
0.053 (1.00) |
0.127 (1.00) |
0.331 (1.00) |
0.163 (1.00) |
0.837 (1.00) |
| amp 14q32 33 | 152 (27%) | 410 |
0.503 (1.00) |
0.0301 (1.00) |
0.717 (1.00) |
0.566 (1.00) |
0.0195 (1.00) |
1 (1.00) |
| amp 15q26 3 | 157 (28%) | 405 |
0.0685 (1.00) |
0.236 (1.00) |
0.736 (1.00) |
0.37 (1.00) |
0.564 (1.00) |
1 (1.00) |
| amp 17q25 3 | 209 (37%) | 353 |
0.0801 (1.00) |
0.644 (1.00) |
0.261 (1.00) |
0.685 (1.00) |
1 (1.00) |
0.0901 (1.00) |
| amp 18q11 2 | 138 (25%) | 424 |
0.666 (1.00) |
0.0779 (1.00) |
0.117 (1.00) |
0.127 (1.00) |
0.571 (1.00) |
0.837 (1.00) |
| amp 19p13 12 | 306 (54%) | 256 |
0.233 (1.00) |
0.0567 (1.00) |
0.458 (1.00) |
0.597 (1.00) |
0.594 (1.00) |
0.413 (1.00) |
| amp 20p13 | 311 (55%) | 251 |
0.281 (1.00) |
0.000678 (0.27) |
0.755 (1.00) |
0.11 (1.00) |
1 (1.00) |
0.381 (1.00) |
| amp 22q12 2 | 89 (16%) | 473 |
0.557 (1.00) |
0.0264 (1.00) |
0.506 (1.00) |
0.419 (1.00) |
1 (1.00) |
1 (1.00) |
| amp xp11 23 | 154 (27%) | 408 |
0.247 (1.00) |
0.0824 (1.00) |
0.0668 (1.00) |
0.357 (1.00) |
0.565 (1.00) |
0.329 (1.00) |
| amp xq28 | 214 (38%) | 348 |
0.481 (1.00) |
0.624 (1.00) |
0.776 (1.00) |
0.578 (1.00) |
0.0547 (1.00) |
0.875 (1.00) |
| del 1p36 11 | 263 (47%) | 299 |
0.183 (1.00) |
0.249 (1.00) |
0.75 (1.00) |
0.427 (1.00) |
1 (1.00) |
1 (1.00) |
| del 1q41 | 92 (16%) | 470 |
0.821 (1.00) |
0.391 (1.00) |
1 (1.00) |
0.456 (1.00) |
0.416 (1.00) |
0.604 (1.00) |
| del 2p25 3 | 120 (21%) | 442 |
0.922 (1.00) |
0.453 (1.00) |
0.623 (1.00) |
0.941 (1.00) |
0.514 (1.00) |
0.0216 (1.00) |
| del 2q22 1 | 133 (24%) | 429 |
0.412 (1.00) |
0.214 (1.00) |
0.663 (1.00) |
0.474 (1.00) |
1 (1.00) |
0.645 (1.00) |
| del 2q37 3 | 170 (30%) | 392 |
0.472 (1.00) |
0.0756 (1.00) |
0.356 (1.00) |
0.432 (1.00) |
0.219 (1.00) |
0.174 (1.00) |
| del 3p26 2 | 206 (37%) | 356 |
0.764 (1.00) |
0.00222 (0.872) |
0.126 (1.00) |
0.246 (1.00) |
0.0488 (1.00) |
0.287 (1.00) |
| del 4q22 1 | 384 (68%) | 178 |
0.659 (1.00) |
0.984 (1.00) |
0.79 (1.00) |
0.709 (1.00) |
1 (1.00) |
0.846 (1.00) |
| del 4q34 3 | 410 (73%) | 152 |
0.956 (1.00) |
0.385 (1.00) |
0.72 (1.00) |
0.276 (1.00) |
0.567 (1.00) |
0.567 (1.00) |
| del 5q11 2 | 341 (61%) | 221 |
0.767 (1.00) |
0.639 (1.00) |
0.772 (1.00) |
0.325 (1.00) |
0.565 (1.00) |
0.209 (1.00) |
| del 5q13 2 | 406 (72%) | 156 |
0.245 (1.00) |
0.842 (1.00) |
0.731 (1.00) |
0.187 (1.00) |
0.188 (1.00) |
0.238 (1.00) |
| del 6q27 | 375 (67%) | 187 |
0.339 (1.00) |
0.000686 (0.272) |
1 (1.00) |
0.508 (1.00) |
1 (1.00) |
0.872 (1.00) |
| del 7p22 1 | 245 (44%) | 317 |
0.0696 (1.00) |
0.0206 (1.00) |
0.757 (1.00) |
0.497 (1.00) |
1 (1.00) |
0.179 (1.00) |
| del 8p23 3 | 378 (67%) | 184 |
0.19 (1.00) |
0.0568 (1.00) |
1 (1.00) |
0.973 (1.00) |
1 (1.00) |
0.859 (1.00) |
| del 8p21 2 | 394 (70%) | 168 |
0.712 (1.00) |
0.0621 (1.00) |
1 (1.00) |
0.647 (1.00) |
1 (1.00) |
0.44 (1.00) |
| del 9p24 3 | 255 (45%) | 307 |
0.755 (1.00) |
0.0202 (1.00) |
0.452 (1.00) |
0.928 (1.00) |
0.593 (1.00) |
0.749 (1.00) |
| del 9q34 13 | 336 (60%) | 226 |
0.905 (1.00) |
0.0628 (1.00) |
0.767 (1.00) |
0.623 (1.00) |
0.277 (1.00) |
0.499 (1.00) |
| del 10p15 3 | 117 (21%) | 445 |
0.368 (1.00) |
0.883 (1.00) |
0.605 (1.00) |
0.72 (1.00) |
0.504 (1.00) |
1 (1.00) |
| del 10q24 2 | 245 (44%) | 317 |
0.268 (1.00) |
0.171 (1.00) |
1 (1.00) |
0.206 (1.00) |
0.583 (1.00) |
1 (1.00) |
| del 11p15 5 | 332 (59%) | 230 |
0.115 (1.00) |
0.57 (1.00) |
0.0267 (1.00) |
0.267 (1.00) |
1 (1.00) |
0.873 (1.00) |
| del 11q25 | 193 (34%) | 369 |
0.707 (1.00) |
0.0538 (1.00) |
0.225 (1.00) |
0.381 (1.00) |
0.272 (1.00) |
0.253 (1.00) |
| del 12q24 33 | 211 (38%) | 351 |
0.822 (1.00) |
0.0982 (1.00) |
0.13 (1.00) |
0.652 (1.00) |
0.295 (1.00) |
0.0415 (1.00) |
| del 13q14 2 | 352 (63%) | 210 |
0.0842 (1.00) |
0.663 (1.00) |
0.78 (1.00) |
0.592 (1.00) |
0.559 (1.00) |
0.329 (1.00) |
| del 14q23 3 | 296 (53%) | 266 |
0.817 (1.00) |
0.494 (1.00) |
0.472 (1.00) |
0.0423 (1.00) |
0.105 (1.00) |
0.759 (1.00) |
| del 15q15 1 | 356 (63%) | 206 |
0.817 (1.00) |
0.00499 (1.00) |
0.41 (1.00) |
0.381 (1.00) |
0.302 (1.00) |
1 (1.00) |
| del 16p13 3 | 303 (54%) | 259 |
0.949 (1.00) |
0.785 (1.00) |
0.752 (1.00) |
0.409 (1.00) |
0.597 (1.00) |
1 (1.00) |
| del 16q22 1 | 449 (80%) | 113 |
0.765 (1.00) |
0.00576 (1.00) |
0.188 (1.00) |
0.275 (1.00) |
1 (1.00) |
0.167 (1.00) |
| del 17p12 | 477 (85%) | 85 |
0.974 (1.00) |
0.984 (1.00) |
0.484 (1.00) |
0.73 (1.00) |
1 (1.00) |
0.329 (1.00) |
| del 17q11 2 | 460 (82%) | 102 |
0.542 (1.00) |
0.0235 (1.00) |
0.0666 (1.00) |
0.686 (1.00) |
1 (1.00) |
0.873 (1.00) |
| del 18q23 | 372 (66%) | 190 |
0.817 (1.00) |
0.342 (1.00) |
0.216 (1.00) |
0.544 (1.00) |
1 (1.00) |
1 (1.00) |
| del 19p13 3 | 495 (88%) | 67 |
0.231 (1.00) |
0.0114 (1.00) |
1 (1.00) |
0.00833 (1.00) |
1 (1.00) |
0.493 (1.00) |
| del 19q13 33 | 291 (52%) | 271 |
0.527 (1.00) |
0.424 (1.00) |
1 (1.00) |
0.311 (1.00) |
0.25 (1.00) |
0.354 (1.00) |
| del 19q13 43 | 275 (49%) | 287 |
0.41 (1.00) |
0.0369 (1.00) |
1 (1.00) |
0.283 (1.00) |
1 (1.00) |
0.339 (1.00) |
| del 21q22 3 | 220 (39%) | 342 |
0.405 (1.00) |
0.354 (1.00) |
0.772 (1.00) |
0.665 (1.00) |
1 (1.00) |
0.664 (1.00) |
| del 22q13 32 | 489 (87%) | 73 |
0.996 (1.00) |
0.883 (1.00) |
0.434 (1.00) |
0.996 (1.00) |
1 (1.00) |
0.675 (1.00) |
| del xp21 1 | 347 (62%) | 215 |
0.971 (1.00) |
0.508 (1.00) |
1 (1.00) |
0.987 (1.00) |
0.29 (1.00) |
0.759 (1.00) |
P value = 4.74e-06 (t-test), Q value = 0.0019
Table S1. Gene #2: 'amp_1q21.3' versus Clinical Feature #2: 'AGE'
| nPatients | Mean (Std.Dev) | |
|---|---|---|
| ALL | 541 | 59.8 (11.6) |
| AMP PEAK 2(1Q21.3) MUTATED | 345 | 61.6 (11.0) |
| AMP PEAK 2(1Q21.3) WILD-TYPE | 196 | 56.7 (12.1) |
Figure S1. Get High-res Image Gene #2: 'amp_1q21.3' versus Clinical Feature #2: 'AGE'

P value = 0.000624 (t-test), Q value = 0.25
Table S2. Gene #3: 'amp_1q42.2' versus Clinical Feature #2: 'AGE'
| nPatients | Mean (Std.Dev) | |
|---|---|---|
| ALL | 541 | 59.8 (11.6) |
| AMP PEAK 3(1Q42.2) MUTATED | 295 | 61.4 (11.3) |
| AMP PEAK 3(1Q42.2) WILD-TYPE | 246 | 57.9 (11.7) |
Figure S2. Get High-res Image Gene #3: 'amp_1q42.2' versus Clinical Feature #2: 'AGE'
P value = 2.66e-07 (t-test), Q value = 0.00011
Table S3. Gene #17: 'amp_12p13.33' versus Clinical Feature #2: 'AGE'
| nPatients | Mean (Std.Dev) | |
|---|---|---|
| ALL | 541 | 59.8 (11.6) |
| AMP PEAK 17(12P13.33) MUTATED | 308 | 62.0 (10.9) |
| AMP PEAK 17(12P13.33) WILD-TYPE | 233 | 56.8 (11.9) |
Figure S3. Get High-res Image Gene #17: 'amp_12p13.33' versus Clinical Feature #2: 'AGE'
P value = 1.8e-08 (t-test), Q value = 7.3e-06
Table S4. Gene #18: 'amp_12p12.1' versus Clinical Feature #2: 'AGE'
| nPatients | Mean (Std.Dev) | |
|---|---|---|
| ALL | 541 | 59.8 (11.6) |
| AMP PEAK 18(12P12.1) MUTATED | 291 | 62.4 (11.2) |
| AMP PEAK 18(12P12.1) WILD-TYPE | 250 | 56.8 (11.3) |
Figure S4. Get High-res Image Gene #18: 'amp_12p12.1' versus Clinical Feature #2: 'AGE'
P value = 9.84e-06 (t-test), Q value = 0.004
Table S5. Gene #25: 'amp_19q12' versus Clinical Feature #2: 'AGE'
| nPatients | Mean (Std.Dev) | |
|---|---|---|
| ALL | 541 | 59.8 (11.6) |
| AMP PEAK 25(19Q12) MUTATED | 304 | 61.7 (11.1) |
| AMP PEAK 25(19Q12) WILD-TYPE | 237 | 57.3 (11.8) |
Figure S5. Get High-res Image Gene #25: 'amp_19q12' versus Clinical Feature #2: 'AGE'
P value = 4.96e-06 (t-test), Q value = 0.002
Table S6. Gene #26: 'amp_19q13.2' versus Clinical Feature #2: 'AGE'
| nPatients | Mean (Std.Dev) | |
|---|---|---|
| ALL | 541 | 59.8 (11.6) |
| AMP PEAK 26(19Q13.2) MUTATED | 231 | 62.4 (11.2) |
| AMP PEAK 26(19Q13.2) WILD-TYPE | 310 | 57.8 (11.6) |
Figure S6. Get High-res Image Gene #26: 'amp_19q13.2' versus Clinical Feature #2: 'AGE'
P value = 1.04e-08 (t-test), Q value = 4.2e-06
Table S7. Gene #28: 'amp_20q11.21' versus Clinical Feature #2: 'AGE'
| nPatients | Mean (Std.Dev) | |
|---|---|---|
| ALL | 541 | 59.8 (11.6) |
| AMP PEAK 28(20Q11.21) MUTATED | 322 | 62.1 (11.5) |
| AMP PEAK 28(20Q11.21) WILD-TYPE | 219 | 56.4 (10.9) |
Figure S7. Get High-res Image Gene #28: 'amp_20q11.21' versus Clinical Feature #2: 'AGE'
P value = 9.99e-06 (t-test), Q value = 0.004
Table S8. Gene #29: 'amp_20q13.33' versus Clinical Feature #2: 'AGE'
| nPatients | Mean (Std.Dev) | |
|---|---|---|
| ALL | 541 | 59.8 (11.6) |
| AMP PEAK 29(20Q13.33) MUTATED | 376 | 61.2 (11.6) |
| AMP PEAK 29(20Q13.33) WILD-TYPE | 165 | 56.5 (11.1) |
Figure S8. Get High-res Image Gene #29: 'amp_20q13.33' versus Clinical Feature #2: 'AGE'
P value = 0.000115 (t-test), Q value = 0.046
Table S9. Gene #59: 'del_16q23.1' versus Clinical Feature #2: 'AGE'
| nPatients | Mean (Std.Dev) | |
|---|---|---|
| ALL | 541 | 59.8 (11.6) |
| DEL PEAK 27(16Q23.1) MUTATED | 425 | 60.8 (11.5) |
| DEL PEAK 27(16Q23.1) WILD-TYPE | 116 | 56.1 (11.2) |
Figure S9. Get High-res Image Gene #59: 'del_16q23.1' versus Clinical Feature #2: 'AGE'
-
Copy number data file = transformed.cor.cli.txt
-
Clinical data file = OV-TP.merged_data.txt
-
Number of patients = 562
-
Number of significantly focal cnvs = 68
-
Number of selected clinical features = 6
-
Exclude genes that fewer than K tumors have mutations, K = 3
For survival clinical features, the Kaplan-Meier survival curves of tumors with and without gene mutations were plotted and the statistical significance P values were estimated by logrank test (Bland and Altman 2004) using the 'survdiff' function in R
For continuous numerical clinical features, two-tailed Student's t test with unequal variance (Lehmann and Romano 2005) was applied to compare the clinical values between tumors with and without gene mutations using 't.test' function in R
For binary or multi-class clinical features (nominal or ordinal), two-tailed Fisher's exact tests (Fisher 1922) were used to estimate the P values using the 'fisher.test' function in R
For multiple hypothesis correction, Q value is the False Discovery Rate (FDR) analogue of the P value (Benjamini and Hochberg 1995), defined as the minimum FDR at which the test may be called significant. We used the 'Benjamini and Hochberg' method of 'p.adjust' function in R to convert P values into Q values.
In addition to the links below, the full results of the analysis summarized in this report can also be downloaded programmatically using firehose_get, or interactively from either the Broad GDAC website or TCGA Data Coordination Center Portal.