This pipeline uses various statistical tests to identify genes whose promoter methylation levels correlated to selected clinical features.
Testing the association between 14047 genes and 6 clinical features across 574 samples, statistically thresholded by Q value < 0.05, 4 clinical features related to at least one genes.
-
181 genes correlated to 'AGE'.
-
PCDHGA1__4 , PCDHGA10__3 , PCDHGA2__4 , PCDHGA3__4 , PCDHGA4__4 , ...
-
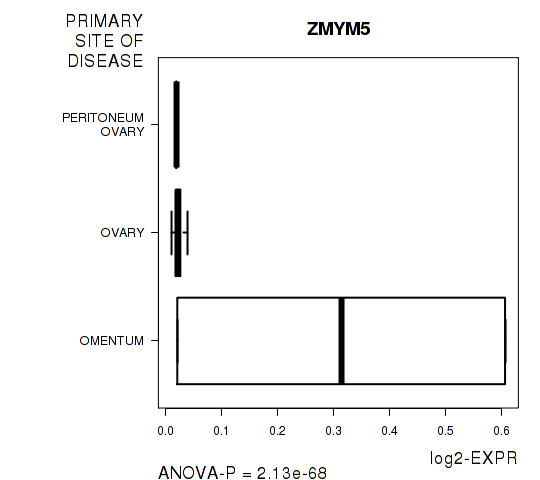
59 genes correlated to 'PRIMARY.SITE.OF.DISEASE'.
-
ZMYM5 , ZCCHC11 , CCNF , FOXN2 , SUV39H2 , ...
-
1324 genes correlated to 'RADIATIONS.RADIATION.REGIMENINDICATION'.
-
NID2 , ALDH6A1 , LIN52 , SLC25A17 , HSD17B14 , ...
-
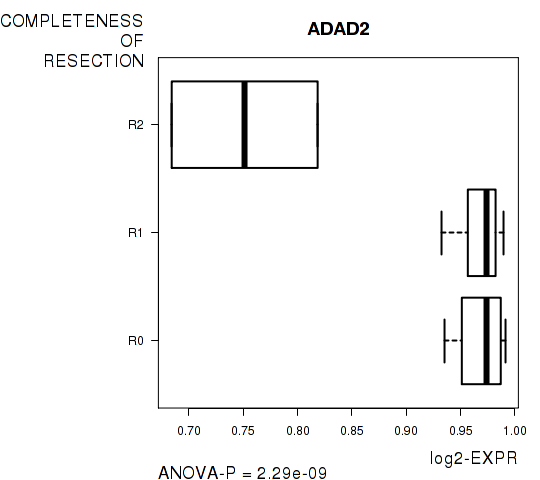
1 gene correlated to 'COMPLETENESS.OF.RESECTION'.
-
ADAD2
-
No genes correlated to 'Time to Death', and 'KARNOFSKY.PERFORMANCE.SCORE'.
Complete statistical result table is provided in Supplement Table 1
Table 1. Get Full Table This table shows the clinical features, statistical methods used, and the number of genes that are significantly associated with each clinical feature at Q value < 0.05.
| Clinical feature | Statistical test | Significant genes | Associated with | Associated with | ||
|---|---|---|---|---|---|---|
| Time to Death | Cox regression test | N=0 | ||||
| AGE | Spearman correlation test | N=181 | older | N=71 | younger | N=110 |
| PRIMARY SITE OF DISEASE | ANOVA test | N=59 | ||||
| KARNOFSKY PERFORMANCE SCORE | Spearman correlation test | N=0 | ||||
| RADIATIONS RADIATION REGIMENINDICATION | t test | N=1324 | yes | N=1253 | no | N=71 |
| COMPLETENESS OF RESECTION | ANOVA test | N=1 |
Table S1. Basic characteristics of clinical feature: 'Time to Death'
| Time to Death | Duration (Months) | 0.3-180.2 (median=28.5) |
| censored | N = 263 | |
| death | N = 295 | |
| Significant markers | N = 0 |
Table S2. Basic characteristics of clinical feature: 'AGE'
| AGE | Mean (SD) | 59.79 (12) |
| Significant markers | N = 181 | |
| pos. correlated | 71 | |
| neg. correlated | 110 |
Table S3. Get Full Table List of top 10 genes significantly correlated to 'AGE' by Spearman correlation test
| SpearmanCorr | corrP | Q | |
|---|---|---|---|
| PCDHGA1__4 | 0.3019 | 4.094e-13 | 5.75e-09 |
| PCDHGA10__3 | 0.3019 | 4.094e-13 | 5.75e-09 |
| PCDHGA2__4 | 0.3019 | 4.094e-13 | 5.75e-09 |
| PCDHGA3__4 | 0.3019 | 4.094e-13 | 5.75e-09 |
| PCDHGA4__4 | 0.3019 | 4.094e-13 | 5.75e-09 |
| PCDHGA5__4 | 0.3019 | 4.094e-13 | 5.75e-09 |
| PCDHGA6__4 | 0.3019 | 4.094e-13 | 5.75e-09 |
| PCDHGA7__4 | 0.3019 | 4.094e-13 | 5.75e-09 |
| PCDHGA8__3 | 0.3019 | 4.094e-13 | 5.75e-09 |
| PCDHGA9__3 | 0.3019 | 4.094e-13 | 5.75e-09 |
Figure S1. Get High-res Image As an example, this figure shows the association of PCDHGA1__4 to 'AGE'. P value = 4.09e-13 with Spearman correlation analysis. The straight line presents the best linear regression.
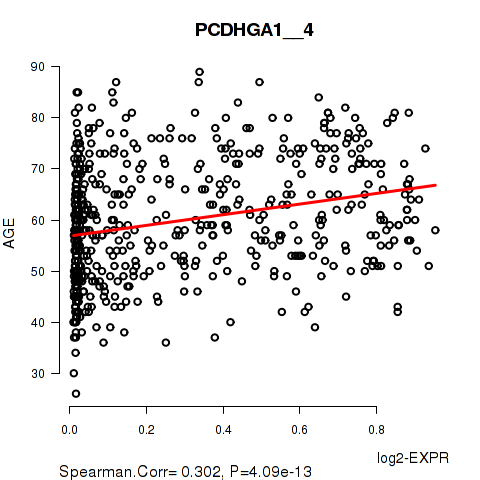
Table S4. Basic characteristics of clinical feature: 'PRIMARY.SITE.OF.DISEASE'
| PRIMARY.SITE.OF.DISEASE | Labels | N |
| OMENTUM | 2 | |
| OVARY | 560 | |
| PERITONEUM OVARY | 2 | |
| Significant markers | N = 59 |
Table S5. Get Full Table List of top 10 genes differentially expressed by 'PRIMARY.SITE.OF.DISEASE'
| ANOVA_P | Q | |
|---|---|---|
| ZMYM5 | 2.129e-68 | 2.99e-64 |
| ZCCHC11 | 1.089e-53 | 1.53e-49 |
| CCNF | 9.443e-48 | 1.33e-43 |
| FOXN2 | 2.05e-44 | 2.88e-40 |
| SUV39H2 | 2.262e-28 | 3.18e-24 |
| RANBP1 | 1.023e-26 | 1.44e-22 |
| TRMT2A | 1.023e-26 | 1.44e-22 |
| DBN1 | 5.833e-26 | 8.19e-22 |
| IRS2 | 1.286e-22 | 1.8e-18 |
| INHA | 3.36e-21 | 4.72e-17 |
Figure S2. Get High-res Image As an example, this figure shows the association of ZMYM5 to 'PRIMARY.SITE.OF.DISEASE'. P value = 2.13e-68 with ANOVA analysis.
No gene related to 'KARNOFSKY.PERFORMANCE.SCORE'.
Table S6. Basic characteristics of clinical feature: 'KARNOFSKY.PERFORMANCE.SCORE'
| KARNOFSKY.PERFORMANCE.SCORE | Mean (SD) | 75.64 (13) |
| Score | N | |
| 40 | 2 | |
| 60 | 20 | |
| 80 | 49 | |
| 100 | 7 | |
| Significant markers | N = 0 |
1324 genes related to 'RADIATIONS.RADIATION.REGIMENINDICATION'.
Table S7. Basic characteristics of clinical feature: 'RADIATIONS.RADIATION.REGIMENINDICATION'
| RADIATIONS.RADIATION.REGIMENINDICATION | Labels | N |
| NO | 3 | |
| YES | 571 | |
| Significant markers | N = 1324 | |
| Higher in YES | 1253 | |
| Higher in NO | 71 |
Table S8. Get Full Table List of top 10 genes differentially expressed by 'RADIATIONS.RADIATION.REGIMENINDICATION'
| T(pos if higher in 'YES') | ttestP | Q | AUC | |
|---|---|---|---|---|
| NID2 | 27.74 | 7.984e-108 | 1.12e-103 | 0.9685 |
| ALDH6A1 | 20.86 | 2.975e-72 | 4.18e-68 | 0.972 |
| LIN52 | 20.86 | 2.975e-72 | 4.18e-68 | 0.972 |
| SLC25A17 | 20.86 | 7.418e-68 | 1.04e-63 | 0.8578 |
| HSD17B14 | 22.32 | 7.572e-68 | 1.06e-63 | 0.8616 |
| PLEKHA4__1 | 22.32 | 7.572e-68 | 1.06e-63 | 0.8616 |
| LYPD5 | 19.74 | 8.446e-66 | 1.19e-61 | 0.7274 |
| PTPRN | 19.75 | 8.254e-65 | 1.16e-60 | 0.8961 |
| THY1 | 20.36 | 9.25e-65 | 1.3e-60 | 0.8809 |
| ACY1 | -18.88 | 3.911e-62 | 5.49e-58 | 0.7017 |
Figure S3. Get High-res Image As an example, this figure shows the association of NID2 to 'RADIATIONS.RADIATION.REGIMENINDICATION'. P value = 7.98e-108 with T-test analysis.
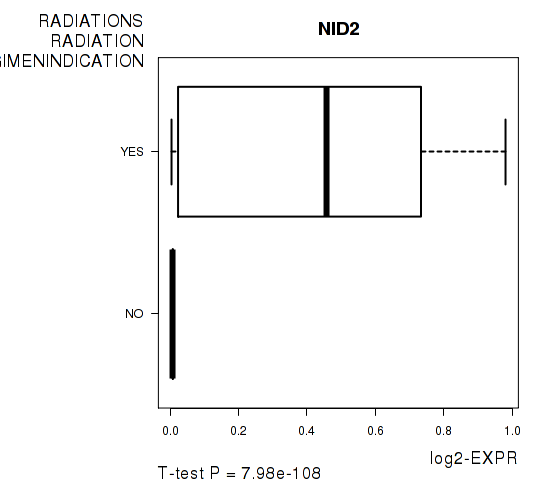
Table S9. Basic characteristics of clinical feature: 'COMPLETENESS.OF.RESECTION'
| COMPLETENESS.OF.RESECTION | Labels | N |
| R0 | 14 | |
| R1 | 26 | |
| R2 | 2 | |
| Significant markers | N = 1 |
Table S10. Get Full Table List of one gene differentially expressed by 'COMPLETENESS.OF.RESECTION'
| ANOVA_P | Q | |
|---|---|---|
| ADAD2 | 2.294e-09 | 3.22e-05 |
Figure S4. Get High-res Image As an example, this figure shows the association of ADAD2 to 'COMPLETENESS.OF.RESECTION'. P value = 2.29e-09 with ANOVA analysis.
-
Expresson data file = OV-TP.meth.by_min_clin_corr.data.txt
-
Clinical data file = OV-TP.merged_data.txt
-
Number of patients = 574
-
Number of genes = 14047
-
Number of clinical features = 6
For survival clinical features, Wald's test in univariate Cox regression analysis with proportional hazards model (Andersen and Gill 1982) was used to estimate the P values using the 'coxph' function in R. Kaplan-Meier survival curves were plot using the four quartile subgroups of patients based on expression levels
For continuous numerical clinical features, Spearman's rank correlation coefficients (Spearman 1904) and two-tailed P values were estimated using 'cor.test' function in R
For multi-class clinical features (ordinal or nominal), one-way analysis of variance (Howell 2002) was applied to compare the log2-expression levels between different clinical classes using 'anova' function in R
For two-class clinical features, two-tailed Student's t test with unequal variance (Lehmann and Romano 2005) was applied to compare the log2-expression levels between the two clinical classes using 't.test' function in R
For multiple hypothesis correction, Q value is the False Discovery Rate (FDR) analogue of the P value (Benjamini and Hochberg 1995), defined as the minimum FDR at which the test may be called significant. We used the 'Benjamini and Hochberg' method of 'p.adjust' function in R to convert P values into Q values.
In addition to the links below, the full results of the analysis summarized in this report can also be downloaded programmatically using firehose_get, or interactively from either the Broad GDAC website or TCGA Data Coordination Center Portal.