This pipeline uses various statistical tests to identify mRNAs whose expression levels correlated to selected clinical features.
Testing the association between 18632 genes and 6 clinical features across 562 samples, statistically thresholded by Q value < 0.05, 6 clinical features related to at least one genes.
-
1 gene correlated to 'Time to Death'.
-
ZFHX4
-
193 genes correlated to 'AGE'.
-
STS , GREB1 , DEPDC6 , GNPNAT1 , SLCO1A2 , ...
-
2 genes correlated to 'PRIMARY.SITE.OF.DISEASE'.
-
SPINK8 , PTBP1
-
1 gene correlated to 'KARNOFSKY.PERFORMANCE.SCORE'.
-
WDR60
-
30 genes correlated to 'RADIATIONS.RADIATION.REGIMENINDICATION'.
-
FLJ22662 , WDR62 , GLIPR1L2 , ATHL1 , ST6GALNAC6 , ...
-
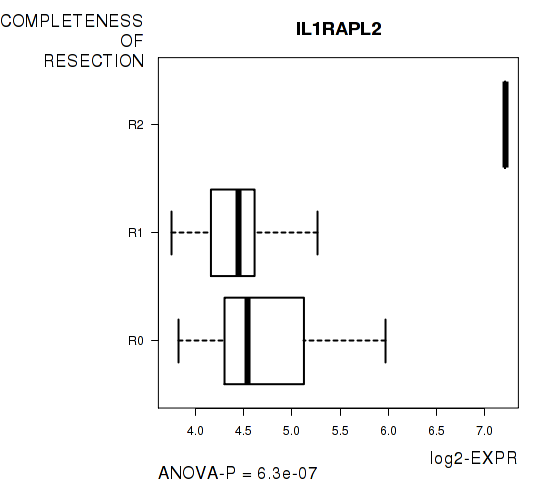
1 gene correlated to 'COMPLETENESS.OF.RESECTION'.
-
IL1RAPL2
Complete statistical result table is provided in Supplement Table 1
Table 1. Get Full Table This table shows the clinical features, statistical methods used, and the number of genes that are significantly associated with each clinical feature at Q value < 0.05.
| Clinical feature | Statistical test | Significant genes | Associated with | Associated with | ||
|---|---|---|---|---|---|---|
| Time to Death | Cox regression test | N=1 | shorter survival | N=1 | longer survival | N=0 |
| AGE | Spearman correlation test | N=193 | older | N=75 | younger | N=118 |
| PRIMARY SITE OF DISEASE | ANOVA test | N=2 | ||||
| KARNOFSKY PERFORMANCE SCORE | Spearman correlation test | N=1 | higher score | N=1 | lower score | N=0 |
| RADIATIONS RADIATION REGIMENINDICATION | t test | N=30 | yes | N=15 | no | N=15 |
| COMPLETENESS OF RESECTION | ANOVA test | N=1 |
Table S1. Basic characteristics of clinical feature: 'Time to Death'
| Time to Death | Duration (Months) | 0.3-180.2 (median=28.6) |
| censored | N = 264 | |
| death | N = 293 | |
| Significant markers | N = 1 | |
| associated with shorter survival | 1 | |
| associated with longer survival | 0 |
Table S2. Get Full Table List of one gene significantly associated with 'Time to Death' by Cox regression test
| HazardRatio | Wald_P | Q | C_index | |
|---|---|---|---|---|
| ZFHX4 | 1.63 | 2.256e-06 | 0.042 | 0.575 |
Figure S1. Get High-res Image As an example, this figure shows the association of ZFHX4 to 'Time to Death'. four curves present the cumulative survival rates of 4 quartile subsets of patients. P value = 2.26e-06 with univariate Cox regression analysis using continuous log-2 expression values.
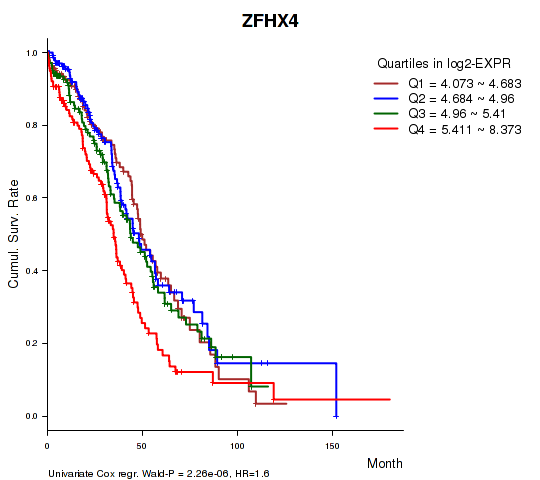
Table S3. Basic characteristics of clinical feature: 'AGE'
| AGE | Mean (SD) | 59.72 (12) |
| Significant markers | N = 193 | |
| pos. correlated | 75 | |
| neg. correlated | 118 |
Table S4. Get Full Table List of top 10 genes significantly correlated to 'AGE' by Spearman correlation test
| SpearmanCorr | corrP | Q | |
|---|---|---|---|
| STS | -0.307 | 1.713e-13 | 3.19e-09 |
| GREB1 | -0.3024 | 4.058e-13 | 7.56e-09 |
| DEPDC6 | -0.301 | 5.286e-13 | 9.85e-09 |
| GNPNAT1 | -0.2963 | 1.261e-12 | 2.35e-08 |
| SLCO1A2 | 0.2853 | 8.849e-12 | 1.65e-07 |
| EIF4E3 | -0.2847 | 9.779e-12 | 1.82e-07 |
| NPAL2 | -0.2761 | 4.258e-11 | 7.93e-07 |
| BRCC3 | -0.275 | 5.105e-11 | 9.51e-07 |
| NLK | 0.2749 | 5.176e-11 | 9.64e-07 |
| APPL2 | 0.2747 | 5.406e-11 | 1.01e-06 |
Figure S2. Get High-res Image As an example, this figure shows the association of STS to 'AGE'. P value = 1.71e-13 with Spearman correlation analysis. The straight line presents the best linear regression.
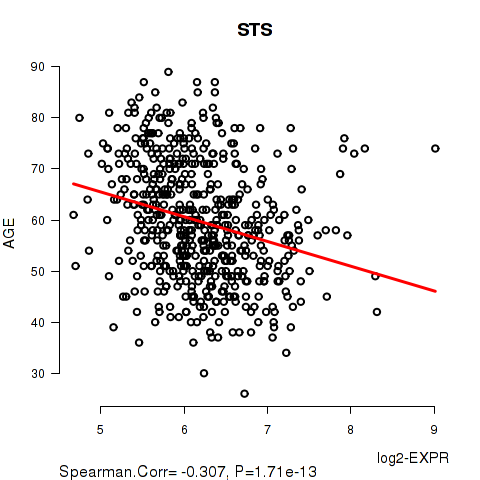
Table S5. Basic characteristics of clinical feature: 'PRIMARY.SITE.OF.DISEASE'
| PRIMARY.SITE.OF.DISEASE | Labels | N |
| OMENTUM | 2 | |
| OVARY | 558 | |
| PERITONEUM OVARY | 2 | |
| Significant markers | N = 2 |
Table S6. Get Full Table List of 2 genes differentially expressed by 'PRIMARY.SITE.OF.DISEASE'
| ANOVA_P | Q | |
|---|---|---|
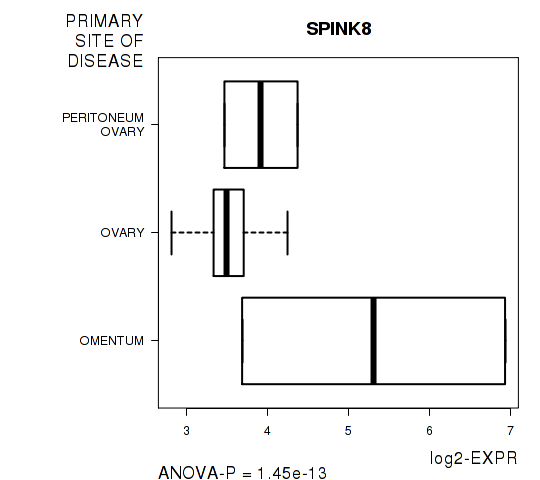
| SPINK8 | 1.447e-13 | 2.7e-09 |
| PTBP1 | 1.063e-09 | 1.98e-05 |
Figure S3. Get High-res Image As an example, this figure shows the association of SPINK8 to 'PRIMARY.SITE.OF.DISEASE'. P value = 1.45e-13 with ANOVA analysis.
One gene related to 'KARNOFSKY.PERFORMANCE.SCORE'.
Table S7. Basic characteristics of clinical feature: 'KARNOFSKY.PERFORMANCE.SCORE'
| KARNOFSKY.PERFORMANCE.SCORE | Mean (SD) | 75.64 (13) |
| Score | N | |
| 40 | 2 | |
| 60 | 20 | |
| 80 | 49 | |
| 100 | 7 | |
| Significant markers | N = 1 | |
| pos. correlated | 1 | |
| neg. correlated | 0 |
Table S8. Get Full Table List of one gene significantly correlated to 'KARNOFSKY.PERFORMANCE.SCORE' by Spearman correlation test
| SpearmanCorr | corrP | Q | |
|---|---|---|---|
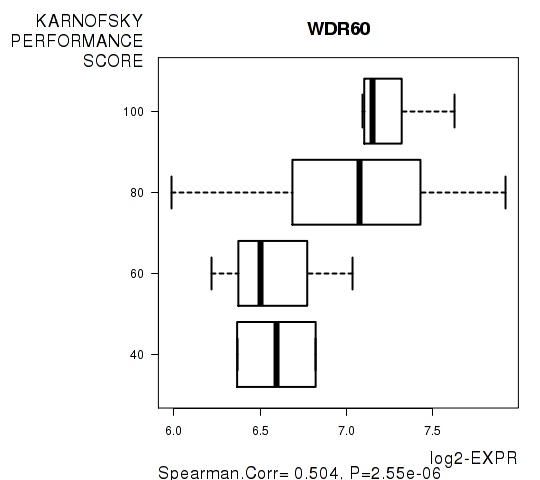
| WDR60 | 0.504 | 2.551e-06 | 0.0475 |
Figure S4. Get High-res Image As an example, this figure shows the association of WDR60 to 'KARNOFSKY.PERFORMANCE.SCORE'. P value = 2.55e-06 with Spearman correlation analysis.
30 genes related to 'RADIATIONS.RADIATION.REGIMENINDICATION'.
Table S9. Basic characteristics of clinical feature: 'RADIATIONS.RADIATION.REGIMENINDICATION'
| RADIATIONS.RADIATION.REGIMENINDICATION | Labels | N |
| NO | 3 | |
| YES | 559 | |
| Significant markers | N = 30 | |
| Higher in YES | 15 | |
| Higher in NO | 15 |
Table S10. Get Full Table List of top 10 genes differentially expressed by 'RADIATIONS.RADIATION.REGIMENINDICATION'
| T(pos if higher in 'YES') | ttestP | Q | AUC | |
|---|---|---|---|---|
| FLJ22662 | -24.23 | 4.068e-41 | 7.58e-37 | 0.867 |
| WDR62 | -13.77 | 2.368e-35 | 4.41e-31 | 0.7513 |
| GLIPR1L2 | -16.48 | 6.348e-35 | 1.18e-30 | 0.7794 |
| ATHL1 | 12.49 | 3.399e-31 | 6.33e-27 | 0.6535 |
| ST6GALNAC6 | 17.15 | 2.815e-20 | 5.24e-16 | 0.799 |
| SDK1 | -15 | 2.746e-15 | 5.12e-11 | 0.768 |
| CYP4A11 | 8.73 | 5.398e-15 | 1.01e-10 | 0.6184 |
| LOC388161 | 22.94 | 2.065e-13 | 3.85e-09 | 0.9207 |
| TMC5 | 8.42 | 5.86e-12 | 1.09e-07 | 0.5897 |
| C9ORF114 | -11.98 | 2.006e-11 | 3.74e-07 | 0.7358 |
Figure S5. Get High-res Image As an example, this figure shows the association of FLJ22662 to 'RADIATIONS.RADIATION.REGIMENINDICATION'. P value = 4.07e-41 with T-test analysis.
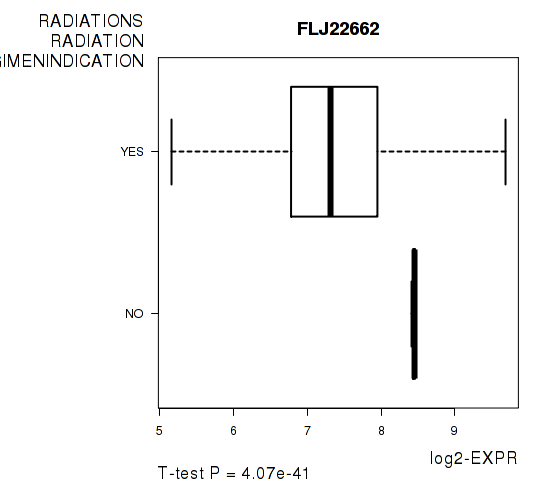
Table S11. Basic characteristics of clinical feature: 'COMPLETENESS.OF.RESECTION'
| COMPLETENESS.OF.RESECTION | Labels | N |
| R0 | 14 | |
| R1 | 27 | |
| R2 | 1 | |
| Significant markers | N = 1 |
Table S12. Get Full Table List of one gene differentially expressed by 'COMPLETENESS.OF.RESECTION'
| ANOVA_P | Q | |
|---|---|---|
| IL1RAPL2 | 6.299e-07 | 0.0117 |
Figure S6. Get High-res Image As an example, this figure shows the association of IL1RAPL2 to 'COMPLETENESS.OF.RESECTION'. P value = 6.3e-07 with ANOVA analysis.
-
Expresson data file = OV-TP.medianexp.txt
-
Clinical data file = OV-TP.merged_data.txt
-
Number of patients = 562
-
Number of genes = 18632
-
Number of clinical features = 6
For survival clinical features, Wald's test in univariate Cox regression analysis with proportional hazards model (Andersen and Gill 1982) was used to estimate the P values using the 'coxph' function in R. Kaplan-Meier survival curves were plot using the four quartile subgroups of patients based on expression levels
For continuous numerical clinical features, Spearman's rank correlation coefficients (Spearman 1904) and two-tailed P values were estimated using 'cor.test' function in R
For multi-class clinical features (ordinal or nominal), one-way analysis of variance (Howell 2002) was applied to compare the log2-expression levels between different clinical classes using 'anova' function in R
For two-class clinical features, two-tailed Student's t test with unequal variance (Lehmann and Romano 2005) was applied to compare the log2-expression levels between the two clinical classes using 't.test' function in R
For multiple hypothesis correction, Q value is the False Discovery Rate (FDR) analogue of the P value (Benjamini and Hochberg 1995), defined as the minimum FDR at which the test may be called significant. We used the 'Benjamini and Hochberg' method of 'p.adjust' function in R to convert P values into Q values.
In addition to the links below, the full results of the analysis summarized in this report can also be downloaded programmatically using firehose_get, or interactively from either the Broad GDAC website or TCGA Data Coordination Center Portal.