This pipeline computes the correlation between significant arm-level copy number variations (cnvs) and selected clinical features.
Testing the association between copy number variation 64 arm-level events and 12 clinical features across 72 patients, 3 significant findings detected with Q value < 0.25.
-
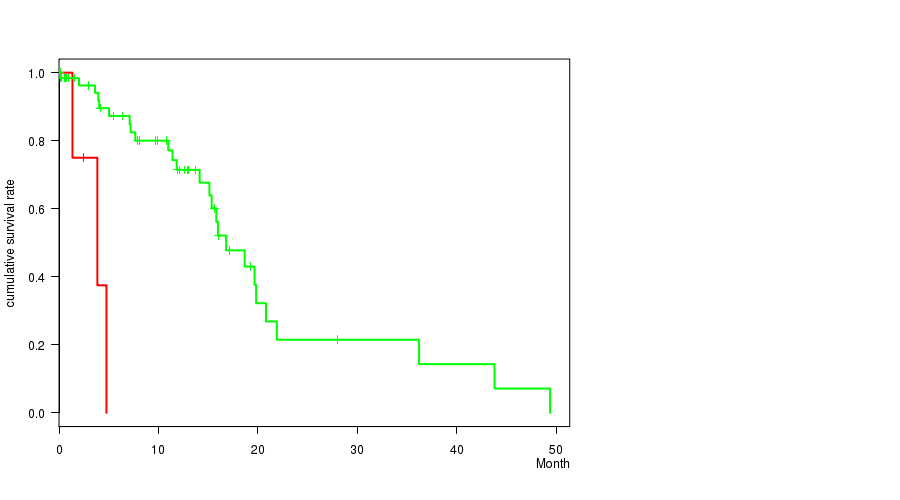
3p gain cnv correlated to 'Time to Death'.
-
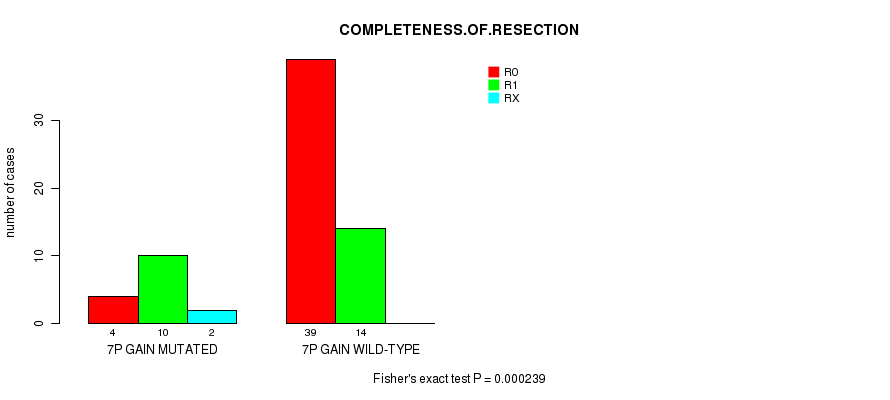
7p gain cnv correlated to 'COMPLETENESS.OF.RESECTION'.
-
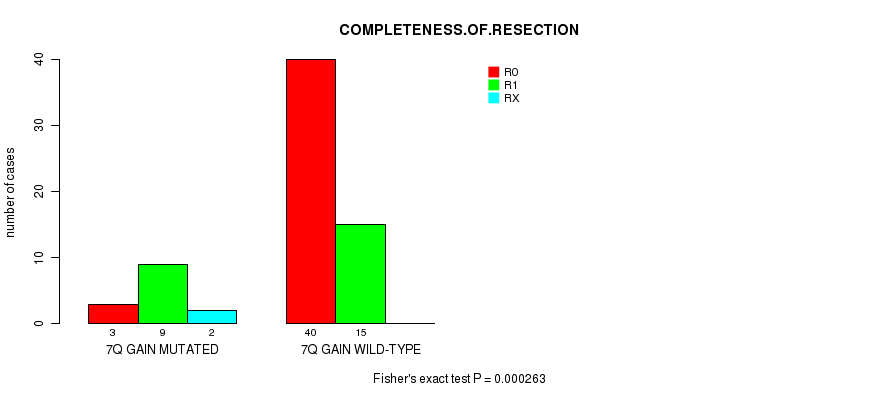
7q gain cnv correlated to 'COMPLETENESS.OF.RESECTION'.
Table 1. Get Full Table Overview of the association between significant copy number variation of 64 arm-level events and 12 clinical features. Shown in the table are P values (Q values). Thresholded by Q value < 0.25, 3 significant findings detected.
|
Clinical Features |
Time to Death |
AGE |
NEOPLASM DISEASESTAGE |
PATHOLOGY T STAGE |
PATHOLOGY N STAGE |
PATHOLOGY M STAGE |
GENDER |
HISTOLOGICAL TYPE |
NUMBERPACKYEARSSMOKED | YEAROFTOBACCOSMOKINGONSET |
COMPLETENESS OF RESECTION |
NUMBER OF LYMPH NODES |
||
| nCNV (%) | nWild-Type | logrank test | t-test | Chi-square test | Fisher's exact test | Fisher's exact test | Fisher's exact test | Fisher's exact test | Fisher's exact test | t-test | t-test | Fisher's exact test | t-test | |
| 3p gain | 5 (7%) | 67 |
1.03e-05 (0.00733) |
0.688 (1.00) |
0.748 (1.00) |
0.41 (1.00) |
0.595 (1.00) |
0.501 (1.00) |
0.357 (1.00) |
1 (1.00) |
1 (1.00) |
0.485 (1.00) |
||
| 7p gain | 18 (25%) | 54 |
0.945 (1.00) |
0.754 (1.00) |
0.693 (1.00) |
0.181 (1.00) |
1 (1.00) |
1 (1.00) |
0.415 (1.00) |
0.778 (1.00) |
0.00217 (1.00) |
0.79 (1.00) |
0.000239 (0.17) |
0.336 (1.00) |
| 7q gain | 16 (22%) | 56 |
0.813 (1.00) |
0.779 (1.00) |
0.471 (1.00) |
0.336 (1.00) |
0.327 (1.00) |
0.895 (1.00) |
0.778 (1.00) |
1 (1.00) |
0.000703 (0.496) |
0.407 (1.00) |
0.000263 (0.186) |
0.163 (1.00) |
| 1p gain | 5 (7%) | 67 |
0.929 (1.00) |
0.342 (1.00) |
0.449 (1.00) |
1 (1.00) |
0.32 (1.00) |
0.248 (1.00) |
1 (1.00) |
1 (1.00) |
0.697 (1.00) |
0.943 (1.00) |
||
| 1q gain | 15 (21%) | 57 |
0.895 (1.00) |
0.696 (1.00) |
0.285 (1.00) |
0.332 (1.00) |
1 (1.00) |
0.0941 (1.00) |
0.0795 (1.00) |
1 (1.00) |
0.546 (1.00) |
0.0514 (1.00) |
0.856 (1.00) |
0.563 (1.00) |
| 2p gain | 6 (8%) | 66 |
0.927 (1.00) |
0.34 (1.00) |
0.791 (1.00) |
1 (1.00) |
0.639 (1.00) |
0.0759 (1.00) |
0.674 (1.00) |
1 (1.00) |
0.303 (1.00) |
0.245 (1.00) |
0.433 (1.00) |
0.511 (1.00) |
| 2q gain | 6 (8%) | 66 |
0.927 (1.00) |
0.34 (1.00) |
0.791 (1.00) |
1 (1.00) |
0.639 (1.00) |
0.0759 (1.00) |
0.674 (1.00) |
1 (1.00) |
0.303 (1.00) |
0.245 (1.00) |
0.433 (1.00) |
0.511 (1.00) |
| 3q gain | 8 (11%) | 64 |
0.00325 (1.00) |
0.706 (1.00) |
0.123 (1.00) |
0.171 (1.00) |
0.189 (1.00) |
0.305 (1.00) |
0.26 (1.00) |
1 (1.00) |
0.566 (1.00) |
0.512 (1.00) |
||
| 5p gain | 9 (12%) | 63 |
0.322 (1.00) |
0.00366 (1.00) |
0.862 (1.00) |
1 (1.00) |
0.683 (1.00) |
1 (1.00) |
0.478 (1.00) |
0.63 (1.00) |
0.0379 (1.00) |
0.0395 (1.00) |
0.163 (1.00) |
0.671 (1.00) |
| 5q gain | 5 (7%) | 67 |
0.468 (1.00) |
0.0636 (1.00) |
0.748 (1.00) |
0.41 (1.00) |
0.595 (1.00) |
1 (1.00) |
1 (1.00) |
1 (1.00) |
1 (1.00) |
0.179 (1.00) |
||
| 8p gain | 9 (12%) | 63 |
0.00568 (1.00) |
0.551 (1.00) |
0.582 (1.00) |
0.585 (1.00) |
0.683 (1.00) |
0.815 (1.00) |
1 (1.00) |
1 (1.00) |
0.253 (1.00) |
0.564 (1.00) |
||
| 8q gain | 18 (25%) | 54 |
0.487 (1.00) |
0.995 (1.00) |
0.817 (1.00) |
0.672 (1.00) |
0.367 (1.00) |
0.335 (1.00) |
0.415 (1.00) |
1 (1.00) |
0.551 (1.00) |
0.839 (1.00) |
0.226 (1.00) |
0.595 (1.00) |
| 10p gain | 3 (4%) | 69 |
0.448 (1.00) |
0.838 (1.00) |
0.95 (1.00) |
1 (1.00) |
1 (1.00) |
1 (1.00) |
1 (1.00) |
1 (1.00) |
0.351 (1.00) |
0.836 (1.00) |
||
| 10q gain | 5 (7%) | 67 |
0.429 (1.00) |
0.354 (1.00) |
0.553 (1.00) |
1 (1.00) |
1 (1.00) |
0.179 (1.00) |
0.357 (1.00) |
1 (1.00) |
0.433 (1.00) |
0.92 (1.00) |
||
| 11p gain | 7 (10%) | 65 |
0.856 (1.00) |
0.793 (1.00) |
0.837 (1.00) |
1 (1.00) |
1 (1.00) |
0.213 (1.00) |
0.429 (1.00) |
1 (1.00) |
0.0311 (1.00) |
0.228 (1.00) |
||
| 11q gain | 6 (8%) | 66 |
0.0304 (1.00) |
0.0489 (1.00) |
0.791 (1.00) |
1 (1.00) |
0.639 (1.00) |
0.404 (1.00) |
0.674 (1.00) |
1 (1.00) |
0.433 (1.00) |
0.596 (1.00) |
||
| 12p gain | 7 (10%) | 65 |
0.0598 (1.00) |
0.223 (1.00) |
0.654 (1.00) |
0.527 (1.00) |
0.67 (1.00) |
0.773 (1.00) |
0.107 (1.00) |
0.138 (1.00) |
0.0474 (1.00) |
0.279 (1.00) |
||
| 12q gain | 6 (8%) | 66 |
0.00293 (1.00) |
0.359 (1.00) |
0.718 (1.00) |
1 (1.00) |
0.327 (1.00) |
0.534 (1.00) |
0.199 (1.00) |
0.104 (1.00) |
0.0158 (1.00) |
0.194 (1.00) |
||
| 13q gain | 4 (6%) | 68 |
0.209 (1.00) |
0.992 (1.00) |
0.868 (1.00) |
1 (1.00) |
0.566 (1.00) |
1 (1.00) |
0.614 (1.00) |
0.346 (1.00) |
0.586 (1.00) |
0.888 (1.00) |
||
| 14q gain | 8 (11%) | 64 |
0.731 (1.00) |
0.444 (1.00) |
0.507 (1.00) |
1 (1.00) |
0.67 (1.00) |
0.389 (1.00) |
1 (1.00) |
1 (1.00) |
0.00315 (1.00) |
0.905 (1.00) |
0.113 (1.00) |
0.37 (1.00) |
| 15q gain | 4 (6%) | 68 |
0.0246 (1.00) |
0.119 (1.00) |
0.868 (1.00) |
1 (1.00) |
0.566 (1.00) |
1 (1.00) |
1 (1.00) |
1 (1.00) |
0.657 (1.00) |
0.246 (1.00) |
||
| 16p gain | 7 (10%) | 65 |
0.665 (1.00) |
0.149 (1.00) |
0.612 (1.00) |
0.527 (1.00) |
0.359 (1.00) |
0.358 (1.00) |
0.429 (1.00) |
0.533 (1.00) |
0.000477 (0.338) |
0.513 (1.00) |
0.0129 (1.00) |
0.477 (1.00) |
| 16q gain | 8 (11%) | 64 |
0.606 (1.00) |
0.119 (1.00) |
0.717 (1.00) |
0.578 (1.00) |
0.409 (1.00) |
0.305 (1.00) |
0.71 (1.00) |
0.584 (1.00) |
0.000477 (0.338) |
0.513 (1.00) |
0.0183 (1.00) |
0.675 (1.00) |
| 17q gain | 3 (4%) | 69 |
0.0933 (1.00) |
0.886 (1.00) |
0.95 (1.00) |
1 (1.00) |
1 (1.00) |
0.343 (1.00) |
1 (1.00) |
1 (1.00) |
0.813 (1.00) |
|||
| 18p gain | 8 (11%) | 64 |
0.371 (1.00) |
0.0753 (1.00) |
0.682 (1.00) |
1 (1.00) |
0.409 (1.00) |
0.305 (1.00) |
0.71 (1.00) |
0.175 (1.00) |
0.202 (1.00) |
0.0122 (1.00) |
||
| 19p gain | 3 (4%) | 69 |
0.772 (1.00) |
0.531 (1.00) |
0.927 (1.00) |
1 (1.00) |
0.566 (1.00) |
0.343 (1.00) |
1 (1.00) |
1 (1.00) |
0.134 (1.00) |
|||
| 19q gain | 8 (11%) | 64 |
0.869 (1.00) |
0.948 (1.00) |
0.308 (1.00) |
1 (1.00) |
0.67 (1.00) |
1 (1.00) |
0.71 (1.00) |
1 (1.00) |
0.00292 (1.00) |
0.72 (1.00) |
0.387 (1.00) |
0.128 (1.00) |
| 20p gain | 12 (17%) | 60 |
0.462 (1.00) |
0.0121 (1.00) |
0.402 (1.00) |
0.33 (1.00) |
1 (1.00) |
1 (1.00) |
0.111 (1.00) |
1 (1.00) |
0.157 (1.00) |
0.525 (1.00) |
0.0729 (1.00) |
0.772 (1.00) |
| 20q gain | 13 (18%) | 59 |
0.468 (1.00) |
0.00674 (1.00) |
0.413 (1.00) |
0.602 (1.00) |
1 (1.00) |
0.871 (1.00) |
0.0632 (1.00) |
1 (1.00) |
0.157 (1.00) |
0.525 (1.00) |
0.111 (1.00) |
0.607 (1.00) |
| 22q gain | 4 (6%) | 68 |
0.662 (1.00) |
0.594 (1.00) |
0.968 (1.00) |
1 (1.00) |
1 (1.00) |
1 (1.00) |
0.614 (1.00) |
1 (1.00) |
1 (1.00) |
0.683 (1.00) |
||
| xq gain | 3 (4%) | 69 |
0.0628 (1.00) |
0.0441 (1.00) |
1 (1.00) |
1 (1.00) |
0.627 (1.00) |
1 (1.00) |
1 (1.00) |
0.586 (1.00) |
0.407 (1.00) |
|||
| 1p loss | 11 (15%) | 61 |
0.0961 (1.00) |
0.507 (1.00) |
0.665 (1.00) |
0.585 (1.00) |
1 (1.00) |
0.0345 (1.00) |
0.189 (1.00) |
0.414 (1.00) |
0.297 (1.00) |
0.117 (1.00) |
0.651 (1.00) |
0.239 (1.00) |
| 1q loss | 4 (6%) | 68 |
0.0587 (1.00) |
0.347 (1.00) |
0.968 (1.00) |
1 (1.00) |
1 (1.00) |
0.687 (1.00) |
0.614 (1.00) |
1 (1.00) |
0.657 (1.00) |
0.72 (1.00) |
||
| 2p loss | 6 (8%) | 66 |
0.314 (1.00) |
0.709 (1.00) |
0.946 (1.00) |
1 (1.00) |
1 (1.00) |
0.763 (1.00) |
1 (1.00) |
0.477 (1.00) |
0.0776 (1.00) |
0.446 (1.00) |
||
| 3p loss | 12 (17%) | 60 |
0.843 (1.00) |
0.383 (1.00) |
0.891 (1.00) |
1 (1.00) |
1 (1.00) |
0.731 (1.00) |
0.111 (1.00) |
1 (1.00) |
0.0954 (1.00) |
0.513 (1.00) |
0.0556 (1.00) |
0.175 (1.00) |
| 3q loss | 9 (12%) | 63 |
0.509 (1.00) |
0.842 (1.00) |
0.849 (1.00) |
0.585 (1.00) |
1 (1.00) |
0.815 (1.00) |
0.151 (1.00) |
0.63 (1.00) |
0.000477 (0.338) |
0.513 (1.00) |
0.116 (1.00) |
0.456 (1.00) |
| 4p loss | 10 (14%) | 62 |
0.0952 (1.00) |
0.835 (1.00) |
0.803 (1.00) |
1 (1.00) |
0.683 (1.00) |
0.195 (1.00) |
0.0847 (1.00) |
0.374 (1.00) |
0.952 (1.00) |
0.805 (1.00) |
0.618 (1.00) |
0.988 (1.00) |
| 4q loss | 9 (12%) | 63 |
0.549 (1.00) |
0.685 (1.00) |
0.709 (1.00) |
1 (1.00) |
0.409 (1.00) |
0.521 (1.00) |
0.0278 (1.00) |
0.333 (1.00) |
0.724 (1.00) |
0.805 (1.00) |
0.445 (1.00) |
0.21 (1.00) |
| 5p loss | 3 (4%) | 69 |
0.469 (1.00) |
0.499 (1.00) |
0.927 (1.00) |
1 (1.00) |
0.566 (1.00) |
1 (1.00) |
1 (1.00) |
1 (1.00) |
0.858 (1.00) |
|||
| 5q loss | 7 (10%) | 65 |
0.761 (1.00) |
0.434 (1.00) |
0.637 (1.00) |
1 (1.00) |
0.179 (1.00) |
0.773 (1.00) |
1 (1.00) |
0.533 (1.00) |
0.0014 (0.986) |
0.284 (1.00) |
0.0158 (1.00) |
0.142 (1.00) |
| 6p loss | 24 (33%) | 48 |
0.372 (1.00) |
0.298 (1.00) |
0.606 (1.00) |
0.412 (1.00) |
0.774 (1.00) |
0.221 (1.00) |
0.211 (1.00) |
1 (1.00) |
0.319 (1.00) |
0.622 (1.00) |
0.364 (1.00) |
0.585 (1.00) |
| 6q loss | 30 (42%) | 42 |
0.715 (1.00) |
0.416 (1.00) |
0.62 (1.00) |
0.227 (1.00) |
0.582 (1.00) |
0.0662 (1.00) |
1 (1.00) |
0.372 (1.00) |
0.415 (1.00) |
0.625 (1.00) |
0.461 (1.00) |
0.73 (1.00) |
| 8p loss | 10 (14%) | 62 |
0.977 (1.00) |
0.44 (1.00) |
0.803 (1.00) |
1 (1.00) |
0.683 (1.00) |
0.384 (1.00) |
0.307 (1.00) |
0.214 (1.00) |
0.307 (1.00) |
0.811 (1.00) |
||
| 9p loss | 29 (40%) | 43 |
0.0777 (1.00) |
0.671 (1.00) |
0.118 (1.00) |
0.23 (1.00) |
0.269 (1.00) |
0.285 (1.00) |
1 (1.00) |
0.826 (1.00) |
0.106 (1.00) |
0.0726 (1.00) |
0.355 (1.00) |
0.301 (1.00) |
| 9q loss | 19 (26%) | 53 |
0.0795 (1.00) |
0.966 (1.00) |
0.435 (1.00) |
0.667 (1.00) |
0.762 (1.00) |
0.454 (1.00) |
1 (1.00) |
0.792 (1.00) |
0.232 (1.00) |
0.284 (1.00) |
0.208 (1.00) |
0.514 (1.00) |
| 10p loss | 12 (17%) | 60 |
0.282 (1.00) |
0.172 (1.00) |
0.407 (1.00) |
0.33 (1.00) |
1 (1.00) |
0.137 (1.00) |
0.343 (1.00) |
1 (1.00) |
0.839 (1.00) |
0.483 (1.00) |
0.352 (1.00) |
0.458 (1.00) |
| 10q loss | 11 (15%) | 61 |
0.309 (1.00) |
0.201 (1.00) |
0.826 (1.00) |
1 (1.00) |
0.718 (1.00) |
0.175 (1.00) |
0.514 (1.00) |
1 (1.00) |
0.412 (1.00) |
0.218 (1.00) |
0.307 (1.00) |
0.147 (1.00) |
| 11p loss | 6 (8%) | 66 |
0.794 (1.00) |
0.355 (1.00) |
0.946 (1.00) |
1 (1.00) |
1 (1.00) |
0.404 (1.00) |
1 (1.00) |
1 (1.00) |
0.716 (1.00) |
0.39 (1.00) |
||
| 11q loss | 6 (8%) | 66 |
0.243 (1.00) |
0.886 (1.00) |
0.946 (1.00) |
1 (1.00) |
1 (1.00) |
0.763 (1.00) |
1 (1.00) |
0.477 (1.00) |
0.235 (1.00) |
0.176 (1.00) |
||
| 12p loss | 9 (12%) | 63 |
0.314 (1.00) |
0.394 (1.00) |
0.439 (1.00) |
0.585 (1.00) |
0.409 (1.00) |
0.0817 (1.00) |
0.478 (1.00) |
0.333 (1.00) |
0.0954 (1.00) |
0.806 (1.00) |
0.116 (1.00) |
0.569 (1.00) |
| 12q loss | 10 (14%) | 62 |
0.24 (1.00) |
0.236 (1.00) |
0.803 (1.00) |
1 (1.00) |
0.683 (1.00) |
0.0548 (1.00) |
0.735 (1.00) |
0.374 (1.00) |
0.182 (1.00) |
0.806 (1.00) |
0.195 (1.00) |
0.496 (1.00) |
| 13q loss | 11 (15%) | 61 |
0.851 (1.00) |
0.49 (1.00) |
0.411 (1.00) |
0.585 (1.00) |
0.269 (1.00) |
0.341 (1.00) |
0.514 (1.00) |
0.295 (1.00) |
0.182 (1.00) |
0.851 (1.00) |
0.0729 (1.00) |
0.176 (1.00) |
| 14q loss | 5 (7%) | 67 |
0.977 (1.00) |
0.774 (1.00) |
0.748 (1.00) |
0.41 (1.00) |
1 (1.00) |
1 (1.00) |
1 (1.00) |
0.17 (1.00) |
0.598 (1.00) |
0.71 (1.00) |
0.433 (1.00) |
0.204 (1.00) |
| 15q loss | 10 (14%) | 62 |
0.827 (1.00) |
0.945 (1.00) |
0.509 (1.00) |
1 (1.00) |
0.683 (1.00) |
0.195 (1.00) |
0.307 (1.00) |
0.214 (1.00) |
0.144 (1.00) |
0.668 (1.00) |
0.445 (1.00) |
0.488 (1.00) |
| 17p loss | 27 (38%) | 45 |
0.117 (1.00) |
0.972 (1.00) |
0.276 (1.00) |
0.0405 (1.00) |
0.781 (1.00) |
0.695 (1.00) |
1 (1.00) |
0.344 (1.00) |
0.323 (1.00) |
0.487 (1.00) |
0.00672 (1.00) |
0.506 (1.00) |
| 17q loss | 10 (14%) | 62 |
0.399 (1.00) |
0.976 (1.00) |
0.756 (1.00) |
0.583 (1.00) |
1 (1.00) |
0.473 (1.00) |
0.307 (1.00) |
0.214 (1.00) |
0.0421 (1.00) |
0.12 (1.00) |
||
| 18p loss | 25 (35%) | 47 |
0.831 (1.00) |
0.0708 (1.00) |
0.0997 (1.00) |
0.227 (1.00) |
0.387 (1.00) |
0.489 (1.00) |
1 (1.00) |
1 (1.00) |
0.0723 (1.00) |
0.795 (1.00) |
0.434 (1.00) |
0.468 (1.00) |
| 18q loss | 38 (53%) | 34 |
0.439 (1.00) |
0.988 (1.00) |
0.158 (1.00) |
1 (1.00) |
0.79 (1.00) |
0.162 (1.00) |
0.814 (1.00) |
1 (1.00) |
0.733 (1.00) |
0.0726 (1.00) |
0.0259 (1.00) |
0.802 (1.00) |
| 19p loss | 8 (11%) | 64 |
0.691 (1.00) |
0.83 (1.00) |
0.507 (1.00) |
1 (1.00) |
0.67 (1.00) |
0.389 (1.00) |
0.71 (1.00) |
1 (1.00) |
0.982 (1.00) |
0.0739 (1.00) |
0.253 (1.00) |
0.125 (1.00) |
| 19q loss | 5 (7%) | 67 |
0.876 (1.00) |
0.897 (1.00) |
0.449 (1.00) |
1 (1.00) |
1 (1.00) |
0.179 (1.00) |
1 (1.00) |
1 (1.00) |
0.433 (1.00) |
0.533 (1.00) |
||
| 20p loss | 7 (10%) | 65 |
0.00261 (1.00) |
0.849 (1.00) |
0.637 (1.00) |
0.527 (1.00) |
0.179 (1.00) |
0.773 (1.00) |
1 (1.00) |
0.533 (1.00) |
0.73 (1.00) |
0.113 (1.00) |
0.312 (1.00) |
|
| 21q loss | 24 (33%) | 48 |
0.113 (1.00) |
0.42 (1.00) |
0.29 (1.00) |
0.0871 (1.00) |
0.265 (1.00) |
0.0709 (1.00) |
0.803 (1.00) |
0.845 (1.00) |
0.829 (1.00) |
0.472 (1.00) |
0.0817 (1.00) |
0.0942 (1.00) |
| 22q loss | 14 (19%) | 58 |
0.741 (1.00) |
0.444 (1.00) |
0.496 (1.00) |
0.332 (1.00) |
0.726 (1.00) |
0.184 (1.00) |
0.0346 (1.00) |
0.491 (1.00) |
0.881 (1.00) |
0.453 (1.00) |
0.263 (1.00) |
0.395 (1.00) |
| xq loss | 6 (8%) | 66 |
0.831 (1.00) |
0.866 (1.00) |
0.946 (1.00) |
1 (1.00) |
1 (1.00) |
0.404 (1.00) |
1 (1.00) |
1 (1.00) |
0.759 (1.00) |
0.0597 (1.00) |
0.716 (1.00) |
0.226 (1.00) |
P value = 1.03e-05 (logrank test), Q value = 0.0073
Table S1. Gene #5: '3p gain' versus Clinical Feature #1: 'Time to Death'
| nPatients | nDeath | Duration Range (Median), Month | |
|---|---|---|---|
| ALL | 69 | 29 | 0.0 - 49.4 (7.2) |
| 3P GAIN MUTATED | 5 | 3 | 0.1 - 4.8 (2.5) |
| 3P GAIN WILD-TYPE | 64 | 26 | 0.0 - 49.4 (8.0) |
Figure S1. Get High-res Image Gene #5: '3p gain' versus Clinical Feature #1: 'Time to Death'
P value = 0.000239 (Fisher's exact test), Q value = 0.17
Table S2. Gene #9: '7p gain' versus Clinical Feature #11: 'COMPLETENESS.OF.RESECTION'
| nPatients | R0 | R1 | RX |
|---|---|---|---|
| ALL | 43 | 24 | 2 |
| 7P GAIN MUTATED | 4 | 10 | 2 |
| 7P GAIN WILD-TYPE | 39 | 14 | 0 |
Figure S2. Get High-res Image Gene #9: '7p gain' versus Clinical Feature #11: 'COMPLETENESS.OF.RESECTION'
P value = 0.000263 (Fisher's exact test), Q value = 0.19
Table S3. Gene #10: '7q gain' versus Clinical Feature #11: 'COMPLETENESS.OF.RESECTION'
| nPatients | R0 | R1 | RX |
|---|---|---|---|
| ALL | 43 | 24 | 2 |
| 7Q GAIN MUTATED | 3 | 9 | 2 |
| 7Q GAIN WILD-TYPE | 40 | 15 | 0 |
Figure S3. Get High-res Image Gene #10: '7q gain' versus Clinical Feature #11: 'COMPLETENESS.OF.RESECTION'
-
Copy number data file = transformed.cor.cli.txt
-
Clinical data file = PAAD-TP.merged_data.txt
-
Number of patients = 72
-
Number of significantly arm-level cnvs = 64
-
Number of selected clinical features = 12
-
Exclude regions that fewer than K tumors have mutations, K = 3
For survival clinical features, the Kaplan-Meier survival curves of tumors with and without gene mutations were plotted and the statistical significance P values were estimated by logrank test (Bland and Altman 2004) using the 'survdiff' function in R
For continuous numerical clinical features, two-tailed Student's t test with unequal variance (Lehmann and Romano 2005) was applied to compare the clinical values between tumors with and without gene mutations using 't.test' function in R
For multi-class clinical features (nominal or ordinal), Chi-square tests (Greenwood and Nikulin 1996) were used to estimate the P values using the 'chisq.test' function in R
For binary or multi-class clinical features (nominal or ordinal), two-tailed Fisher's exact tests (Fisher 1922) were used to estimate the P values using the 'fisher.test' function in R
For multiple hypothesis correction, Q value is the False Discovery Rate (FDR) analogue of the P value (Benjamini and Hochberg 1995), defined as the minimum FDR at which the test may be called significant. We used the 'Benjamini and Hochberg' method of 'p.adjust' function in R to convert P values into Q values.
In addition to the links below, the full results of the analysis summarized in this report can also be downloaded programmatically using firehose_get, or interactively from either the Broad GDAC website or TCGA Data Coordination Center Portal.