This pipeline computes the correlation between significantly recurrent gene mutations and selected clinical features.
Testing the association between mutation status of 9 genes and 14 clinical features across 200 patients, 13 significant findings detected with Q value < 0.25.
-
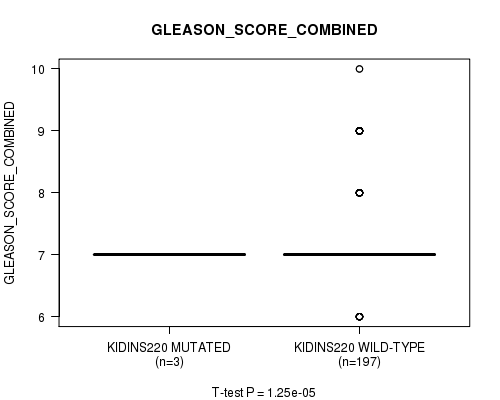
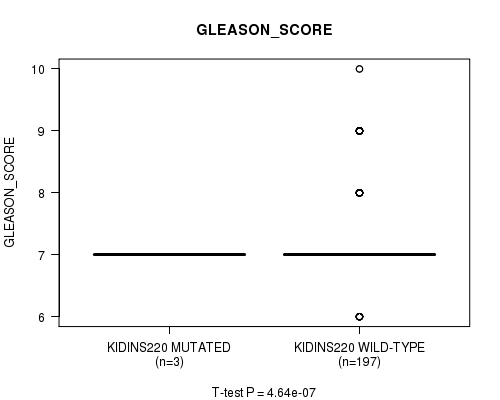
KIDINS220 mutation correlated to 'GLEASON_SCORE_COMBINED' and 'GLEASON_SCORE'.
-
CTNNB1 mutation correlated to 'NUMBER.OF.LYMPH.NODES'.
-
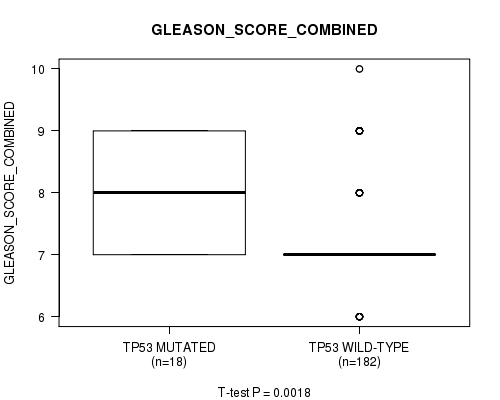
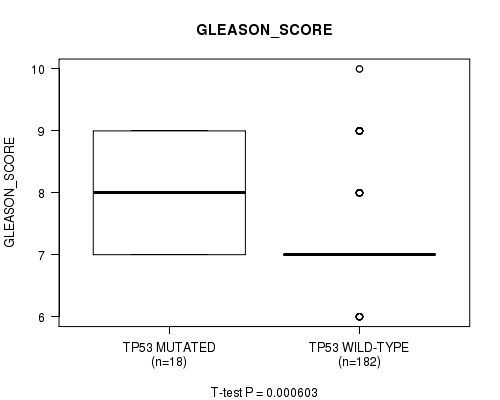
TP53 mutation correlated to 'GLEASON_SCORE_COMBINED' and 'GLEASON_SCORE'.
-
PTEN mutation correlated to 'NUMBER.OF.LYMPH.NODES'.
-
FOXA1 mutation correlated to 'NUMBER.OF.LYMPH.NODES'.
-
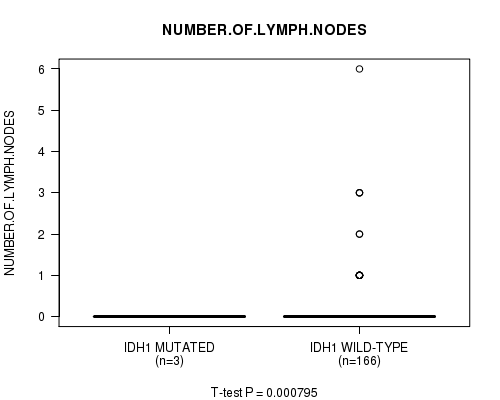
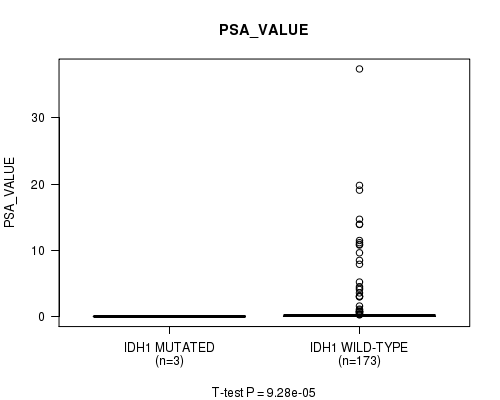
IDH1 mutation correlated to 'NUMBER.OF.LYMPH.NODES' and 'PSA_VALUE'.
-
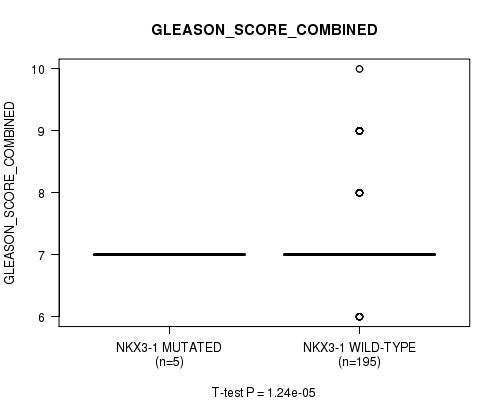
NKX3-1 mutation correlated to 'NUMBER.OF.LYMPH.NODES' and 'GLEASON_SCORE_COMBINED'.
-
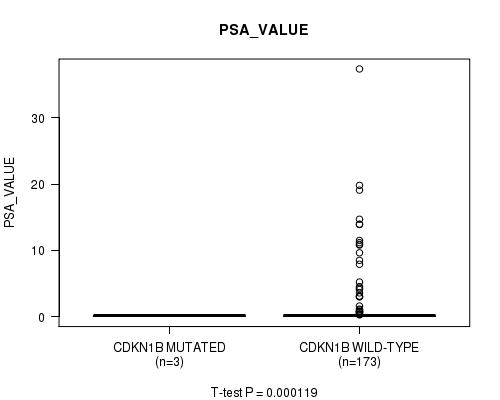
CDKN1B mutation correlated to 'NUMBER.OF.LYMPH.NODES' and 'PSA_VALUE'.
Table 1. Get Full Table Overview of the association between mutation status of 9 genes and 14 clinical features. Shown in the table are P values (Q values). Thresholded by Q value < 0.25, 13 significant findings detected.
|
Clinical Features |
Time to Death |
AGE |
PATHOLOGY T STAGE |
PATHOLOGY N STAGE |
COMPLETENESS OF RESECTION |
NUMBER OF LYMPH NODES |
GLEASON SCORE COMBINED |
GLEASON SCORE PRIMARY |
GLEASON SCORE SECONDARY |
GLEASON SCORE |
PSA RESULT PREOP |
DAYS TO PREOP PSA |
PSA VALUE |
DAYS TO PSA |
||
| nMutated (%) | nWild-Type | logrank test | t-test | Fisher's exact test | Fisher's exact test | Fisher's exact test | t-test | t-test | t-test | t-test | t-test | t-test | t-test | t-test | t-test | |
| KIDINS220 | 3 (2%) | 197 |
100 (1.00) |
0.465 (1.00) |
1 (1.00) |
1 (1.00) |
0.52 (1.00) |
1.25e-05 (0.00151) |
0.611 (1.00) |
0.31 (1.00) |
4.64e-07 (5.71e-05) |
0.947 (1.00) |
0.479 (1.00) |
|||
| TP53 | 18 (9%) | 182 |
100 (1.00) |
0.869 (1.00) |
0.225 (1.00) |
0.395 (1.00) |
1 (1.00) |
0.726 (1.00) |
0.0018 (0.199) |
0.00438 (0.482) |
0.0638 (1.00) |
0.000603 (0.0711) |
0.0941 (1.00) |
0.43 (1.00) |
0.988 (1.00) |
0.0375 (1.00) |
| IDH1 | 3 (2%) | 197 |
100 (1.00) |
0.25 (1.00) |
1 (1.00) |
1 (1.00) |
0.167 (1.00) |
0.000795 (0.0926) |
0.243 (1.00) |
0.45 (1.00) |
0.111 (1.00) |
0.255 (1.00) |
0.155 (1.00) |
0.159 (1.00) |
9.28e-05 (0.0111) |
0.62 (1.00) |
| NKX3-1 | 5 (2%) | 195 |
100 (1.00) |
0.301 (1.00) |
0.279 (1.00) |
1 (1.00) |
0.637 (1.00) |
0.000793 (0.0926) |
1.24e-05 (0.00151) |
0.618 (1.00) |
0.193 (1.00) |
0.062 (1.00) |
0.176 (1.00) |
0.0896 (1.00) |
0.63 (1.00) |
0.257 (1.00) |
| CDKN1B | 3 (2%) | 197 |
100 (1.00) |
0.0641 (1.00) |
0.0742 (1.00) |
1 (1.00) |
0.52 (1.00) |
0.000795 (0.0926) |
0.814 (1.00) |
0.611 (1.00) |
0.774 (1.00) |
0.341 (1.00) |
0.574 (1.00) |
0.106 (1.00) |
0.000119 (0.0141) |
0.733 (1.00) |
| CTNNB1 | 5 (2%) | 195 |
100 (1.00) |
0.832 (1.00) |
0.702 (1.00) |
1 (1.00) |
1 (1.00) |
0.000793 (0.0926) |
0.772 (1.00) |
0.786 (1.00) |
0.508 (1.00) |
0.48 (1.00) |
0.0161 (1.00) |
0.794 (1.00) |
0.541 (1.00) |
0.96 (1.00) |
| PTEN | 9 (4%) | 191 |
100 (1.00) |
0.406 (1.00) |
0.45 (1.00) |
1 (1.00) |
1 (1.00) |
0.000791 (0.0926) |
0.919 (1.00) |
0.426 (1.00) |
0.576 (1.00) |
0.748 (1.00) |
0.862 (1.00) |
0.662 (1.00) |
0.475 (1.00) |
0.0679 (1.00) |
| FOXA1 | 10 (5%) | 190 |
100 (1.00) |
0.48 (1.00) |
0.628 (1.00) |
1 (1.00) |
0.252 (1.00) |
0.000792 (0.0926) |
0.749 (1.00) |
0.858 (1.00) |
0.725 (1.00) |
0.505 (1.00) |
0.0873 (1.00) |
0.305 (1.00) |
0.64 (1.00) |
0.0908 (1.00) |
| SPOP | 17 (8%) | 183 |
100 (1.00) |
0.0146 (1.00) |
0.688 (1.00) |
1 (1.00) |
0.484 (1.00) |
0.572 (1.00) |
0.951 (1.00) |
0.333 (1.00) |
0.375 (1.00) |
0.995 (1.00) |
0.509 (1.00) |
0.373 (1.00) |
0.00824 (0.899) |
0.0867 (1.00) |
P value = 1.25e-05 (t-test), Q value = 0.0015
Table S1. Gene #1: 'KIDINS220 MUTATION STATUS' versus Clinical Feature #7: 'GLEASON_SCORE_COMBINED'
| nPatients | Mean (Std.Dev) | |
|---|---|---|
| ALL | 200 | 7.2 (0.8) |
| KIDINS220 MUTATED | 3 | 7.0 (0.0) |
| KIDINS220 WILD-TYPE | 197 | 7.2 (0.8) |
Figure S1. Get High-res Image Gene #1: 'KIDINS220 MUTATION STATUS' versus Clinical Feature #7: 'GLEASON_SCORE_COMBINED'
P value = 4.64e-07 (t-test), Q value = 5.7e-05
Table S2. Gene #1: 'KIDINS220 MUTATION STATUS' versus Clinical Feature #10: 'GLEASON_SCORE'
| nPatients | Mean (Std.Dev) | |
|---|---|---|
| ALL | 200 | 7.3 (0.8) |
| KIDINS220 MUTATED | 3 | 7.0 (0.0) |
| KIDINS220 WILD-TYPE | 197 | 7.3 (0.8) |
Figure S2. Get High-res Image Gene #1: 'KIDINS220 MUTATION STATUS' versus Clinical Feature #10: 'GLEASON_SCORE'
P value = 0.000793 (t-test), Q value = 0.093
Table S3. Gene #2: 'CTNNB1 MUTATION STATUS' versus Clinical Feature #6: 'NUMBER.OF.LYMPH.NODES'
| nPatients | Mean (Std.Dev) | |
|---|---|---|
| ALL | 169 | 0.2 (0.7) |
| CTNNB1 MUTATED | 5 | 0.0 (0.0) |
| CTNNB1 WILD-TYPE | 164 | 0.2 (0.7) |
Figure S3. Get High-res Image Gene #2: 'CTNNB1 MUTATION STATUS' versus Clinical Feature #6: 'NUMBER.OF.LYMPH.NODES'

P value = 0.0018 (t-test), Q value = 0.2
Table S4. Gene #4: 'TP53 MUTATION STATUS' versus Clinical Feature #7: 'GLEASON_SCORE_COMBINED'
| nPatients | Mean (Std.Dev) | |
|---|---|---|
| ALL | 200 | 7.2 (0.8) |
| TP53 MUTATED | 18 | 7.9 (0.9) |
| TP53 WILD-TYPE | 182 | 7.2 (0.7) |
Figure S4. Get High-res Image Gene #4: 'TP53 MUTATION STATUS' versus Clinical Feature #7: 'GLEASON_SCORE_COMBINED'
P value = 0.000603 (t-test), Q value = 0.071
Table S5. Gene #4: 'TP53 MUTATION STATUS' versus Clinical Feature #10: 'GLEASON_SCORE'
| nPatients | Mean (Std.Dev) | |
|---|---|---|
| ALL | 200 | 7.3 (0.8) |
| TP53 MUTATED | 18 | 8.1 (0.9) |
| TP53 WILD-TYPE | 182 | 7.2 (0.7) |
Figure S5. Get High-res Image Gene #4: 'TP53 MUTATION STATUS' versus Clinical Feature #10: 'GLEASON_SCORE'
P value = 0.000791 (t-test), Q value = 0.093
Table S6. Gene #5: 'PTEN MUTATION STATUS' versus Clinical Feature #6: 'NUMBER.OF.LYMPH.NODES'
| nPatients | Mean (Std.Dev) | |
|---|---|---|
| ALL | 169 | 0.2 (0.7) |
| PTEN MUTATED | 8 | 0.0 (0.0) |
| PTEN WILD-TYPE | 161 | 0.2 (0.7) |
Figure S6. Get High-res Image Gene #5: 'PTEN MUTATION STATUS' versus Clinical Feature #6: 'NUMBER.OF.LYMPH.NODES'

P value = 0.000792 (t-test), Q value = 0.093
Table S7. Gene #6: 'FOXA1 MUTATION STATUS' versus Clinical Feature #6: 'NUMBER.OF.LYMPH.NODES'
| nPatients | Mean (Std.Dev) | |
|---|---|---|
| ALL | 169 | 0.2 (0.7) |
| FOXA1 MUTATED | 7 | 0.0 (0.0) |
| FOXA1 WILD-TYPE | 162 | 0.2 (0.7) |
Figure S7. Get High-res Image Gene #6: 'FOXA1 MUTATION STATUS' versus Clinical Feature #6: 'NUMBER.OF.LYMPH.NODES'

P value = 0.000795 (t-test), Q value = 0.093
Table S8. Gene #7: 'IDH1 MUTATION STATUS' versus Clinical Feature #6: 'NUMBER.OF.LYMPH.NODES'
| nPatients | Mean (Std.Dev) | |
|---|---|---|
| ALL | 169 | 0.2 (0.7) |
| IDH1 MUTATED | 3 | 0.0 (0.0) |
| IDH1 WILD-TYPE | 166 | 0.2 (0.7) |
Figure S8. Get High-res Image Gene #7: 'IDH1 MUTATION STATUS' versus Clinical Feature #6: 'NUMBER.OF.LYMPH.NODES'
P value = 9.28e-05 (t-test), Q value = 0.011
Table S9. Gene #7: 'IDH1 MUTATION STATUS' versus Clinical Feature #13: 'PSA_VALUE'
| nPatients | Mean (Std.Dev) | |
|---|---|---|
| ALL | 176 | 1.4 (4.3) |
| IDH1 MUTATED | 3 | 0.1 (0.0) |
| IDH1 WILD-TYPE | 173 | 1.4 (4.4) |
Figure S9. Get High-res Image Gene #7: 'IDH1 MUTATION STATUS' versus Clinical Feature #13: 'PSA_VALUE'
P value = 0.000793 (t-test), Q value = 0.093
Table S10. Gene #8: 'NKX3-1 MUTATION STATUS' versus Clinical Feature #6: 'NUMBER.OF.LYMPH.NODES'
| nPatients | Mean (Std.Dev) | |
|---|---|---|
| ALL | 169 | 0.2 (0.7) |
| NKX3-1 MUTATED | 5 | 0.0 (0.0) |
| NKX3-1 WILD-TYPE | 164 | 0.2 (0.7) |
Figure S10. Get High-res Image Gene #8: 'NKX3-1 MUTATION STATUS' versus Clinical Feature #6: 'NUMBER.OF.LYMPH.NODES'

P value = 1.24e-05 (t-test), Q value = 0.0015
Table S11. Gene #8: 'NKX3-1 MUTATION STATUS' versus Clinical Feature #7: 'GLEASON_SCORE_COMBINED'
| nPatients | Mean (Std.Dev) | |
|---|---|---|
| ALL | 200 | 7.2 (0.8) |
| NKX3-1 MUTATED | 5 | 7.0 (0.0) |
| NKX3-1 WILD-TYPE | 195 | 7.3 (0.8) |
Figure S11. Get High-res Image Gene #8: 'NKX3-1 MUTATION STATUS' versus Clinical Feature #7: 'GLEASON_SCORE_COMBINED'
P value = 0.000795 (t-test), Q value = 0.093
Table S12. Gene #9: 'CDKN1B MUTATION STATUS' versus Clinical Feature #6: 'NUMBER.OF.LYMPH.NODES'
| nPatients | Mean (Std.Dev) | |
|---|---|---|
| ALL | 169 | 0.2 (0.7) |
| CDKN1B MUTATED | 3 | 0.0 (0.0) |
| CDKN1B WILD-TYPE | 166 | 0.2 (0.7) |
Figure S12. Get High-res Image Gene #9: 'CDKN1B MUTATION STATUS' versus Clinical Feature #6: 'NUMBER.OF.LYMPH.NODES'

P value = 0.000119 (t-test), Q value = 0.014
Table S13. Gene #9: 'CDKN1B MUTATION STATUS' versus Clinical Feature #13: 'PSA_VALUE'
| nPatients | Mean (Std.Dev) | |
|---|---|---|
| ALL | 176 | 1.4 (4.3) |
| CDKN1B MUTATED | 3 | 0.1 (0.0) |
| CDKN1B WILD-TYPE | 173 | 1.4 (4.4) |
Figure S13. Get High-res Image Gene #9: 'CDKN1B MUTATION STATUS' versus Clinical Feature #13: 'PSA_VALUE'
-
Mutation data file = transformed.cor.cli.txt
-
Clinical data file = PRAD-TP.merged_data.txt
-
Number of patients = 200
-
Number of significantly mutated genes = 9
-
Number of selected clinical features = 14
-
Exclude genes that fewer than K tumors have mutations, K = 3
For survival clinical features, the Kaplan-Meier survival curves of tumors with and without gene mutations were plotted and the statistical significance P values were estimated by logrank test (Bland and Altman 2004) using the 'survdiff' function in R
For continuous numerical clinical features, two-tailed Student's t test with unequal variance (Lehmann and Romano 2005) was applied to compare the clinical values between tumors with and without gene mutations using 't.test' function in R
For binary or multi-class clinical features (nominal or ordinal), two-tailed Fisher's exact tests (Fisher 1922) were used to estimate the P values using the 'fisher.test' function in R
For multiple hypothesis correction, Q value is the False Discovery Rate (FDR) analogue of the P value (Benjamini and Hochberg 1995), defined as the minimum FDR at which the test may be called significant. We used the 'Benjamini and Hochberg' method of 'p.adjust' function in R to convert P values into Q values.
In addition to the links below, the full results of the analysis summarized in this report can also be downloaded programmatically using firehose_get, or interactively from either the Broad GDAC website or TCGA Data Coordination Center Portal.