This pipeline computes the correlation between significant arm-level copy number variations (cnvs) and selected clinical features.
Testing the association between copy number variation 80 arm-level events and 3 clinical features across 103 patients, 10 significant findings detected with Q value < 0.25.
-
6p gain cnv correlated to 'AGE'.
-
7p gain cnv correlated to 'AGE'.
-
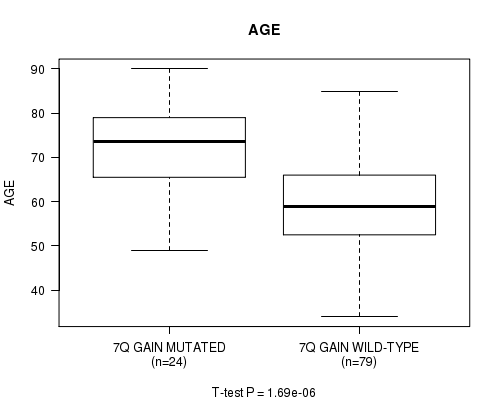
7q gain cnv correlated to 'AGE'.
-
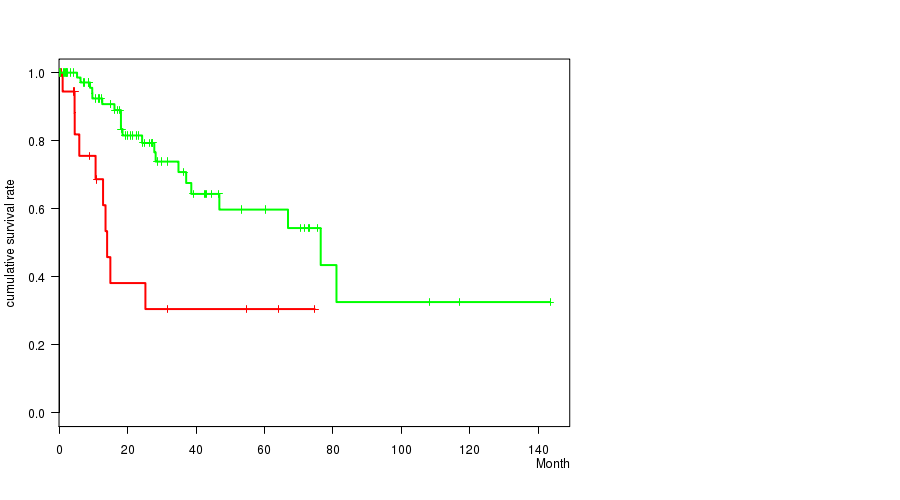
8q gain cnv correlated to 'Time to Death'.
-
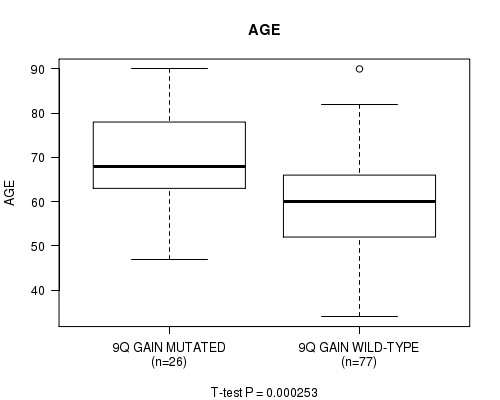
9q gain cnv correlated to 'AGE'.
-
10p gain cnv correlated to 'Time to Death'.
-
10q gain cnv correlated to 'Time to Death'.
-
12p gain cnv correlated to 'Time to Death' and 'AGE'.
-
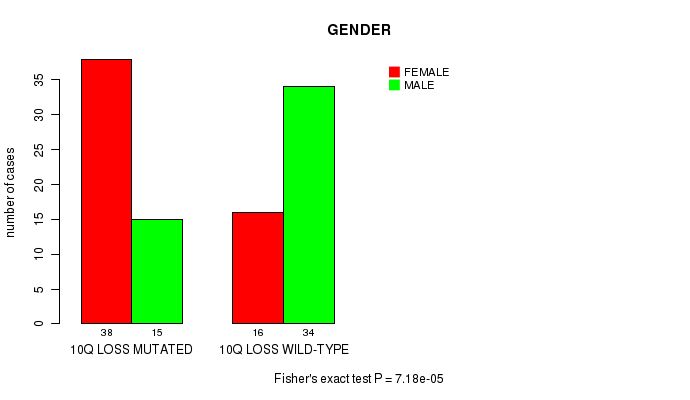
10q loss cnv correlated to 'GENDER'.
Table 1. Get Full Table Overview of the association between significant copy number variation of 80 arm-level events and 3 clinical features. Shown in the table are P values (Q values). Thresholded by Q value < 0.25, 10 significant findings detected.
|
Clinical Features |
Time to Death |
AGE | GENDER | ||
| nCNV (%) | nWild-Type | logrank test | t-test | Fisher's exact test | |
| 12p gain | 11 (11%) | 92 |
3.85e-06 (0.000916) |
0.000183 (0.0428) |
1 (1.00) |
| 6p gain | 18 (17%) | 85 |
0.359 (1.00) |
0.000174 (0.0409) |
0.449 (1.00) |
| 7p gain | 26 (25%) | 77 |
0.338 (1.00) |
2.86e-06 (0.000682) |
0.173 (1.00) |
| 7q gain | 24 (23%) | 79 |
0.516 (1.00) |
1.69e-06 (0.000406) |
0.642 (1.00) |
| 8q gain | 22 (21%) | 81 |
0.000658 (0.152) |
0.186 (1.00) |
0.148 (1.00) |
| 9q gain | 26 (25%) | 77 |
0.625 (1.00) |
0.000253 (0.0589) |
0.651 (1.00) |
| 10p gain | 10 (10%) | 93 |
0.000334 (0.0775) |
0.0855 (1.00) |
0.325 (1.00) |
| 10q gain | 3 (3%) | 100 |
9.56e-05 (0.0226) |
0.579 (1.00) |
0.604 (1.00) |
| 10q loss | 53 (51%) | 50 |
0.275 (1.00) |
0.657 (1.00) |
7.18e-05 (0.017) |
| 1p gain | 17 (17%) | 86 |
0.0675 (1.00) |
0.336 (1.00) |
0.605 (1.00) |
| 1q gain | 20 (19%) | 83 |
0.369 (1.00) |
0.056 (1.00) |
0.469 (1.00) |
| 2p gain | 8 (8%) | 95 |
0.575 (1.00) |
0.081 (1.00) |
0.718 (1.00) |
| 2q gain | 7 (7%) | 96 |
0.499 (1.00) |
0.337 (1.00) |
1 (1.00) |
| 3p gain | 10 (10%) | 93 |
0.805 (1.00) |
0.088 (1.00) |
0.744 (1.00) |
| 3q gain | 9 (9%) | 94 |
0.799 (1.00) |
0.0616 (1.00) |
1 (1.00) |
| 4p gain | 18 (17%) | 85 |
0.668 (1.00) |
0.397 (1.00) |
0.205 (1.00) |
| 4q gain | 14 (14%) | 89 |
0.916 (1.00) |
0.171 (1.00) |
0.779 (1.00) |
| 5p gain | 32 (31%) | 71 |
0.718 (1.00) |
0.0444 (1.00) |
0.397 (1.00) |
| 5q gain | 25 (24%) | 78 |
0.727 (1.00) |
0.0852 (1.00) |
0.0373 (1.00) |
| 6q gain | 19 (18%) | 84 |
0.268 (1.00) |
0.0015 (0.345) |
0.622 (1.00) |
| 8p gain | 20 (19%) | 83 |
0.00673 (1.00) |
0.0899 (1.00) |
0.0882 (1.00) |
| 9p gain | 18 (17%) | 85 |
0.181 (1.00) |
0.0038 (0.859) |
0.801 (1.00) |
| 11p gain | 6 (6%) | 97 |
0.00431 (0.971) |
0.0196 (1.00) |
0.0278 (1.00) |
| 11q gain | 6 (6%) | 97 |
0.133 (1.00) |
0.41 (1.00) |
0.0278 (1.00) |
| 12q gain | 5 (5%) | 98 |
0.134 (1.00) |
0.011 (1.00) |
1 (1.00) |
| 13q gain | 5 (5%) | 98 |
0.295 (1.00) |
0.179 (1.00) |
0.366 (1.00) |
| 14q gain | 18 (17%) | 85 |
0.114 (1.00) |
0.177 (1.00) |
0.801 (1.00) |
| 15q gain | 25 (24%) | 78 |
0.236 (1.00) |
0.0624 (1.00) |
0.107 (1.00) |
| 16p gain | 15 (15%) | 88 |
0.0059 (1.00) |
0.113 (1.00) |
0.585 (1.00) |
| 16q gain | 4 (4%) | 99 |
0.721 (1.00) |
0.697 (1.00) |
1 (1.00) |
| 17p gain | 22 (21%) | 81 |
0.0735 (1.00) |
0.016 (1.00) |
1 (1.00) |
| 17q gain | 18 (17%) | 85 |
0.0733 (1.00) |
0.0318 (1.00) |
0.0206 (1.00) |
| 18p gain | 17 (17%) | 86 |
0.224 (1.00) |
0.0272 (1.00) |
0.3 (1.00) |
| 18q gain | 15 (15%) | 88 |
0.321 (1.00) |
0.0358 (1.00) |
0.0979 (1.00) |
| 19p gain | 29 (28%) | 74 |
0.0124 (1.00) |
0.00293 (0.668) |
0.664 (1.00) |
| 19q gain | 22 (21%) | 81 |
0.501 (1.00) |
0.00892 (1.00) |
1 (1.00) |
| 20p gain | 25 (24%) | 78 |
0.111 (1.00) |
0.0135 (1.00) |
0.819 (1.00) |
| 20q gain | 32 (31%) | 71 |
0.239 (1.00) |
0.0233 (1.00) |
1 (1.00) |
| 21q gain | 20 (19%) | 83 |
0.0345 (1.00) |
0.0241 (1.00) |
1 (1.00) |
| 22q gain | 22 (21%) | 81 |
0.293 (1.00) |
0.0391 (1.00) |
0.0526 (1.00) |
| xq gain | 9 (9%) | 94 |
0.899 (1.00) |
0.132 (1.00) |
1 (1.00) |
| 1p loss | 15 (15%) | 88 |
0.0785 (1.00) |
0.0934 (1.00) |
0.00462 (1.00) |
| 1q loss | 14 (14%) | 89 |
0.873 (1.00) |
0.562 (1.00) |
0.156 (1.00) |
| 2p loss | 28 (27%) | 75 |
0.51 (1.00) |
0.164 (1.00) |
0.184 (1.00) |
| 2q loss | 22 (21%) | 81 |
0.0296 (1.00) |
0.00326 (0.74) |
1 (1.00) |
| 3p loss | 18 (17%) | 85 |
0.0494 (1.00) |
0.357 (1.00) |
1 (1.00) |
| 3q loss | 21 (20%) | 82 |
0.12 (1.00) |
0.321 (1.00) |
1 (1.00) |
| 4p loss | 18 (17%) | 85 |
0.181 (1.00) |
0.635 (1.00) |
0.449 (1.00) |
| 4q loss | 20 (19%) | 83 |
0.968 (1.00) |
0.337 (1.00) |
0.226 (1.00) |
| 5p loss | 8 (8%) | 95 |
0.22 (1.00) |
0.702 (1.00) |
1 (1.00) |
| 5q loss | 13 (13%) | 90 |
0.532 (1.00) |
0.75 (1.00) |
1 (1.00) |
| 6p loss | 25 (24%) | 78 |
0.111 (1.00) |
0.753 (1.00) |
0.491 (1.00) |
| 6q loss | 13 (13%) | 90 |
0.297 (1.00) |
0.204 (1.00) |
0.243 (1.00) |
| 7p loss | 14 (14%) | 89 |
0.551 (1.00) |
0.937 (1.00) |
0.251 (1.00) |
| 7q loss | 13 (13%) | 90 |
0.0601 (1.00) |
0.788 (1.00) |
0.769 (1.00) |
| 8p loss | 20 (19%) | 83 |
0.986 (1.00) |
0.485 (1.00) |
1 (1.00) |
| 8q loss | 14 (14%) | 89 |
0.682 (1.00) |
0.379 (1.00) |
0.156 (1.00) |
| 9p loss | 30 (29%) | 73 |
0.892 (1.00) |
0.0169 (1.00) |
0.388 (1.00) |
| 9q loss | 18 (17%) | 85 |
0.253 (1.00) |
0.0934 (1.00) |
0.801 (1.00) |
| 10p loss | 44 (43%) | 59 |
0.858 (1.00) |
0.0795 (1.00) |
0.00259 (0.594) |
| 11p loss | 39 (38%) | 64 |
0.456 (1.00) |
0.0134 (1.00) |
0.842 (1.00) |
| 11q loss | 32 (31%) | 71 |
0.332 (1.00) |
0.00713 (1.00) |
0.525 (1.00) |
| 12p loss | 22 (21%) | 81 |
0.688 (1.00) |
0.582 (1.00) |
1 (1.00) |
| 12q loss | 23 (22%) | 80 |
0.789 (1.00) |
0.979 (1.00) |
0.236 (1.00) |
| 13q loss | 47 (46%) | 56 |
0.78 (1.00) |
0.0208 (1.00) |
0.113 (1.00) |
| 14q loss | 28 (27%) | 75 |
0.126 (1.00) |
0.776 (1.00) |
0.659 (1.00) |
| 15q loss | 16 (16%) | 87 |
0.0771 (1.00) |
0.347 (1.00) |
0.426 (1.00) |
| 16p loss | 31 (30%) | 72 |
0.79 (1.00) |
0.367 (1.00) |
0.0179 (1.00) |
| 16q loss | 54 (52%) | 49 |
0.327 (1.00) |
0.243 (1.00) |
0.0305 (1.00) |
| 17p loss | 16 (16%) | 87 |
0.822 (1.00) |
0.223 (1.00) |
1 (1.00) |
| 17q loss | 14 (14%) | 89 |
0.705 (1.00) |
0.195 (1.00) |
0.779 (1.00) |
| 18p loss | 23 (22%) | 80 |
0.674 (1.00) |
0.952 (1.00) |
0.00825 (1.00) |
| 18q loss | 25 (24%) | 78 |
0.289 (1.00) |
0.0429 (1.00) |
0.107 (1.00) |
| 19p loss | 6 (6%) | 97 |
0.392 (1.00) |
0.7 (1.00) |
0.208 (1.00) |
| 19q loss | 13 (13%) | 90 |
0.687 (1.00) |
0.322 (1.00) |
0.769 (1.00) |
| 20p loss | 18 (17%) | 85 |
0.893 (1.00) |
0.108 (1.00) |
0.449 (1.00) |
| 20q loss | 8 (8%) | 95 |
0.307 (1.00) |
0.0384 (1.00) |
1 (1.00) |
| 21q loss | 18 (17%) | 85 |
0.0716 (1.00) |
0.0345 (1.00) |
0.449 (1.00) |
| 22q loss | 30 (29%) | 73 |
0.669 (1.00) |
0.339 (1.00) |
0.388 (1.00) |
| xq loss | 41 (40%) | 62 |
0.881 (1.00) |
0.257 (1.00) |
0.0747 (1.00) |
P value = 0.000174 (t-test), Q value = 0.041
Table S1. Gene #11: '6p gain' versus Clinical Feature #2: 'AGE'
| nPatients | Mean (Std.Dev) | |
|---|---|---|
| ALL | 103 | 62.4 (12.9) |
| 6P GAIN MUTATED | 18 | 73.4 (11.7) |
| 6P GAIN WILD-TYPE | 85 | 60.1 (12.0) |
Figure S1. Get High-res Image Gene #11: '6p gain' versus Clinical Feature #2: 'AGE'

P value = 2.86e-06 (t-test), Q value = 0.00068
Table S2. Gene #13: '7p gain' versus Clinical Feature #2: 'AGE'
| nPatients | Mean (Std.Dev) | |
|---|---|---|
| ALL | 103 | 62.4 (12.9) |
| 7P GAIN MUTATED | 26 | 71.8 (9.9) |
| 7P GAIN WILD-TYPE | 77 | 59.2 (12.3) |
Figure S2. Get High-res Image Gene #13: '7p gain' versus Clinical Feature #2: 'AGE'

P value = 1.69e-06 (t-test), Q value = 0.00041
Table S3. Gene #14: '7q gain' versus Clinical Feature #2: 'AGE'
| nPatients | Mean (Std.Dev) | |
|---|---|---|
| ALL | 103 | 62.4 (12.9) |
| 7Q GAIN MUTATED | 24 | 72.5 (9.7) |
| 7Q GAIN WILD-TYPE | 79 | 59.3 (12.2) |
Figure S3. Get High-res Image Gene #14: '7q gain' versus Clinical Feature #2: 'AGE'
P value = 0.000658 (logrank test), Q value = 0.15
Table S4. Gene #16: '8q gain' versus Clinical Feature #1: 'Time to Death'
| nPatients | nDeath | Duration Range (Median), Month | |
|---|---|---|---|
| ALL | 103 | 31 | 0.1 - 143.4 (18.1) |
| 8Q GAIN MUTATED | 22 | 10 | 0.1 - 74.7 (9.8) |
| 8Q GAIN WILD-TYPE | 81 | 21 | 0.1 - 143.4 (21.0) |
Figure S4. Get High-res Image Gene #16: '8q gain' versus Clinical Feature #1: 'Time to Death'
P value = 0.000253 (t-test), Q value = 0.059
Table S5. Gene #18: '9q gain' versus Clinical Feature #2: 'AGE'
| nPatients | Mean (Std.Dev) | |
|---|---|---|
| ALL | 103 | 62.4 (12.9) |
| 9Q GAIN MUTATED | 26 | 69.9 (10.7) |
| 9Q GAIN WILD-TYPE | 77 | 59.9 (12.7) |
Figure S5. Get High-res Image Gene #18: '9q gain' versus Clinical Feature #2: 'AGE'
P value = 0.000334 (logrank test), Q value = 0.078
Table S6. Gene #19: '10p gain' versus Clinical Feature #1: 'Time to Death'
| nPatients | nDeath | Duration Range (Median), Month | |
|---|---|---|---|
| ALL | 103 | 31 | 0.1 - 143.4 (18.1) |
| 10P GAIN MUTATED | 10 | 6 | 0.7 - 42.8 (10.4) |
| 10P GAIN WILD-TYPE | 93 | 25 | 0.1 - 143.4 (19.3) |
Figure S6. Get High-res Image Gene #19: '10p gain' versus Clinical Feature #1: 'Time to Death'

P value = 9.56e-05 (logrank test), Q value = 0.023
Table S7. Gene #20: '10q gain' versus Clinical Feature #1: 'Time to Death'
| nPatients | nDeath | Duration Range (Median), Month | |
|---|---|---|---|
| ALL | 103 | 31 | 0.1 - 143.4 (18.1) |
| 10Q GAIN MUTATED | 3 | 2 | 0.7 - 14.0 (4.5) |
| 10Q GAIN WILD-TYPE | 100 | 29 | 0.1 - 143.4 (18.1) |
Figure S7. Get High-res Image Gene #20: '10q gain' versus Clinical Feature #1: 'Time to Death'

P value = 3.85e-06 (logrank test), Q value = 0.00092
Table S8. Gene #23: '12p gain' versus Clinical Feature #1: 'Time to Death'
| nPatients | nDeath | Duration Range (Median), Month | |
|---|---|---|---|
| ALL | 103 | 31 | 0.1 - 143.4 (18.1) |
| 12P GAIN MUTATED | 11 | 7 | 0.1 - 27.2 (9.0) |
| 12P GAIN WILD-TYPE | 92 | 24 | 0.1 - 143.4 (18.9) |
Figure S8. Get High-res Image Gene #23: '12p gain' versus Clinical Feature #1: 'Time to Death'

P value = 0.000183 (t-test), Q value = 0.043
Table S9. Gene #23: '12p gain' versus Clinical Feature #2: 'AGE'
| nPatients | Mean (Std.Dev) | |
|---|---|---|
| ALL | 103 | 62.4 (12.9) |
| 12P GAIN MUTATED | 11 | 76.3 (9.4) |
| 12P GAIN WILD-TYPE | 92 | 60.8 (12.3) |
Figure S9. Get High-res Image Gene #23: '12p gain' versus Clinical Feature #2: 'AGE'

P value = 7.18e-05 (Fisher's exact test), Q value = 0.017
Table S10. Gene #60: '10q loss' versus Clinical Feature #3: 'GENDER'
| nPatients | FEMALE | MALE |
|---|---|---|
| ALL | 54 | 49 |
| 10Q LOSS MUTATED | 38 | 15 |
| 10Q LOSS WILD-TYPE | 16 | 34 |
Figure S10. Get High-res Image Gene #60: '10q loss' versus Clinical Feature #3: 'GENDER'
-
Copy number data file = transformed.cor.cli.txt
-
Clinical data file = SARC-TP.merged_data.txt
-
Number of patients = 103
-
Number of significantly arm-level cnvs = 80
-
Number of selected clinical features = 3
-
Exclude regions that fewer than K tumors have mutations, K = 3
For survival clinical features, the Kaplan-Meier survival curves of tumors with and without gene mutations were plotted and the statistical significance P values were estimated by logrank test (Bland and Altman 2004) using the 'survdiff' function in R
For continuous numerical clinical features, two-tailed Student's t test with unequal variance (Lehmann and Romano 2005) was applied to compare the clinical values between tumors with and without gene mutations using 't.test' function in R
For binary or multi-class clinical features (nominal or ordinal), two-tailed Fisher's exact tests (Fisher 1922) were used to estimate the P values using the 'fisher.test' function in R
For multiple hypothesis correction, Q value is the False Discovery Rate (FDR) analogue of the P value (Benjamini and Hochberg 1995), defined as the minimum FDR at which the test may be called significant. We used the 'Benjamini and Hochberg' method of 'p.adjust' function in R to convert P values into Q values.
In addition to the links below, the full results of the analysis summarized in this report can also be downloaded programmatically using firehose_get, or interactively from either the Broad GDAC website or TCGA Data Coordination Center Portal.