This pipeline computes the correlation between significant copy number variation (cnv focal) genes and selected clinical features.
Testing the association between copy number variation 58 focal events and 3 clinical features across 103 patients, 4 significant findings detected with Q value < 0.25.
-
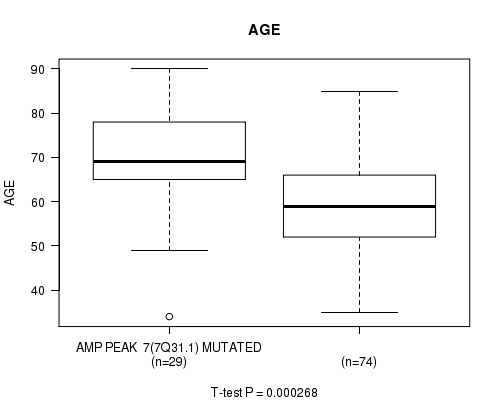
amp_7q31.1 cnv correlated to 'AGE'.
-
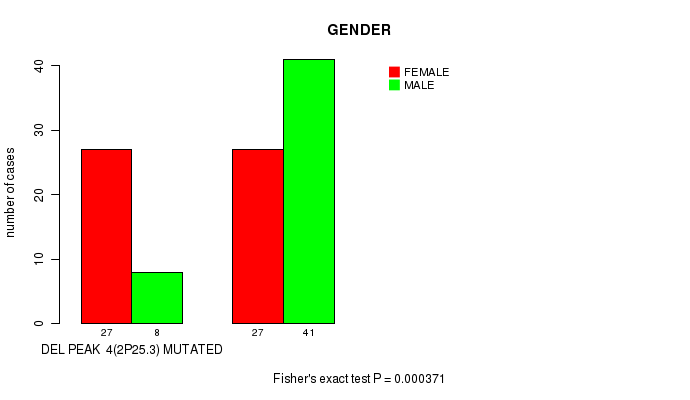
del_2p25.3 cnv correlated to 'GENDER'.
-
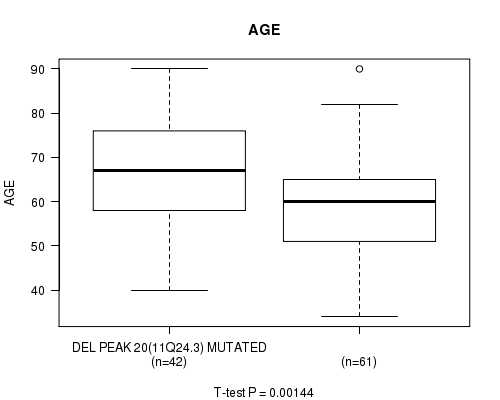
del_11q24.3 cnv correlated to 'AGE'.
-
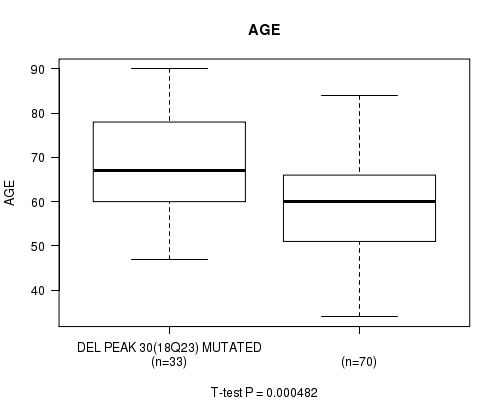
del_18q23 cnv correlated to 'AGE'.
Table 1. Get Full Table Overview of the association between significant copy number variation of 58 focal events and 3 clinical features. Shown in the table are P values (Q values). Thresholded by Q value < 0.25, 4 significant findings detected.
|
Clinical Features |
Time to Death |
AGE | GENDER | ||
| nCNV (%) | nWild-Type | logrank test | t-test | Fisher's exact test | |
| amp 7q31 1 | 29 (28%) | 74 |
0.375 (1.00) |
0.000268 (0.0467) |
0.827 (1.00) |
| del 2p25 3 | 35 (34%) | 68 |
0.762 (1.00) |
0.32 (1.00) |
0.000371 (0.0643) |
| del 11q24 3 | 42 (41%) | 61 |
0.179 (1.00) |
0.00144 (0.247) |
0.694 (1.00) |
| del 18q23 | 33 (32%) | 70 |
0.391 (1.00) |
0.000482 (0.0829) |
0.294 (1.00) |
| amp 1p32 1 | 31 (30%) | 72 |
0.158 (1.00) |
0.24 (1.00) |
0.669 (1.00) |
| amp 1q24 3 | 40 (39%) | 63 |
0.806 (1.00) |
0.51 (1.00) |
0.691 (1.00) |
| amp 3p11 2 | 23 (22%) | 80 |
0.269 (1.00) |
0.00748 (1.00) |
1 (1.00) |
| amp 5p15 33 | 45 (44%) | 58 |
0.0404 (1.00) |
0.00458 (0.761) |
0.427 (1.00) |
| amp 6p21 1 | 22 (21%) | 81 |
0.192 (1.00) |
0.00878 (1.00) |
0.336 (1.00) |
| amp 6q24 3 | 30 (29%) | 73 |
0.645 (1.00) |
0.0381 (1.00) |
0.518 (1.00) |
| amp 8q21 12 | 36 (35%) | 67 |
0.0124 (1.00) |
0.0674 (1.00) |
1 (1.00) |
| amp 11q22 2 | 16 (16%) | 87 |
0.919 (1.00) |
0.56 (1.00) |
1 (1.00) |
| amp 12p13 32 | 19 (18%) | 84 |
0.0659 (1.00) |
0.114 (1.00) |
0.8 (1.00) |
| amp 12q15 | 42 (41%) | 61 |
0.7 (1.00) |
0.176 (1.00) |
0.0176 (1.00) |
| amp 13q34 | 16 (16%) | 87 |
0.358 (1.00) |
0.452 (1.00) |
0.0144 (1.00) |
| amp 17p11 2 | 34 (33%) | 69 |
0.225 (1.00) |
0.144 (1.00) |
0.0957 (1.00) |
| amp 17q24 3 | 25 (24%) | 78 |
0.0276 (1.00) |
0.0358 (1.00) |
0.0105 (1.00) |
| amp 19p13 2 | 34 (33%) | 69 |
0.997 (1.00) |
0.294 (1.00) |
0.53 (1.00) |
| amp 19q12 | 34 (33%) | 69 |
0.14 (1.00) |
0.0287 (1.00) |
0.678 (1.00) |
| amp 20q13 33 | 39 (38%) | 64 |
0.35 (1.00) |
0.0121 (1.00) |
0.416 (1.00) |
| amp 21q21 1 | 26 (25%) | 77 |
0.495 (1.00) |
0.0231 (1.00) |
0.502 (1.00) |
| amp xp21 1 | 31 (30%) | 72 |
0.576 (1.00) |
0.741 (1.00) |
0.0534 (1.00) |
| amp xq21 2 | 14 (14%) | 89 |
0.0802 (1.00) |
0.0712 (1.00) |
1 (1.00) |
| del 1p36 32 | 33 (32%) | 70 |
0.0258 (1.00) |
0.0706 (1.00) |
0.0583 (1.00) |
| del 1p32 3 | 18 (17%) | 85 |
0.0505 (1.00) |
0.763 (1.00) |
0.0206 (1.00) |
| del 1q44 | 27 (26%) | 76 |
0.646 (1.00) |
0.422 (1.00) |
0.503 (1.00) |
| del 2q37 3 | 36 (35%) | 67 |
0.0411 (1.00) |
0.311 (1.00) |
0.22 (1.00) |
| del 2q37 3 | 37 (36%) | 66 |
0.362 (1.00) |
0.106 (1.00) |
0.155 (1.00) |
| del 3p21 31 | 19 (18%) | 84 |
0.217 (1.00) |
0.0678 (1.00) |
0.323 (1.00) |
| del 3q29 | 24 (23%) | 79 |
0.324 (1.00) |
0.224 (1.00) |
1 (1.00) |
| del 4q35 1 | 36 (35%) | 67 |
0.122 (1.00) |
0.107 (1.00) |
0.414 (1.00) |
| del 6p25 1 | 36 (35%) | 67 |
0.863 (1.00) |
0.486 (1.00) |
0.22 (1.00) |
| del 6q14 1 | 23 (22%) | 80 |
0.364 (1.00) |
0.257 (1.00) |
0.813 (1.00) |
| del 7q36 3 | 24 (23%) | 79 |
0.145 (1.00) |
0.782 (1.00) |
0.819 (1.00) |
| del 8p23 3 | 28 (27%) | 75 |
0.945 (1.00) |
0.437 (1.00) |
0.272 (1.00) |
| del 9p24 3 | 39 (38%) | 64 |
0.878 (1.00) |
0.00225 (0.378) |
0.549 (1.00) |
| del 9p21 3 | 45 (44%) | 58 |
0.913 (1.00) |
0.0235 (1.00) |
0.427 (1.00) |
| del 9q34 3 | 21 (20%) | 82 |
0.186 (1.00) |
0.732 (1.00) |
0.463 (1.00) |
| del 10p15 3 | 50 (49%) | 53 |
0.222 (1.00) |
0.191 (1.00) |
0.0762 (1.00) |
| del 10q23 31 | 57 (55%) | 46 |
0.322 (1.00) |
0.699 (1.00) |
0.00157 (0.266) |
| del 11p15 5 | 41 (40%) | 62 |
0.358 (1.00) |
0.00547 (0.903) |
0.554 (1.00) |
| del 12p13 1 | 29 (28%) | 74 |
0.915 (1.00) |
0.348 (1.00) |
0.191 (1.00) |
| del 12q12 | 21 (20%) | 82 |
0.613 (1.00) |
0.786 (1.00) |
1 (1.00) |
| del 13q14 2 | 69 (67%) | 34 |
0.216 (1.00) |
0.0175 (1.00) |
0.0589 (1.00) |
| del 14q24 1 | 35 (34%) | 68 |
0.236 (1.00) |
0.619 (1.00) |
0.537 (1.00) |
| del 15q11 2 | 19 (18%) | 84 |
0.334 (1.00) |
0.0664 (1.00) |
0.0117 (1.00) |
| del 16q12 1 | 57 (55%) | 46 |
0.28 (1.00) |
0.327 (1.00) |
0.0181 (1.00) |
| del 17p13 1 | 42 (41%) | 61 |
0.699 (1.00) |
0.621 (1.00) |
0.0702 (1.00) |
| del 17q11 2 | 24 (23%) | 79 |
0.558 (1.00) |
0.0556 (1.00) |
1 (1.00) |
| del 17q25 3 | 25 (24%) | 78 |
0.4 (1.00) |
0.116 (1.00) |
0.651 (1.00) |
| del 19p13 3 | 28 (27%) | 75 |
0.267 (1.00) |
0.302 (1.00) |
0.00166 (0.28) |
| del 19q13 43 | 37 (36%) | 66 |
0.622 (1.00) |
0.612 (1.00) |
0.0671 (1.00) |
| del 21q11 2 | 19 (18%) | 84 |
0.807 (1.00) |
0.211 (1.00) |
0.622 (1.00) |
| del 21q22 3 | 30 (29%) | 73 |
0.601 (1.00) |
0.00242 (0.405) |
0.666 (1.00) |
| del 22q13 31 | 34 (33%) | 69 |
0.467 (1.00) |
0.408 (1.00) |
0.0957 (1.00) |
| del xp22 32 | 31 (30%) | 72 |
0.256 (1.00) |
0.0413 (1.00) |
0.285 (1.00) |
| del xq21 1 | 52 (50%) | 51 |
0.277 (1.00) |
0.217 (1.00) |
0.0104 (1.00) |
| del xq27 1 | 51 (50%) | 52 |
0.856 (1.00) |
0.93 (1.00) |
0.018 (1.00) |
P value = 0.000268 (t-test), Q value = 0.047
Table S1. Gene #7: 'amp_7q31.1' versus Clinical Feature #2: 'AGE'
| nPatients | Mean (Std.Dev) | |
|---|---|---|
| ALL | 103 | 62.4 (12.9) |
| AMP PEAK 7(7Q31.1) MUTATED | 29 | 69.7 (11.8) |
| AMP PEAK 7(7Q31.1) WILD-TYPE | 74 | 59.5 (12.3) |
Figure S1. Get High-res Image Gene #7: 'amp_7q31.1' versus Clinical Feature #2: 'AGE'
P value = 0.000371 (Fisher's exact test), Q value = 0.064
Table S2. Gene #24: 'del_2p25.3' versus Clinical Feature #3: 'GENDER'
| nPatients | FEMALE | MALE |
|---|---|---|
| ALL | 54 | 49 |
| DEL PEAK 4(2P25.3) MUTATED | 27 | 8 |
| DEL PEAK 4(2P25.3) WILD-TYPE | 27 | 41 |
Figure S2. Get High-res Image Gene #24: 'del_2p25.3' versus Clinical Feature #3: 'GENDER'
P value = 0.00144 (t-test), Q value = 0.25
Table S3. Gene #40: 'del_11q24.3' versus Clinical Feature #2: 'AGE'
| nPatients | Mean (Std.Dev) | |
|---|---|---|
| ALL | 103 | 62.4 (12.9) |
| DEL PEAK 20(11Q24.3) MUTATED | 42 | 67.2 (12.0) |
| DEL PEAK 20(11Q24.3) WILD-TYPE | 61 | 59.1 (12.6) |
Figure S3. Get High-res Image Gene #40: 'del_11q24.3' versus Clinical Feature #2: 'AGE'
P value = 0.000482 (t-test), Q value = 0.083
Table S4. Gene #50: 'del_18q23' versus Clinical Feature #2: 'AGE'
| nPatients | Mean (Std.Dev) | |
|---|---|---|
| ALL | 103 | 62.4 (12.9) |
| DEL PEAK 30(18Q23) MUTATED | 33 | 68.6 (11.3) |
| DEL PEAK 30(18Q23) WILD-TYPE | 70 | 59.5 (12.7) |
Figure S4. Get High-res Image Gene #50: 'del_18q23' versus Clinical Feature #2: 'AGE'
-
Copy number data file = transformed.cor.cli.txt
-
Clinical data file = SARC-TP.merged_data.txt
-
Number of patients = 103
-
Number of significantly focal cnvs = 58
-
Number of selected clinical features = 3
-
Exclude genes that fewer than K tumors have mutations, K = 3
For survival clinical features, the Kaplan-Meier survival curves of tumors with and without gene mutations were plotted and the statistical significance P values were estimated by logrank test (Bland and Altman 2004) using the 'survdiff' function in R
For continuous numerical clinical features, two-tailed Student's t test with unequal variance (Lehmann and Romano 2005) was applied to compare the clinical values between tumors with and without gene mutations using 't.test' function in R
For binary or multi-class clinical features (nominal or ordinal), two-tailed Fisher's exact tests (Fisher 1922) were used to estimate the P values using the 'fisher.test' function in R
For multiple hypothesis correction, Q value is the False Discovery Rate (FDR) analogue of the P value (Benjamini and Hochberg 1995), defined as the minimum FDR at which the test may be called significant. We used the 'Benjamini and Hochberg' method of 'p.adjust' function in R to convert P values into Q values.
In addition to the links below, the full results of the analysis summarized in this report can also be downloaded programmatically using firehose_get, or interactively from either the Broad GDAC website or TCGA Data Coordination Center Portal.