This pipeline computes the correlation between significant arm-level copy number variations (cnvs) and molecular subtypes.
Testing the association between copy number variation 80 arm-level events and 8 molecular subtypes across 150 patients, 18 significant findings detected with P value < 0.05 and Q value < 0.25.
-
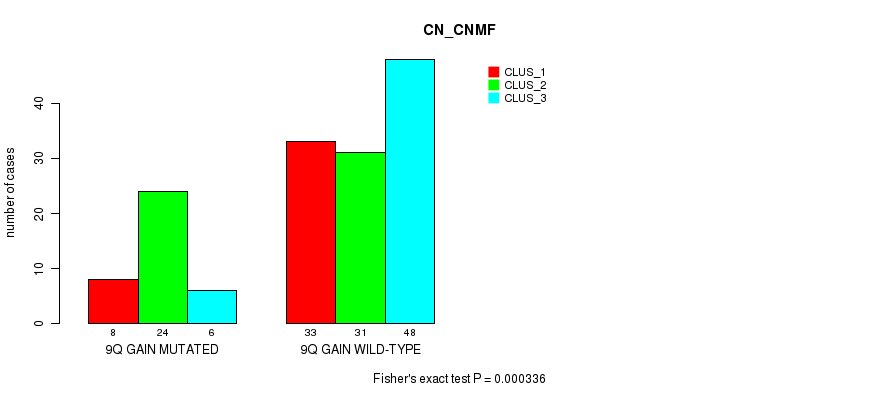
9q gain cnv correlated to 'CN_CNMF'.
-
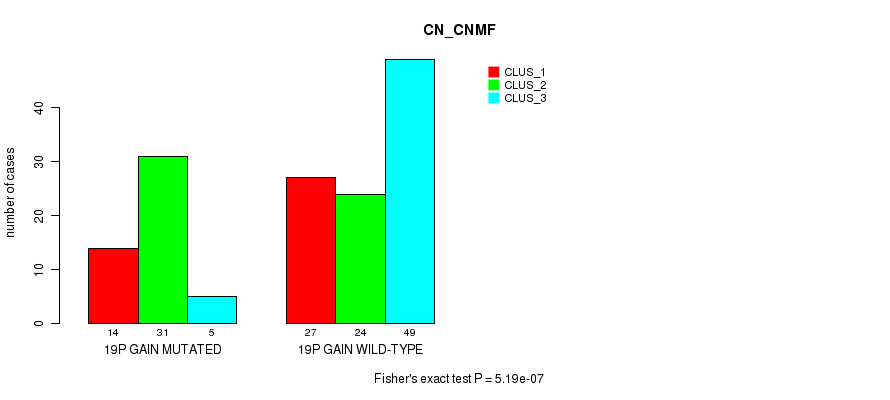
19p gain cnv correlated to 'CN_CNMF'.
-
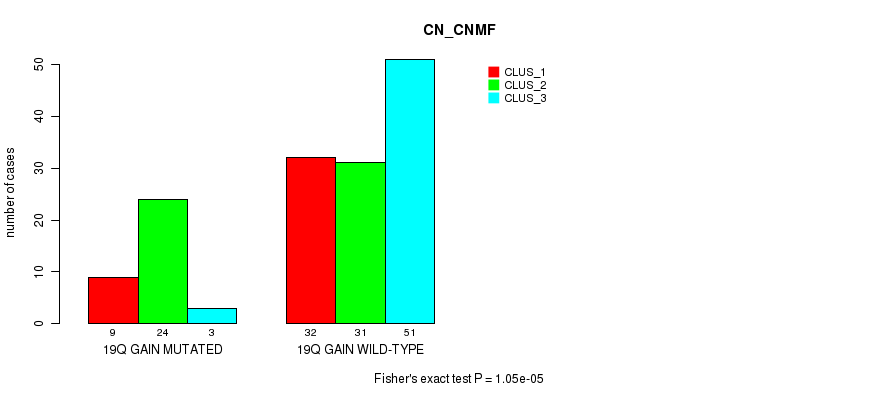
19q gain cnv correlated to 'CN_CNMF'.
-
21q gain cnv correlated to 'CN_CNMF'.
-
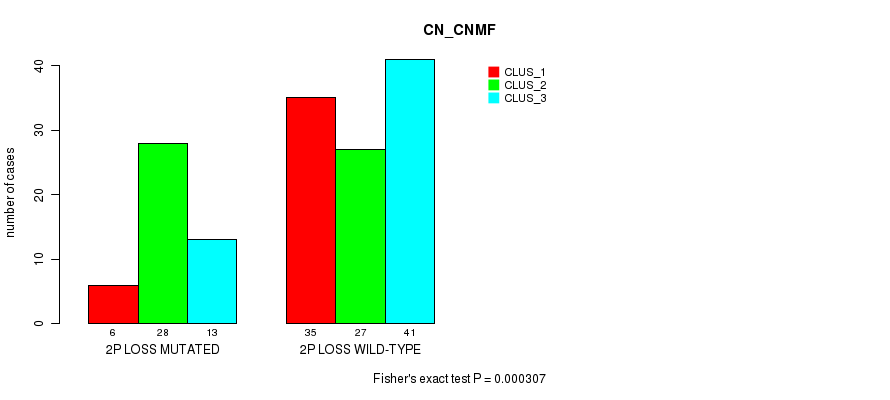
2p loss cnv correlated to 'CN_CNMF', 'METHLYATION_CNMF', and 'MRNASEQ_CNMF'.
-
3p loss cnv correlated to 'METHLYATION_CNMF'.
-
10p loss cnv correlated to 'MRNASEQ_CNMF'.
-
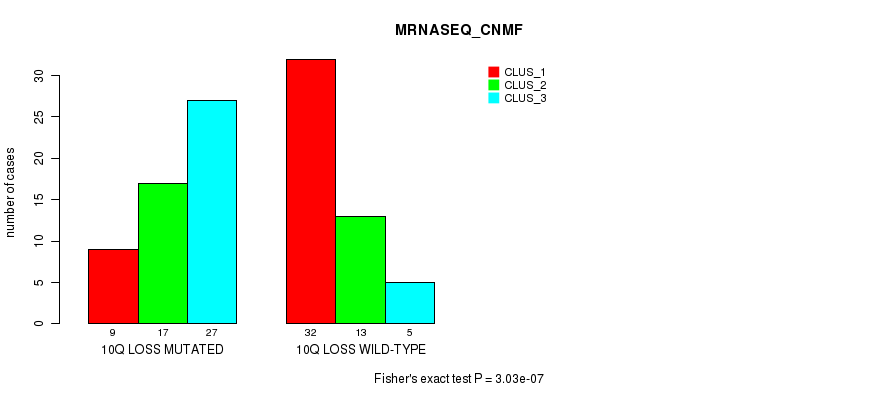
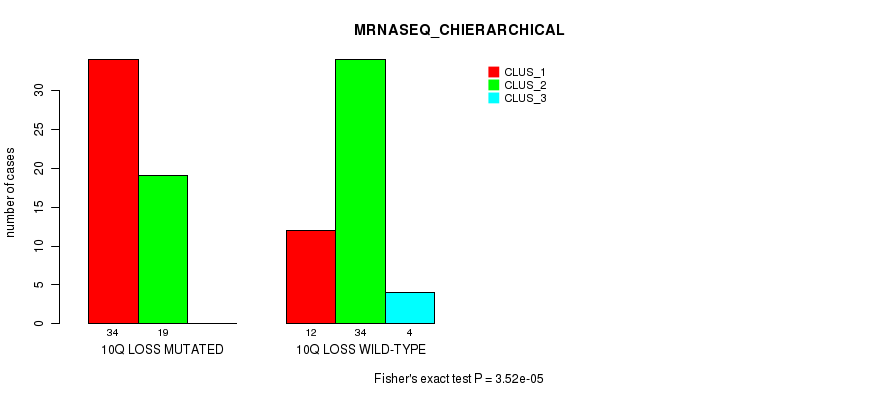
10q loss cnv correlated to 'CN_CNMF', 'METHLYATION_CNMF', 'MRNASEQ_CNMF', and 'MRNASEQ_CHIERARCHICAL'.
-
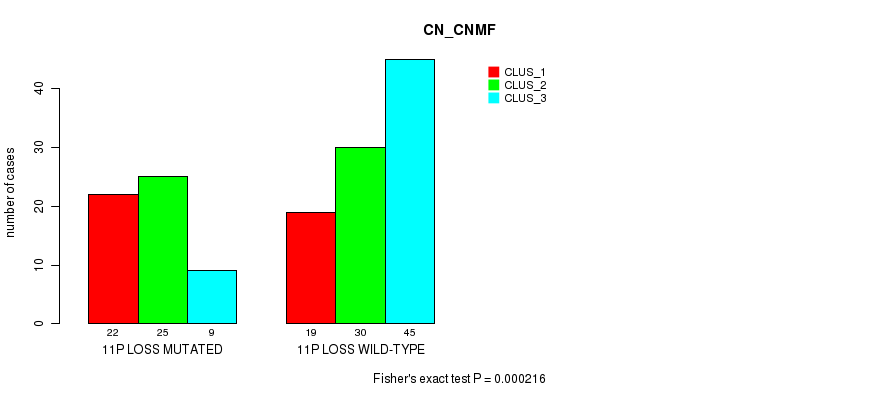
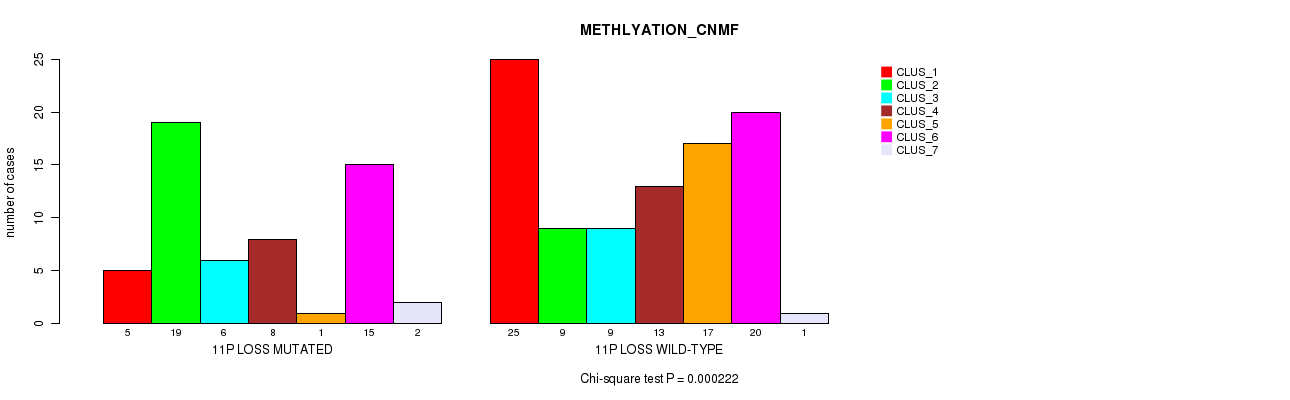
11p loss cnv correlated to 'CN_CNMF' and 'METHLYATION_CNMF'.
-
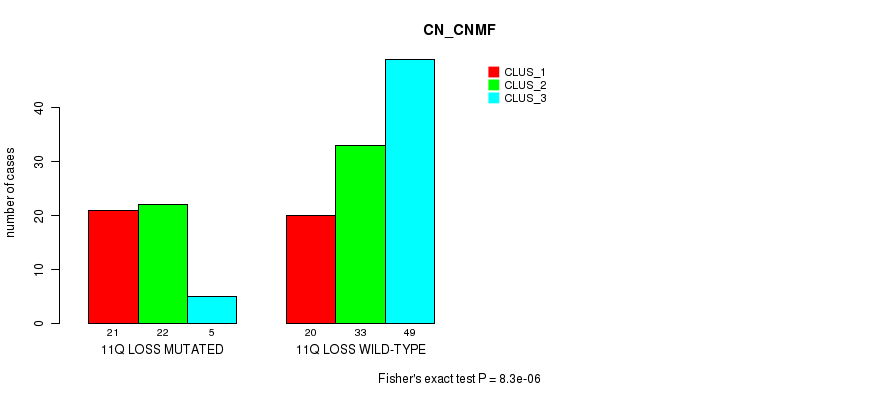
11q loss cnv correlated to 'CN_CNMF'.
-
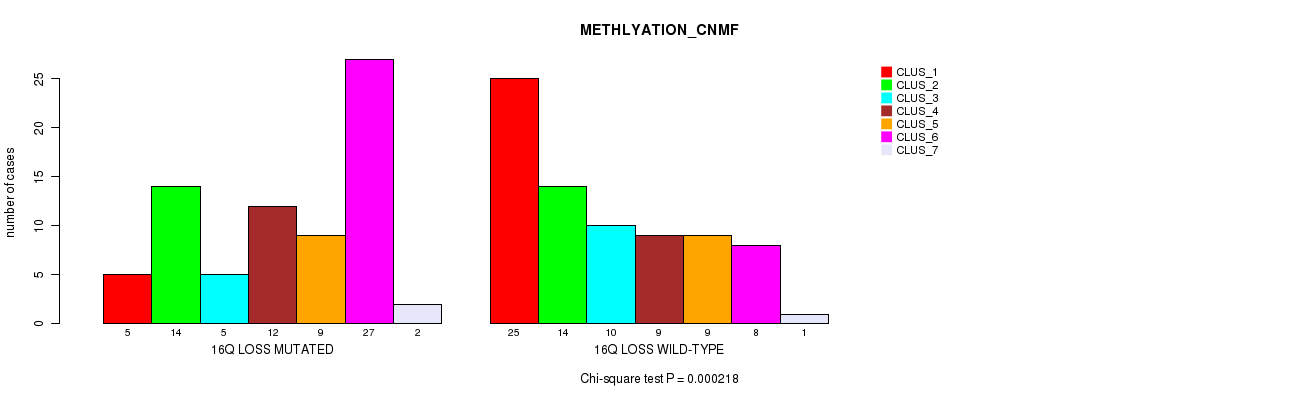
16q loss cnv correlated to 'METHLYATION_CNMF'.
-
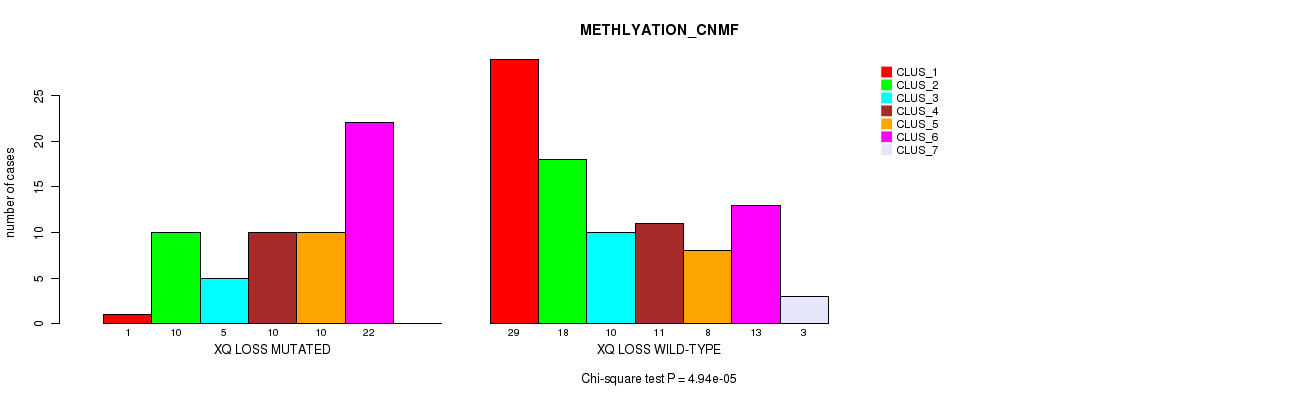
xq loss cnv correlated to 'METHLYATION_CNMF'.
Table 1. Get Full Table Overview of the association between significant copy number variation of 80 arm-level events and 8 molecular subtypes. Shown in the table are P values (Q values). Thresholded by P value < 0.05 and Q value < 0.25, 18 significant findings detected.
|
Clinical Features |
CN CNMF |
METHLYATION CNMF |
MRNASEQ CNMF |
MRNASEQ CHIERARCHICAL |
MIRSEQ CNMF |
MIRSEQ CHIERARCHICAL |
MIRSEQ MATURE CNMF |
MIRSEQ MATURE CHIERARCHICAL |
||
| nCNV (%) | nWild-Type | Fisher's exact test | Chi-square test | Fisher's exact test | Fisher's exact test | Fisher's exact test | Fisher's exact test | Fisher's exact test | Fisher's exact test | |
| 10q loss | 78 (52%) | 72 |
2.62e-07 (0.000167) |
1.72e-07 (0.00011) |
3.03e-07 (0.000193) |
3.52e-05 (0.0223) |
0.00239 (1.00) |
0.000439 (0.272) |
0.00211 (1.00) |
0.000439 (0.272) |
| 2p loss | 47 (31%) | 103 |
0.000307 (0.192) |
5.4e-05 (0.0341) |
0.000292 (0.182) |
0.00109 (0.665) |
0.0223 (1.00) |
0.00159 (0.957) |
0.00884 (1.00) |
0.00159 (0.957) |
| 11p loss | 56 (37%) | 94 |
0.000216 (0.136) |
0.000222 (0.139) |
0.549 (1.00) |
0.144 (1.00) |
0.453 (1.00) |
0.313 (1.00) |
0.541 (1.00) |
0.456 (1.00) |
| 9q gain | 38 (25%) | 112 |
0.000336 (0.21) |
0.0655 (1.00) |
0.274 (1.00) |
0.0925 (1.00) |
0.112 (1.00) |
0.135 (1.00) |
0.0429 (1.00) |
0.135 (1.00) |
| 19p gain | 50 (33%) | 100 |
5.19e-07 (0.00033) |
0.0565 (1.00) |
0.54 (1.00) |
0.212 (1.00) |
0.397 (1.00) |
0.203 (1.00) |
0.32 (1.00) |
0.203 (1.00) |
| 19q gain | 36 (24%) | 114 |
1.05e-05 (0.00669) |
0.00904 (1.00) |
0.432 (1.00) |
0.109 (1.00) |
0.216 (1.00) |
0.127 (1.00) |
0.131 (1.00) |
0.127 (1.00) |
| 21q gain | 39 (26%) | 111 |
0.000246 (0.154) |
0.00542 (1.00) |
0.251 (1.00) |
0.189 (1.00) |
0.542 (1.00) |
0.43 (1.00) |
0.799 (1.00) |
0.43 (1.00) |
| 3p loss | 30 (20%) | 120 |
0.00194 (1.00) |
3.72e-05 (0.0236) |
0.00529 (1.00) |
0.00308 (1.00) |
0.0133 (1.00) |
0.0164 (1.00) |
0.00436 (1.00) |
0.0164 (1.00) |
| 10p loss | 68 (45%) | 82 |
0.0302 (1.00) |
0.00232 (1.00) |
0.000257 (0.161) |
0.0234 (1.00) |
0.275 (1.00) |
0.0619 (1.00) |
0.47 (1.00) |
0.0619 (1.00) |
| 11q loss | 48 (32%) | 102 |
8.3e-06 (0.00528) |
0.00411 (1.00) |
0.632 (1.00) |
0.0648 (1.00) |
0.077 (1.00) |
0.0658 (1.00) |
0.217 (1.00) |
0.183 (1.00) |
| 16q loss | 74 (49%) | 76 |
0.000411 (0.256) |
0.000218 (0.137) |
0.00223 (1.00) |
0.0024 (1.00) |
0.00252 (1.00) |
0.0017 (1.00) |
0.00292 (1.00) |
0.0017 (1.00) |
| xq loss | 58 (39%) | 92 |
0.0864 (1.00) |
4.94e-05 (0.0312) |
0.0623 (1.00) |
0.00496 (1.00) |
0.00753 (1.00) |
0.0013 (0.789) |
0.00102 (0.627) |
0.00426 (1.00) |
| 1p gain | 33 (22%) | 117 |
0.000442 (0.273) |
0.000422 (0.262) |
0.146 (1.00) |
0.671 (1.00) |
0.391 (1.00) |
0.626 (1.00) |
0.772 (1.00) |
0.781 (1.00) |
| 1q gain | 35 (23%) | 115 |
0.00164 (0.985) |
0.0178 (1.00) |
0.0387 (1.00) |
0.0382 (1.00) |
0.415 (1.00) |
0.206 (1.00) |
0.162 (1.00) |
0.116 (1.00) |
| 2p gain | 16 (11%) | 134 |
0.00121 (0.734) |
0.00344 (1.00) |
0.174 (1.00) |
0.079 (1.00) |
0.00345 (1.00) |
0.0208 (1.00) |
0.00598 (1.00) |
0.0208 (1.00) |
| 2q gain | 13 (9%) | 137 |
0.0107 (1.00) |
0.096 (1.00) |
0.484 (1.00) |
0.205 (1.00) |
0.0288 (1.00) |
0.0634 (1.00) |
0.038 (1.00) |
0.0634 (1.00) |
| 3p gain | 16 (11%) | 134 |
0.0748 (1.00) |
0.0213 (1.00) |
0.0608 (1.00) |
0.146 (1.00) |
0.878 (1.00) |
0.677 (1.00) |
0.512 (1.00) |
0.444 (1.00) |
| 3q gain | 15 (10%) | 135 |
0.123 (1.00) |
0.0834 (1.00) |
0.0943 (1.00) |
0.38 (1.00) |
1 (1.00) |
1 (1.00) |
0.566 (1.00) |
0.547 (1.00) |
| 4p gain | 34 (23%) | 116 |
0.00348 (1.00) |
0.00155 (0.932) |
0.67 (1.00) |
0.858 (1.00) |
0.0285 (1.00) |
0.0807 (1.00) |
0.0381 (1.00) |
0.0182 (1.00) |
| 4q gain | 27 (18%) | 123 |
0.199 (1.00) |
0.0744 (1.00) |
0.863 (1.00) |
1 (1.00) |
0.257 (1.00) |
0.513 (1.00) |
0.0889 (1.00) |
0.247 (1.00) |
| 5p gain | 52 (35%) | 98 |
0.000469 (0.289) |
0.011 (1.00) |
0.0695 (1.00) |
1 (1.00) |
0.782 (1.00) |
0.52 (1.00) |
0.29 (1.00) |
0.695 (1.00) |
| 5q gain | 43 (29%) | 107 |
0.00313 (1.00) |
0.0288 (1.00) |
0.427 (1.00) |
1 (1.00) |
0.299 (1.00) |
1 (1.00) |
0.0593 (1.00) |
0.85 (1.00) |
| 6p gain | 33 (22%) | 117 |
0.000449 (0.277) |
0.00108 (0.657) |
0.0149 (1.00) |
0.00577 (1.00) |
0.0141 (1.00) |
0.00778 (1.00) |
0.00344 (1.00) |
0.031 (1.00) |
| 6q gain | 31 (21%) | 119 |
0.00685 (1.00) |
0.00085 (0.521) |
0.0233 (1.00) |
0.00879 (1.00) |
0.00718 (1.00) |
0.00529 (1.00) |
0.0016 (0.96) |
0.0229 (1.00) |
| 7p gain | 46 (31%) | 104 |
0.0022 (1.00) |
0.0298 (1.00) |
0.0727 (1.00) |
0.353 (1.00) |
0.283 (1.00) |
0.18 (1.00) |
0.0957 (1.00) |
0.267 (1.00) |
| 7q gain | 38 (25%) | 112 |
0.00178 (1.00) |
0.125 (1.00) |
0.554 (1.00) |
0.189 (1.00) |
0.29 (1.00) |
0.135 (1.00) |
0.0878 (1.00) |
0.211 (1.00) |
| 8p gain | 34 (23%) | 116 |
0.0103 (1.00) |
0.514 (1.00) |
0.336 (1.00) |
1 (1.00) |
1 (1.00) |
0.812 (1.00) |
0.549 (1.00) |
0.812 (1.00) |
| 8q gain | 39 (26%) | 111 |
0.0392 (1.00) |
0.0241 (1.00) |
0.0357 (1.00) |
0.79 (1.00) |
0.974 (1.00) |
0.422 (1.00) |
0.824 (1.00) |
0.422 (1.00) |
| 9p gain | 30 (20%) | 120 |
0.0034 (1.00) |
0.062 (1.00) |
0.23 (1.00) |
0.249 (1.00) |
0.112 (1.00) |
0.108 (1.00) |
0.163 (1.00) |
0.108 (1.00) |
| 10p gain | 13 (9%) | 137 |
0.0612 (1.00) |
0.0146 (1.00) |
0.827 (1.00) |
0.427 (1.00) |
0.784 (1.00) |
0.689 (1.00) |
0.525 (1.00) |
0.689 (1.00) |
| 10q gain | 5 (3%) | 145 |
0.853 (1.00) |
0.0111 (1.00) |
0.629 (1.00) |
0.113 (1.00) |
0.8 (1.00) |
1 (1.00) |
0.209 (1.00) |
1 (1.00) |
| 11p gain | 14 (9%) | 136 |
0.11 (1.00) |
0.357 (1.00) |
0.15 (1.00) |
1 (1.00) |
0.618 (1.00) |
0.598 (1.00) |
0.288 (1.00) |
0.598 (1.00) |
| 11q gain | 13 (9%) | 137 |
0.667 (1.00) |
0.337 (1.00) |
0.228 (1.00) |
0.616 (1.00) |
0.875 (1.00) |
1 (1.00) |
0.873 (1.00) |
1 (1.00) |
| 12p gain | 20 (13%) | 130 |
0.502 (1.00) |
0.042 (1.00) |
0.703 (1.00) |
0.165 (1.00) |
0.405 (1.00) |
0.382 (1.00) |
0.493 (1.00) |
0.382 (1.00) |
| 12q gain | 14 (9%) | 136 |
0.599 (1.00) |
0.358 (1.00) |
0.384 (1.00) |
0.799 (1.00) |
0.269 (1.00) |
0.263 (1.00) |
0.323 (1.00) |
0.263 (1.00) |
| 13q gain | 7 (5%) | 143 |
0.262 (1.00) |
0.0521 (1.00) |
0.0419 (1.00) |
0.0266 (1.00) |
0.621 (1.00) |
0.16 (1.00) |
0.528 (1.00) |
0.453 (1.00) |
| 14q gain | 31 (21%) | 119 |
0.279 (1.00) |
0.0875 (1.00) |
0.219 (1.00) |
0.543 (1.00) |
0.273 (1.00) |
0.118 (1.00) |
0.395 (1.00) |
0.118 (1.00) |
| 15q gain | 39 (26%) | 111 |
0.0818 (1.00) |
0.00327 (1.00) |
0.000575 (0.353) |
0.0061 (1.00) |
0.335 (1.00) |
0.798 (1.00) |
0.482 (1.00) |
0.798 (1.00) |
| 16p gain | 25 (17%) | 125 |
0.0151 (1.00) |
0.0286 (1.00) |
1 (1.00) |
1 (1.00) |
0.57 (1.00) |
1 (1.00) |
0.728 (1.00) |
1 (1.00) |
| 16q gain | 10 (7%) | 140 |
0.138 (1.00) |
0.0757 (1.00) |
0.861 (1.00) |
0.484 (1.00) |
0.0598 (1.00) |
0.576 (1.00) |
0.0929 (1.00) |
0.576 (1.00) |
| 17p gain | 37 (25%) | 113 |
0.014 (1.00) |
0.018 (1.00) |
0.513 (1.00) |
0.444 (1.00) |
0.0386 (1.00) |
0.00887 (1.00) |
0.0837 (1.00) |
0.00887 (1.00) |
| 17q gain | 34 (23%) | 116 |
0.2 (1.00) |
0.0541 (1.00) |
0.173 (1.00) |
0.616 (1.00) |
0.0128 (1.00) |
0.00173 (1.00) |
0.0385 (1.00) |
0.00173 (1.00) |
| 18p gain | 26 (17%) | 124 |
0.0175 (1.00) |
0.0146 (1.00) |
0.952 (1.00) |
0.748 (1.00) |
0.618 (1.00) |
1 (1.00) |
0.933 (1.00) |
0.674 (1.00) |
| 18q gain | 22 (15%) | 128 |
0.393 (1.00) |
0.102 (1.00) |
0.631 (1.00) |
1 (1.00) |
0.693 (1.00) |
1 (1.00) |
0.76 (1.00) |
0.802 (1.00) |
| 20p gain | 41 (27%) | 109 |
0.0667 (1.00) |
0.166 (1.00) |
0.732 (1.00) |
0.539 (1.00) |
0.547 (1.00) |
0.699 (1.00) |
0.287 (1.00) |
0.699 (1.00) |
| 20q gain | 52 (35%) | 98 |
0.00567 (1.00) |
0.047 (1.00) |
1 (1.00) |
0.212 (1.00) |
0.151 (1.00) |
0.226 (1.00) |
0.145 (1.00) |
0.226 (1.00) |
| 22q gain | 37 (25%) | 113 |
0.0778 (1.00) |
0.195 (1.00) |
0.428 (1.00) |
0.392 (1.00) |
0.851 (1.00) |
0.547 (1.00) |
0.924 (1.00) |
0.547 (1.00) |
| xq gain | 19 (13%) | 131 |
0.0251 (1.00) |
0.0488 (1.00) |
1 (1.00) |
1 (1.00) |
0.304 (1.00) |
0.336 (1.00) |
0.337 (1.00) |
0.484 (1.00) |
| 1p loss | 22 (15%) | 128 |
0.919 (1.00) |
0.151 (1.00) |
0.113 (1.00) |
0.76 (1.00) |
0.68 (1.00) |
0.0219 (1.00) |
0.799 (1.00) |
0.0219 (1.00) |
| 1q loss | 20 (13%) | 130 |
0.235 (1.00) |
0.152 (1.00) |
0.683 (1.00) |
0.818 (1.00) |
0.521 (1.00) |
0.537 (1.00) |
0.23 (1.00) |
0.537 (1.00) |
| 2q loss | 40 (27%) | 110 |
0.00054 (0.332) |
0.0443 (1.00) |
0.709 (1.00) |
0.721 (1.00) |
0.883 (1.00) |
1 (1.00) |
1 (1.00) |
1 (1.00) |
| 3q loss | 34 (23%) | 116 |
0.00171 (1.00) |
0.00219 (1.00) |
0.0103 (1.00) |
0.00252 (1.00) |
0.0247 (1.00) |
0.00974 (1.00) |
0.0138 (1.00) |
0.00974 (1.00) |
| 4p loss | 25 (17%) | 125 |
0.329 (1.00) |
0.00513 (1.00) |
0.113 (1.00) |
0.486 (1.00) |
0.227 (1.00) |
0.166 (1.00) |
0.206 (1.00) |
0.166 (1.00) |
| 4q loss | 27 (18%) | 123 |
0.0123 (1.00) |
0.00171 (1.00) |
0.0779 (1.00) |
0.855 (1.00) |
0.563 (1.00) |
0.178 (1.00) |
0.51 (1.00) |
0.178 (1.00) |
| 5p loss | 14 (9%) | 136 |
0.514 (1.00) |
0.438 (1.00) |
0.207 (1.00) |
0.332 (1.00) |
0.122 (1.00) |
0.043 (1.00) |
0.146 (1.00) |
0.043 (1.00) |
| 5q loss | 18 (12%) | 132 |
0.155 (1.00) |
0.389 (1.00) |
0.102 (1.00) |
0.383 (1.00) |
0.335 (1.00) |
0.0886 (1.00) |
0.39 (1.00) |
0.0886 (1.00) |
| 6p loss | 35 (23%) | 115 |
0.471 (1.00) |
0.6 (1.00) |
0.0799 (1.00) |
0.0516 (1.00) |
0.715 (1.00) |
0.335 (1.00) |
0.647 (1.00) |
0.335 (1.00) |
| 6q loss | 25 (17%) | 125 |
0.195 (1.00) |
0.0467 (1.00) |
0.0411 (1.00) |
0.175 (1.00) |
0.217 (1.00) |
0.431 (1.00) |
0.236 (1.00) |
0.431 (1.00) |
| 7p loss | 23 (15%) | 127 |
0.106 (1.00) |
0.00108 (0.66) |
0.057 (1.00) |
0.298 (1.00) |
0.631 (1.00) |
0.568 (1.00) |
0.319 (1.00) |
0.568 (1.00) |
| 7q loss | 19 (13%) | 131 |
0.641 (1.00) |
0.229 (1.00) |
0.135 (1.00) |
0.391 (1.00) |
0.475 (1.00) |
0.558 (1.00) |
0.475 (1.00) |
0.558 (1.00) |
| 8p loss | 31 (21%) | 119 |
0.392 (1.00) |
0.0242 (1.00) |
0.245 (1.00) |
0.357 (1.00) |
0.108 (1.00) |
0.00629 (1.00) |
0.0579 (1.00) |
0.00228 (1.00) |
| 8q loss | 21 (14%) | 129 |
0.101 (1.00) |
0.399 (1.00) |
0.73 (1.00) |
0.78 (1.00) |
0.277 (1.00) |
0.474 (1.00) |
0.187 (1.00) |
0.269 (1.00) |
| 9p loss | 47 (31%) | 103 |
0.00326 (1.00) |
0.0115 (1.00) |
0.876 (1.00) |
0.0984 (1.00) |
0.511 (1.00) |
0.204 (1.00) |
0.473 (1.00) |
0.3 (1.00) |
| 9q loss | 31 (21%) | 119 |
0.0678 (1.00) |
0.018 (1.00) |
0.432 (1.00) |
0.379 (1.00) |
0.595 (1.00) |
0.547 (1.00) |
0.836 (1.00) |
0.682 (1.00) |
| 12p loss | 40 (27%) | 110 |
0.00113 (0.684) |
0.0215 (1.00) |
0.441 (1.00) |
0.634 (1.00) |
0.693 (1.00) |
0.886 (1.00) |
0.58 (1.00) |
0.75 (1.00) |
| 12q loss | 33 (22%) | 117 |
0.00873 (1.00) |
0.403 (1.00) |
0.943 (1.00) |
0.772 (1.00) |
0.866 (1.00) |
1 (1.00) |
0.755 (1.00) |
0.878 (1.00) |
| 13q loss | 75 (50%) | 75 |
0.00309 (1.00) |
0.00106 (0.648) |
0.698 (1.00) |
0.125 (1.00) |
0.252 (1.00) |
0.0991 (1.00) |
0.249 (1.00) |
0.214 (1.00) |
| 14q loss | 44 (29%) | 106 |
0.488 (1.00) |
0.00559 (1.00) |
0.00683 (1.00) |
0.367 (1.00) |
0.836 (1.00) |
0.289 (1.00) |
0.479 (1.00) |
0.455 (1.00) |
| 15q loss | 25 (17%) | 125 |
0.395 (1.00) |
0.0451 (1.00) |
0.0199 (1.00) |
0.0668 (1.00) |
0.215 (1.00) |
0.151 (1.00) |
0.198 (1.00) |
0.0831 (1.00) |
| 16p loss | 42 (28%) | 108 |
0.00152 (0.916) |
0.0664 (1.00) |
0.375 (1.00) |
0.353 (1.00) |
0.395 (1.00) |
0.0856 (1.00) |
0.627 (1.00) |
0.056 (1.00) |
| 17p loss | 29 (19%) | 121 |
0.819 (1.00) |
0.111 (1.00) |
0.317 (1.00) |
0.732 (1.00) |
0.668 (1.00) |
0.352 (1.00) |
0.607 (1.00) |
0.234 (1.00) |
| 17q loss | 27 (18%) | 123 |
0.0805 (1.00) |
0.0314 (1.00) |
0.00427 (1.00) |
0.11 (1.00) |
0.395 (1.00) |
0.506 (1.00) |
0.657 (1.00) |
0.241 (1.00) |
| 18p loss | 36 (24%) | 114 |
0.224 (1.00) |
0.317 (1.00) |
0.268 (1.00) |
0.611 (1.00) |
0.828 (1.00) |
0.547 (1.00) |
0.775 (1.00) |
0.41 (1.00) |
| 18q loss | 38 (25%) | 112 |
0.0999 (1.00) |
0.0424 (1.00) |
0.835 (1.00) |
0.599 (1.00) |
0.802 (1.00) |
0.471 (1.00) |
0.653 (1.00) |
0.66 (1.00) |
| 19p loss | 11 (7%) | 139 |
0.0887 (1.00) |
0.0321 (1.00) |
0.484 (1.00) |
1 (1.00) |
0.234 (1.00) |
0.79 (1.00) |
0.244 (1.00) |
0.79 (1.00) |
| 19q loss | 22 (15%) | 128 |
0.299 (1.00) |
0.141 (1.00) |
0.724 (1.00) |
0.543 (1.00) |
0.0671 (1.00) |
1 (1.00) |
0.078 (1.00) |
1 (1.00) |
| 20p loss | 25 (17%) | 125 |
0.724 (1.00) |
0.0261 (1.00) |
0.234 (1.00) |
0.858 (1.00) |
0.596 (1.00) |
1 (1.00) |
0.65 (1.00) |
0.752 (1.00) |
| 20q loss | 10 (7%) | 140 |
0.268 (1.00) |
0.0398 (1.00) |
0.275 (1.00) |
0.653 (1.00) |
0.264 (1.00) |
0.576 (1.00) |
0.296 (1.00) |
0.292 (1.00) |
| 21q loss | 26 (17%) | 124 |
0.0326 (1.00) |
0.199 (1.00) |
0.519 (1.00) |
0.465 (1.00) |
0.177 (1.00) |
0.513 (1.00) |
0.216 (1.00) |
0.513 (1.00) |
| 22q loss | 43 (29%) | 107 |
0.0106 (1.00) |
0.0953 (1.00) |
0.0312 (1.00) |
0.27 (1.00) |
0.422 (1.00) |
0.676 (1.00) |
0.369 (1.00) |
0.676 (1.00) |
P value = 0.000336 (Fisher's exact test), Q value = 0.21
Table S1. Gene #18: '9q gain' versus Molecular Subtype #1: 'CN_CNMF'
| nPatients | CLUS_1 | CLUS_2 | CLUS_3 |
|---|---|---|---|
| ALL | 41 | 55 | 54 |
| 9Q GAIN MUTATED | 8 | 24 | 6 |
| 9Q GAIN WILD-TYPE | 33 | 31 | 48 |
Figure S1. Get High-res Image Gene #18: '9q gain' versus Molecular Subtype #1: 'CN_CNMF'
P value = 5.19e-07 (Fisher's exact test), Q value = 0.00033
Table S2. Gene #34: '19p gain' versus Molecular Subtype #1: 'CN_CNMF'
| nPatients | CLUS_1 | CLUS_2 | CLUS_3 |
|---|---|---|---|
| ALL | 41 | 55 | 54 |
| 19P GAIN MUTATED | 14 | 31 | 5 |
| 19P GAIN WILD-TYPE | 27 | 24 | 49 |
Figure S2. Get High-res Image Gene #34: '19p gain' versus Molecular Subtype #1: 'CN_CNMF'
P value = 1.05e-05 (Fisher's exact test), Q value = 0.0067
Table S3. Gene #35: '19q gain' versus Molecular Subtype #1: 'CN_CNMF'
| nPatients | CLUS_1 | CLUS_2 | CLUS_3 |
|---|---|---|---|
| ALL | 41 | 55 | 54 |
| 19Q GAIN MUTATED | 9 | 24 | 3 |
| 19Q GAIN WILD-TYPE | 32 | 31 | 51 |
Figure S3. Get High-res Image Gene #35: '19q gain' versus Molecular Subtype #1: 'CN_CNMF'
P value = 0.000246 (Fisher's exact test), Q value = 0.15
Table S4. Gene #38: '21q gain' versus Molecular Subtype #1: 'CN_CNMF'
| nPatients | CLUS_1 | CLUS_2 | CLUS_3 |
|---|---|---|---|
| ALL | 41 | 55 | 54 |
| 21Q GAIN MUTATED | 7 | 25 | 7 |
| 21Q GAIN WILD-TYPE | 34 | 30 | 47 |
Figure S4. Get High-res Image Gene #38: '21q gain' versus Molecular Subtype #1: 'CN_CNMF'

P value = 0.000307 (Fisher's exact test), Q value = 0.19
Table S5. Gene #43: '2p loss' versus Molecular Subtype #1: 'CN_CNMF'
| nPatients | CLUS_1 | CLUS_2 | CLUS_3 |
|---|---|---|---|
| ALL | 41 | 55 | 54 |
| 2P LOSS MUTATED | 6 | 28 | 13 |
| 2P LOSS WILD-TYPE | 35 | 27 | 41 |
Figure S5. Get High-res Image Gene #43: '2p loss' versus Molecular Subtype #1: 'CN_CNMF'
P value = 5.4e-05 (Chi-square test), Q value = 0.034
Table S6. Gene #43: '2p loss' versus Molecular Subtype #2: 'METHLYATION_CNMF'
| nPatients | CLUS_1 | CLUS_2 | CLUS_3 | CLUS_4 | CLUS_5 | CLUS_6 | CLUS_7 |
|---|---|---|---|---|---|---|---|
| ALL | 30 | 28 | 15 | 21 | 18 | 35 | 3 |
| 2P LOSS MUTATED | 3 | 9 | 1 | 8 | 4 | 22 | 0 |
| 2P LOSS WILD-TYPE | 27 | 19 | 14 | 13 | 14 | 13 | 3 |
Figure S6. Get High-res Image Gene #43: '2p loss' versus Molecular Subtype #2: 'METHLYATION_CNMF'

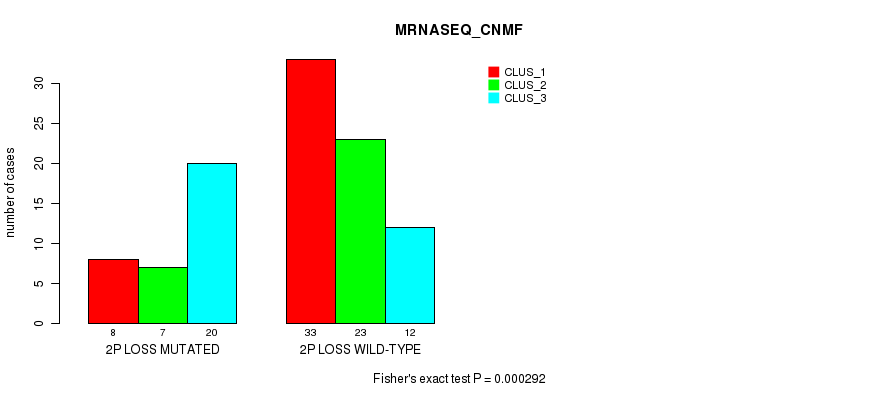
P value = 0.000292 (Fisher's exact test), Q value = 0.18
Table S7. Gene #43: '2p loss' versus Molecular Subtype #3: 'MRNASEQ_CNMF'
| nPatients | CLUS_1 | CLUS_2 | CLUS_3 |
|---|---|---|---|
| ALL | 41 | 30 | 32 |
| 2P LOSS MUTATED | 8 | 7 | 20 |
| 2P LOSS WILD-TYPE | 33 | 23 | 12 |
Figure S7. Get High-res Image Gene #43: '2p loss' versus Molecular Subtype #3: 'MRNASEQ_CNMF'
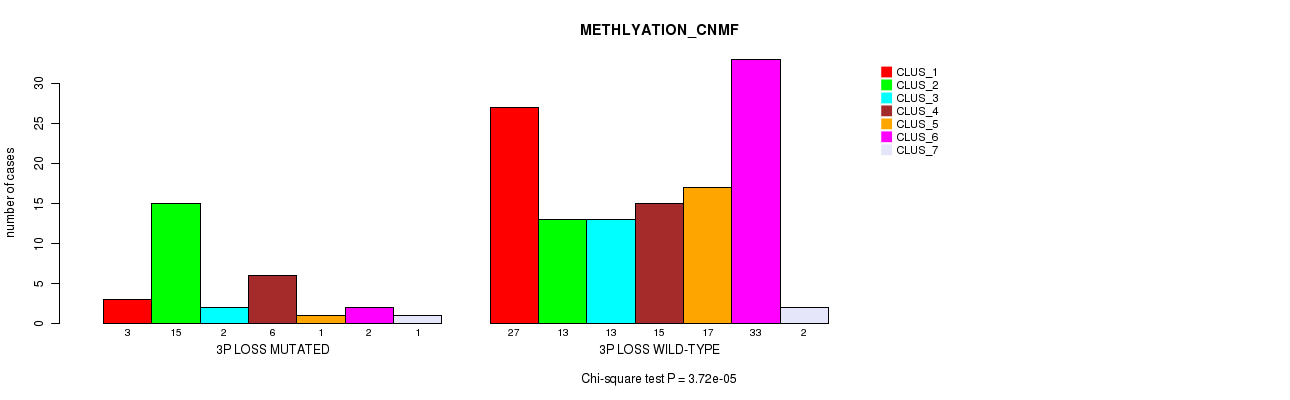
P value = 3.72e-05 (Chi-square test), Q value = 0.024
Table S8. Gene #45: '3p loss' versus Molecular Subtype #2: 'METHLYATION_CNMF'
| nPatients | CLUS_1 | CLUS_2 | CLUS_3 | CLUS_4 | CLUS_5 | CLUS_6 | CLUS_7 |
|---|---|---|---|---|---|---|---|
| ALL | 30 | 28 | 15 | 21 | 18 | 35 | 3 |
| 3P LOSS MUTATED | 3 | 15 | 2 | 6 | 1 | 2 | 1 |
| 3P LOSS WILD-TYPE | 27 | 13 | 13 | 15 | 17 | 33 | 2 |
Figure S8. Get High-res Image Gene #45: '3p loss' versus Molecular Subtype #2: 'METHLYATION_CNMF'
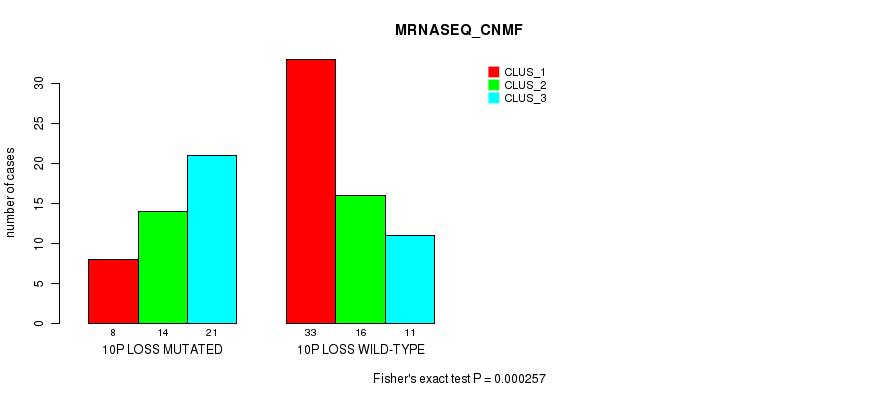
P value = 0.000257 (Fisher's exact test), Q value = 0.16
Table S9. Gene #59: '10p loss' versus Molecular Subtype #3: 'MRNASEQ_CNMF'
| nPatients | CLUS_1 | CLUS_2 | CLUS_3 |
|---|---|---|---|
| ALL | 41 | 30 | 32 |
| 10P LOSS MUTATED | 8 | 14 | 21 |
| 10P LOSS WILD-TYPE | 33 | 16 | 11 |
Figure S9. Get High-res Image Gene #59: '10p loss' versus Molecular Subtype #3: 'MRNASEQ_CNMF'
P value = 2.62e-07 (Fisher's exact test), Q value = 0.00017
Table S10. Gene #60: '10q loss' versus Molecular Subtype #1: 'CN_CNMF'
| nPatients | CLUS_1 | CLUS_2 | CLUS_3 |
|---|---|---|---|
| ALL | 41 | 55 | 54 |
| 10Q LOSS MUTATED | 7 | 39 | 32 |
| 10Q LOSS WILD-TYPE | 34 | 16 | 22 |
Figure S10. Get High-res Image Gene #60: '10q loss' versus Molecular Subtype #1: 'CN_CNMF'

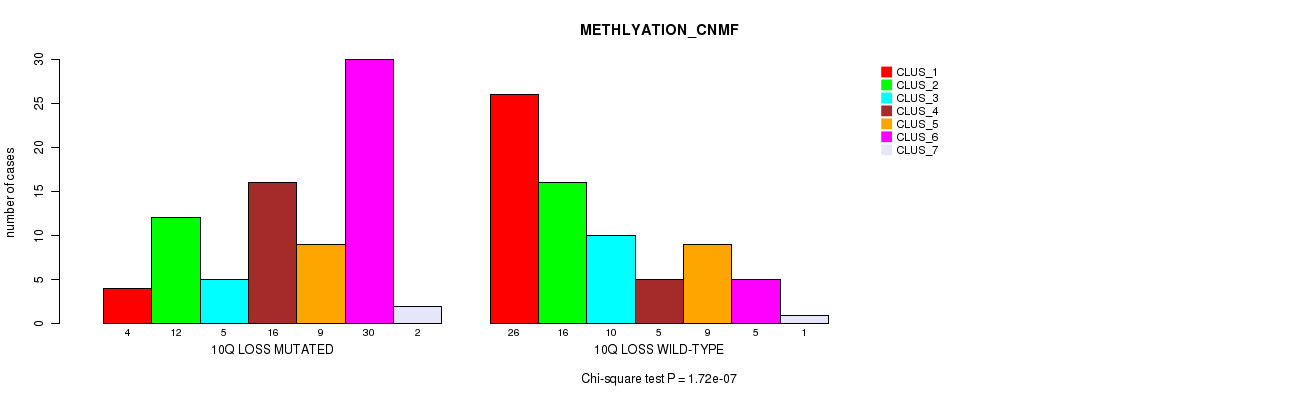
P value = 1.72e-07 (Chi-square test), Q value = 0.00011
Table S11. Gene #60: '10q loss' versus Molecular Subtype #2: 'METHLYATION_CNMF'
| nPatients | CLUS_1 | CLUS_2 | CLUS_3 | CLUS_4 | CLUS_5 | CLUS_6 | CLUS_7 |
|---|---|---|---|---|---|---|---|
| ALL | 30 | 28 | 15 | 21 | 18 | 35 | 3 |
| 10Q LOSS MUTATED | 4 | 12 | 5 | 16 | 9 | 30 | 2 |
| 10Q LOSS WILD-TYPE | 26 | 16 | 10 | 5 | 9 | 5 | 1 |
Figure S11. Get High-res Image Gene #60: '10q loss' versus Molecular Subtype #2: 'METHLYATION_CNMF'
P value = 3.03e-07 (Fisher's exact test), Q value = 0.00019
Table S12. Gene #60: '10q loss' versus Molecular Subtype #3: 'MRNASEQ_CNMF'
| nPatients | CLUS_1 | CLUS_2 | CLUS_3 |
|---|---|---|---|
| ALL | 41 | 30 | 32 |
| 10Q LOSS MUTATED | 9 | 17 | 27 |
| 10Q LOSS WILD-TYPE | 32 | 13 | 5 |
Figure S12. Get High-res Image Gene #60: '10q loss' versus Molecular Subtype #3: 'MRNASEQ_CNMF'
P value = 3.52e-05 (Fisher's exact test), Q value = 0.022
Table S13. Gene #60: '10q loss' versus Molecular Subtype #4: 'MRNASEQ_CHIERARCHICAL'
| nPatients | CLUS_1 | CLUS_2 | CLUS_3 |
|---|---|---|---|
| ALL | 46 | 53 | 4 |
| 10Q LOSS MUTATED | 34 | 19 | 0 |
| 10Q LOSS WILD-TYPE | 12 | 34 | 4 |
Figure S13. Get High-res Image Gene #60: '10q loss' versus Molecular Subtype #4: 'MRNASEQ_CHIERARCHICAL'
P value = 0.000216 (Fisher's exact test), Q value = 0.14
Table S14. Gene #61: '11p loss' versus Molecular Subtype #1: 'CN_CNMF'
| nPatients | CLUS_1 | CLUS_2 | CLUS_3 |
|---|---|---|---|
| ALL | 41 | 55 | 54 |
| 11P LOSS MUTATED | 22 | 25 | 9 |
| 11P LOSS WILD-TYPE | 19 | 30 | 45 |
Figure S14. Get High-res Image Gene #61: '11p loss' versus Molecular Subtype #1: 'CN_CNMF'
P value = 0.000222 (Chi-square test), Q value = 0.14
Table S15. Gene #61: '11p loss' versus Molecular Subtype #2: 'METHLYATION_CNMF'
| nPatients | CLUS_1 | CLUS_2 | CLUS_3 | CLUS_4 | CLUS_5 | CLUS_6 | CLUS_7 |
|---|---|---|---|---|---|---|---|
| ALL | 30 | 28 | 15 | 21 | 18 | 35 | 3 |
| 11P LOSS MUTATED | 5 | 19 | 6 | 8 | 1 | 15 | 2 |
| 11P LOSS WILD-TYPE | 25 | 9 | 9 | 13 | 17 | 20 | 1 |
Figure S15. Get High-res Image Gene #61: '11p loss' versus Molecular Subtype #2: 'METHLYATION_CNMF'
P value = 8.3e-06 (Fisher's exact test), Q value = 0.0053
Table S16. Gene #62: '11q loss' versus Molecular Subtype #1: 'CN_CNMF'
| nPatients | CLUS_1 | CLUS_2 | CLUS_3 |
|---|---|---|---|
| ALL | 41 | 55 | 54 |
| 11Q LOSS MUTATED | 21 | 22 | 5 |
| 11Q LOSS WILD-TYPE | 20 | 33 | 49 |
Figure S16. Get High-res Image Gene #62: '11q loss' versus Molecular Subtype #1: 'CN_CNMF'
P value = 0.000218 (Chi-square test), Q value = 0.14
Table S17. Gene #69: '16q loss' versus Molecular Subtype #2: 'METHLYATION_CNMF'
| nPatients | CLUS_1 | CLUS_2 | CLUS_3 | CLUS_4 | CLUS_5 | CLUS_6 | CLUS_7 |
|---|---|---|---|---|---|---|---|
| ALL | 30 | 28 | 15 | 21 | 18 | 35 | 3 |
| 16Q LOSS MUTATED | 5 | 14 | 5 | 12 | 9 | 27 | 2 |
| 16Q LOSS WILD-TYPE | 25 | 14 | 10 | 9 | 9 | 8 | 1 |
Figure S17. Get High-res Image Gene #69: '16q loss' versus Molecular Subtype #2: 'METHLYATION_CNMF'
P value = 4.94e-05 (Chi-square test), Q value = 0.031
Table S18. Gene #80: 'xq loss' versus Molecular Subtype #2: 'METHLYATION_CNMF'
| nPatients | CLUS_1 | CLUS_2 | CLUS_3 | CLUS_4 | CLUS_5 | CLUS_6 | CLUS_7 |
|---|---|---|---|---|---|---|---|
| ALL | 30 | 28 | 15 | 21 | 18 | 35 | 3 |
| XQ LOSS MUTATED | 1 | 10 | 5 | 10 | 10 | 22 | 0 |
| XQ LOSS WILD-TYPE | 29 | 18 | 10 | 11 | 8 | 13 | 3 |
Figure S18. Get High-res Image Gene #80: 'xq loss' versus Molecular Subtype #2: 'METHLYATION_CNMF'
-
Copy number data file = transformed.cor.cli.txt
-
Molecular subtypes file = SARC-TP.transferedmergedcluster.txt
-
Number of patients = 150
-
Number of significantly arm-level cnvs = 80
-
Number of molecular subtypes = 8
-
Exclude genes that fewer than K tumors have mutations, K = 3
For binary or multi-class clinical features (nominal or ordinal), two-tailed Fisher's exact tests (Fisher 1922) were used to estimate the P values using the 'fisher.test' function in R
For multi-class clinical features (nominal or ordinal), Chi-square tests (Greenwood and Nikulin 1996) were used to estimate the P values using the 'chisq.test' function in R
For multiple hypothesis correction, Q value is the False Discovery Rate (FDR) analogue of the P value (Benjamini and Hochberg 1995), defined as the minimum FDR at which the test may be called significant. We used the 'Benjamini and Hochberg' method of 'p.adjust' function in R to convert P values into Q values.
In addition to the links below, the full results of the analysis summarized in this report can also be downloaded programmatically using firehose_get, or interactively from either the Broad GDAC website or TCGA Data Coordination Center Portal.