This pipeline uses various statistical tests to identify genes whose promoter methylation levels correlated to selected clinical features.
Testing the association between 20386 genes and 5 clinical features across 366 samples, statistically thresholded by Q value < 0.05, 4 clinical features related to at least one genes.
-
226 genes correlated to 'AGE'.
-
ANGPT4 , GPR158 , ALS2CL , ADAMTS15 , PLA2G15 , ...
-
2989 genes correlated to 'HISTOLOGICAL.TYPE'.
-
APBB1IP , ITPK1 , NCRNA00203 , SSTR1 , CARD11 , ...
-
17 genes correlated to 'RADIATIONS.RADIATION.REGIMENINDICATION'.
-
MAP2K2 , FIZ1 , ZNF524 , C17ORF28 , C14ORF93 , ...
-
20 genes correlated to 'COMPLETENESS.OF.RESECTION'.
-
TNFRSF19 , MYRIP , POLR1A__1 , EWSR1 , RHBDD3 , ...
-
No genes correlated to 'Time to Death'
Complete statistical result table is provided in Supplement Table 1
Table 1. Get Full Table This table shows the clinical features, statistical methods used, and the number of genes that are significantly associated with each clinical feature at Q value < 0.05.
| Clinical feature | Statistical test | Significant genes | Associated with | Associated with | ||
|---|---|---|---|---|---|---|
| Time to Death | Cox regression test | N=0 | ||||
| AGE | Spearman correlation test | N=226 | older | N=65 | younger | N=161 |
| HISTOLOGICAL TYPE | ANOVA test | N=2989 | ||||
| RADIATIONS RADIATION REGIMENINDICATION | t test | N=17 | yes | N=16 | no | N=1 |
| COMPLETENESS OF RESECTION | ANOVA test | N=20 |
Table S1. Basic characteristics of clinical feature: 'Time to Death'
| Time to Death | Duration (Months) | 0-191.8 (median=17.6) |
| censored | N = 320 | |
| death | N = 44 | |
| Significant markers | N = 0 |
Table S2. Basic characteristics of clinical feature: 'AGE'
| AGE | Mean (SD) | 63.92 (11) |
| Significant markers | N = 226 | |
| pos. correlated | 65 | |
| neg. correlated | 161 |
Table S3. Get Full Table List of top 10 genes significantly correlated to 'AGE' by Spearman correlation test
| SpearmanCorr | corrP | Q | |
|---|---|---|---|
| ANGPT4 | 0.3472 | 8.919e-12 | 1.82e-07 |
| GPR158 | -0.3402 | 2.416e-11 | 4.93e-07 |
| ALS2CL | -0.3401 | 2.472e-11 | 5.04e-07 |
| ADAMTS15 | -0.3316 | 8.102e-11 | 1.65e-06 |
| PLA2G15 | -0.3297 | 1.056e-10 | 2.15e-06 |
| HDAC11 | -0.3272 | 1.488e-10 | 3.03e-06 |
| ITPK1 | -0.3248 | 2.062e-10 | 4.2e-06 |
| NCRNA00203 | -0.3248 | 2.062e-10 | 4.2e-06 |
| C2ORF34 | -0.317 | 5.757e-10 | 1.17e-05 |
| SLFN14 | 0.3153 | 7.259e-10 | 1.48e-05 |
Figure S1. Get High-res Image As an example, this figure shows the association of ANGPT4 to 'AGE'. P value = 8.92e-12 with Spearman correlation analysis. The straight line presents the best linear regression.
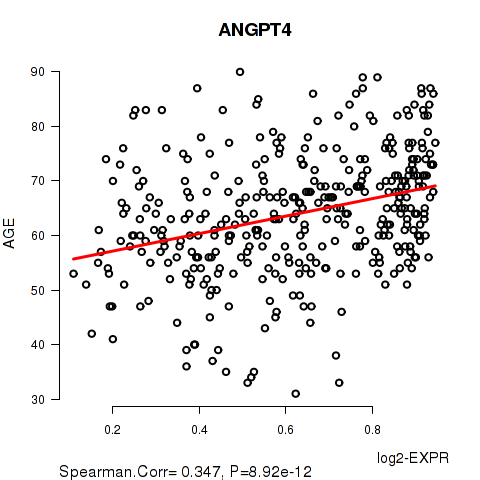
Table S4. Basic characteristics of clinical feature: 'HISTOLOGICAL.TYPE'
| HISTOLOGICAL.TYPE | Labels | N |
| ENDOMETRIOID ENDOMETRIAL ADENOCARCINOMA | 270 | |
| MIXED SEROUS AND ENDOMETRIOID | 18 | |
| SEROUS ENDOMETRIAL ADENOCARCINOMA | 78 | |
| Significant markers | N = 2989 |
Table S5. Get Full Table List of top 10 genes differentially expressed by 'HISTOLOGICAL.TYPE'
| ANOVA_P | Q | |
|---|---|---|
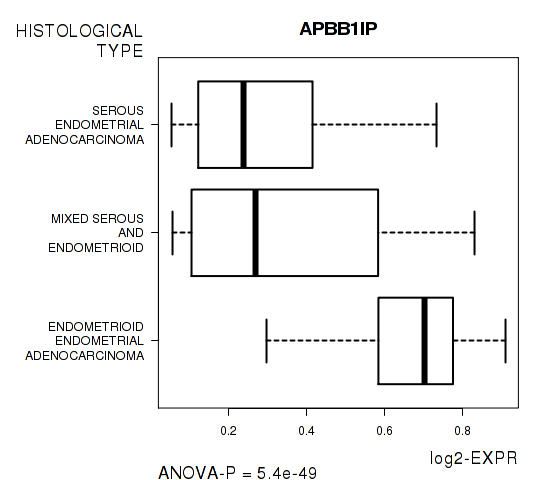
| APBB1IP | 5.398e-49 | 1.1e-44 |
| ITPK1 | 2.271e-46 | 4.63e-42 |
| NCRNA00203 | 2.271e-46 | 4.63e-42 |
| SSTR1 | 2.212e-44 | 4.51e-40 |
| CARD11 | 3.882e-44 | 7.91e-40 |
| PPIH | 1.404e-43 | 2.86e-39 |
| CRYAB__1 | 3.47e-41 | 7.07e-37 |
| HSPB2__1 | 3.47e-41 | 7.07e-37 |
| ADAMTS16 | 5.629e-41 | 1.15e-36 |
| CRYAB | 2.375e-40 | 4.84e-36 |
Figure S2. Get High-res Image As an example, this figure shows the association of APBB1IP to 'HISTOLOGICAL.TYPE'. P value = 5.4e-49 with ANOVA analysis.
17 genes related to 'RADIATIONS.RADIATION.REGIMENINDICATION'.
Table S6. Basic characteristics of clinical feature: 'RADIATIONS.RADIATION.REGIMENINDICATION'
| RADIATIONS.RADIATION.REGIMENINDICATION | Labels | N |
| NO | 84 | |
| YES | 282 | |
| Significant markers | N = 17 | |
| Higher in YES | 16 | |
| Higher in NO | 1 |
Table S7. Get Full Table List of top 10 genes differentially expressed by 'RADIATIONS.RADIATION.REGIMENINDICATION'
| T(pos if higher in 'YES') | ttestP | Q | AUC | |
|---|---|---|---|---|
| MAP2K2 | 5.94 | 2.027e-08 | 0.000413 | 0.7024 |
| FIZ1 | 5.82 | 3.991e-08 | 0.000814 | 0.6999 |
| ZNF524 | 5.82 | 3.991e-08 | 0.000814 | 0.6999 |
| C17ORF28 | 5.44 | 1.94e-07 | 0.00395 | 0.6865 |
| C14ORF93 | 5.38 | 2.651e-07 | 0.0054 | 0.6969 |
| GIPR | 5.32 | 4.627e-07 | 0.00943 | 0.6875 |
| PEF1 | 5.14 | 6.067e-07 | 0.0124 | 0.659 |
| RGPD4 | 5.26 | 6.269e-07 | 0.0128 | 0.6749 |
| MST1 | 5.05 | 1.007e-06 | 0.0205 | 0.6513 |
| RNF123__1 | 5.05 | 1.007e-06 | 0.0205 | 0.6513 |
Figure S3. Get High-res Image As an example, this figure shows the association of MAP2K2 to 'RADIATIONS.RADIATION.REGIMENINDICATION'. P value = 2.03e-08 with T-test analysis.
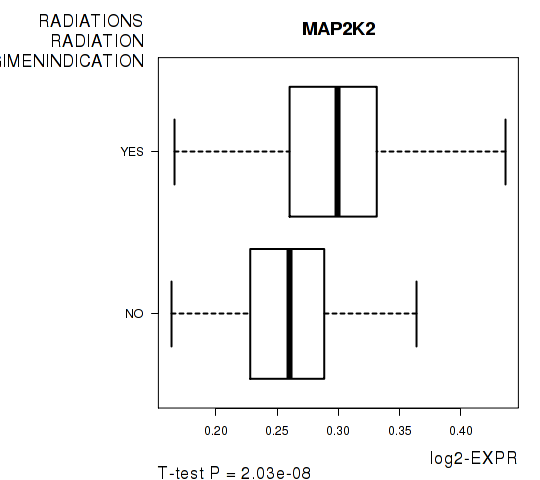
Table S8. Basic characteristics of clinical feature: 'COMPLETENESS.OF.RESECTION'
| COMPLETENESS.OF.RESECTION | Labels | N |
| R0 | 243 | |
| R1 | 18 | |
| R2 | 12 | |
| RX | 26 | |
| Significant markers | N = 20 |
Table S9. Get Full Table List of top 10 genes differentially expressed by 'COMPLETENESS.OF.RESECTION'
| ANOVA_P | Q | |
|---|---|---|
| TNFRSF19 | 1.104e-09 | 2.25e-05 |
| MYRIP | 1.613e-08 | 0.000329 |
| POLR1A__1 | 5.703e-07 | 0.0116 |
| EWSR1 | 1.352e-06 | 0.0276 |
| RHBDD3 | 1.352e-06 | 0.0276 |
| TANC1 | 1.37e-06 | 0.0279 |
| LOC647288 | 1.432e-06 | 0.0292 |
| ZNF330 | 1.532e-06 | 0.0312 |
| RNU5D__1 | 1.797e-06 | 0.0366 |
| RNU5E__1 | 1.797e-06 | 0.0366 |
Figure S4. Get High-res Image As an example, this figure shows the association of TNFRSF19 to 'COMPLETENESS.OF.RESECTION'. P value = 1.1e-09 with ANOVA analysis.

-
Expresson data file = UCEC-TP.meth.by_min_clin_corr.data.txt
-
Clinical data file = UCEC-TP.merged_data.txt
-
Number of patients = 366
-
Number of genes = 20386
-
Number of clinical features = 5
For survival clinical features, Wald's test in univariate Cox regression analysis with proportional hazards model (Andersen and Gill 1982) was used to estimate the P values using the 'coxph' function in R. Kaplan-Meier survival curves were plot using the four quartile subgroups of patients based on expression levels
For continuous numerical clinical features, Spearman's rank correlation coefficients (Spearman 1904) and two-tailed P values were estimated using 'cor.test' function in R
For multi-class clinical features (ordinal or nominal), one-way analysis of variance (Howell 2002) was applied to compare the log2-expression levels between different clinical classes using 'anova' function in R
For two-class clinical features, two-tailed Student's t test with unequal variance (Lehmann and Romano 2005) was applied to compare the log2-expression levels between the two clinical classes using 't.test' function in R
For multiple hypothesis correction, Q value is the False Discovery Rate (FDR) analogue of the P value (Benjamini and Hochberg 1995), defined as the minimum FDR at which the test may be called significant. We used the 'Benjamini and Hochberg' method of 'p.adjust' function in R to convert P values into Q values.
In addition to the links below, the full results of the analysis summarized in this report can also be downloaded programmatically using firehose_get, or interactively from either the Broad GDAC website or TCGA Data Coordination Center Portal.