This pipeline uses various statistical tests to identify mRNAs whose expression levels correlated to selected clinical features.
Testing the association between 18555 genes and 5 clinical features across 477 samples, statistically thresholded by Q value < 0.05, 4 clinical features related to at least one genes.
-
378 genes correlated to 'AGE'.
-
DIO2|1734 , FAM107A|11170 , PTCH1|5727 , S100A1|6271 , HIF3A|64344 , ...
-
3894 genes correlated to 'HISTOLOGICAL.TYPE'.
-
L1CAM|3897 , KIAA1324|57535 , CLDN6|9074 , FOXA2|3170 , HIF3A|64344 , ...
-
116 genes correlated to 'RADIATIONS.RADIATION.REGIMENINDICATION'.
-
ANXA2P3|305 , RPL23AP82|284942 , UBE2MP1|606551 , LOC407835|407835 , PGAM4|441531 , ...
-
8 genes correlated to 'COMPLETENESS.OF.RESECTION'.
-
ST3GAL4|6484 , SLC7A10|56301 , FRMD1|79981 , MAML3|55534 , CIRBP|1153 , ...
-
No genes correlated to 'Time to Death'
Complete statistical result table is provided in Supplement Table 1
Table 1. Get Full Table This table shows the clinical features, statistical methods used, and the number of genes that are significantly associated with each clinical feature at Q value < 0.05.
| Clinical feature | Statistical test | Significant genes | Associated with | Associated with | ||
|---|---|---|---|---|---|---|
| Time to Death | Cox regression test | N=0 | ||||
| AGE | Spearman correlation test | N=378 | older | N=229 | younger | N=149 |
| HISTOLOGICAL TYPE | ANOVA test | N=3894 | ||||
| RADIATIONS RADIATION REGIMENINDICATION | t test | N=116 | yes | N=9 | no | N=107 |
| COMPLETENESS OF RESECTION | ANOVA test | N=8 |
Table S1. Basic characteristics of clinical feature: 'Time to Death'
| Time to Death | Duration (Months) | 0-191.8 (median=20.9) |
| censored | N = 416 | |
| death | N = 59 | |
| Significant markers | N = 0 |
Table S2. Basic characteristics of clinical feature: 'AGE'
| AGE | Mean (SD) | 63.71 (11) |
| Significant markers | N = 378 | |
| pos. correlated | 229 | |
| neg. correlated | 149 |
Table S3. Get Full Table List of top 10 genes significantly correlated to 'AGE' by Spearman correlation test
| SpearmanCorr | corrP | Q | |
|---|---|---|---|
| DIO2|1734 | -0.3771 | 1.56e-17 | 2.89e-13 |
| FAM107A|11170 | 0.3561 | 1.117e-15 | 2.07e-11 |
| PTCH1|5727 | -0.335 | 6.056e-14 | 1.12e-09 |
| S100A1|6271 | 0.3254 | 3.369e-13 | 6.25e-09 |
| HIF3A|64344 | 0.3264 | 4.185e-13 | 7.76e-09 |
| MGAT4A|11320 | 0.3237 | 4.471e-13 | 8.29e-09 |
| NR2F6|2063 | 0.3199 | 8.659e-13 | 1.61e-08 |
| DLC1|10395 | -0.3158 | 1.754e-12 | 3.25e-08 |
| PTGS1|5742 | 0.3127 | 2.95e-12 | 5.47e-08 |
| DUSP9|1852 | 0.3252 | 3.007e-12 | 5.58e-08 |
Figure S1. Get High-res Image As an example, this figure shows the association of DIO2|1734 to 'AGE'. P value = 1.56e-17 with Spearman correlation analysis. The straight line presents the best linear regression.
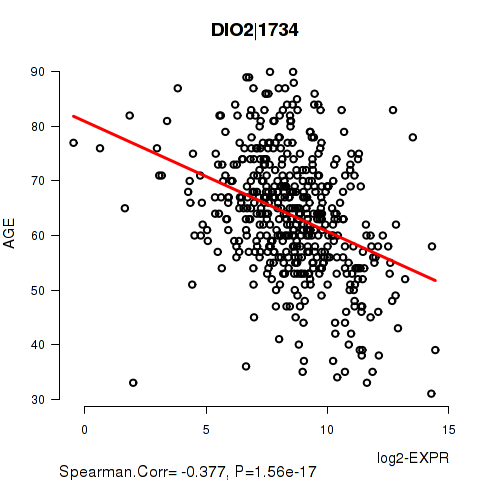
Table S4. Basic characteristics of clinical feature: 'HISTOLOGICAL.TYPE'
| HISTOLOGICAL.TYPE | Labels | N |
| ENDOMETRIOID ENDOMETRIAL ADENOCARCINOMA | 365 | |
| MIXED SEROUS AND ENDOMETRIOID | 18 | |
| SEROUS ENDOMETRIAL ADENOCARCINOMA | 94 | |
| Significant markers | N = 3894 |
Table S5. Get Full Table List of top 10 genes differentially expressed by 'HISTOLOGICAL.TYPE'
| ANOVA_P | Q | |
|---|---|---|
| L1CAM|3897 | 1.098e-62 | 2.04e-58 |
| KIAA1324|57535 | 9.24e-56 | 1.71e-51 |
| CLDN6|9074 | 9.346e-50 | 1.73e-45 |
| FOXA2|3170 | 2.117e-48 | 3.93e-44 |
| HIF3A|64344 | 9.469e-48 | 1.76e-43 |
| SLC6A12|6539 | 3.981e-44 | 7.39e-40 |
| CDKN1A|1026 | 2.09e-42 | 3.88e-38 |
| TFF3|7033 | 5.905e-42 | 1.1e-37 |
| SPDEF|25803 | 8.112e-42 | 1.5e-37 |
| IL20RA|53832 | 2.57e-40 | 4.77e-36 |
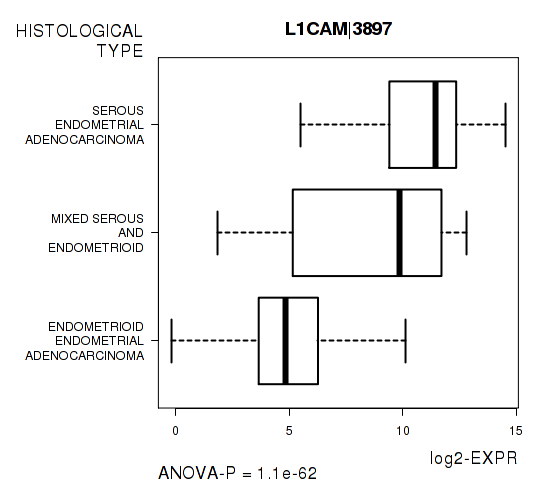
Figure S2. Get High-res Image As an example, this figure shows the association of L1CAM|3897 to 'HISTOLOGICAL.TYPE'. P value = 1.1e-62 with ANOVA analysis.
116 genes related to 'RADIATIONS.RADIATION.REGIMENINDICATION'.
Table S6. Basic characteristics of clinical feature: 'RADIATIONS.RADIATION.REGIMENINDICATION'
| RADIATIONS.RADIATION.REGIMENINDICATION | Labels | N |
| NO | 134 | |
| YES | 343 | |
| Significant markers | N = 116 | |
| Higher in YES | 9 | |
| Higher in NO | 107 |
Table S7. Get Full Table List of top 10 genes differentially expressed by 'RADIATIONS.RADIATION.REGIMENINDICATION'
| T(pos if higher in 'YES') | ttestP | Q | AUC | |
|---|---|---|---|---|
| ANXA2P3|305 | -7.41 | 7.017e-13 | 1.3e-08 | 0.6531 |
| RPL23AP82|284942 | -7.4 | 9.041e-13 | 1.68e-08 | 0.6949 |
| UBE2MP1|606551 | -7.15 | 4.583e-12 | 8.5e-08 | 0.6585 |
| LOC407835|407835 | -7.12 | 5.052e-12 | 9.37e-08 | 0.6529 |
| PGAM4|441531 | -7.1 | 5.7e-12 | 1.06e-07 | 0.659 |
| ANXA2P1|303 | -7.06 | 8.673e-12 | 1.61e-07 | 0.6572 |
| POTEE|445582 | -6.86 | 2.478e-11 | 4.6e-07 | 0.6587 |
| TPI1P3|728402 | -6.78 | 4.127e-11 | 7.66e-07 | 0.6584 |
| UBE2NL|389898 | -6.74 | 5.501e-11 | 1.02e-06 | 0.655 |
| PPIAL4G|644591 | -6.49 | 2.559e-10 | 4.75e-06 | 0.6444 |
Figure S3. Get High-res Image As an example, this figure shows the association of ANXA2P3|305 to 'RADIATIONS.RADIATION.REGIMENINDICATION'. P value = 7.02e-13 with T-test analysis.
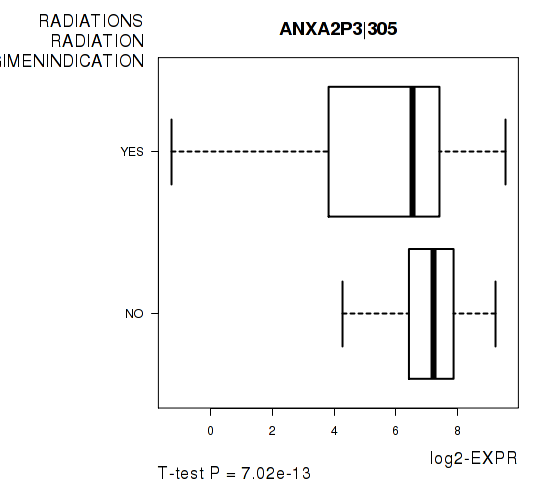
Table S8. Basic characteristics of clinical feature: 'COMPLETENESS.OF.RESECTION'
| COMPLETENESS.OF.RESECTION | Labels | N |
| R0 | 328 | |
| R1 | 24 | |
| R2 | 16 | |
| RX | 27 | |
| Significant markers | N = 8 |
Table S9. Get Full Table List of 8 genes differentially expressed by 'COMPLETENESS.OF.RESECTION'
| ANOVA_P | Q | |
|---|---|---|
| ST3GAL4|6484 | 2.331e-07 | 0.00433 |
| SLC7A10|56301 | 4.066e-07 | 0.00754 |
| FRMD1|79981 | 4.09e-07 | 0.00759 |
| MAML3|55534 | 6.453e-07 | 0.012 |
| CIRBP|1153 | 1.134e-06 | 0.021 |
| SVOP|55530 | 1.145e-06 | 0.0212 |
| TMEM171|134285 | 1.417e-06 | 0.0263 |
| NYX|60506 | 1.531e-06 | 0.0284 |
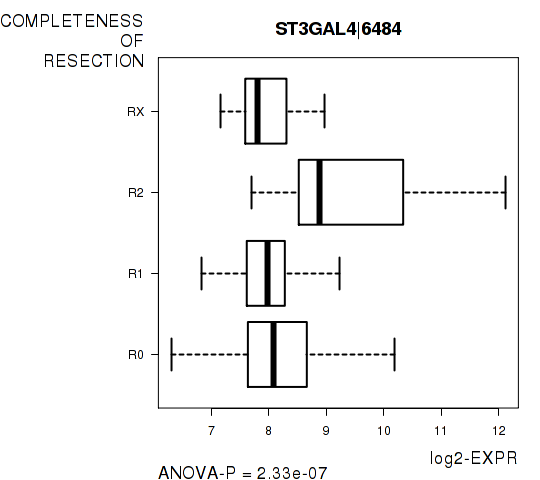
Figure S4. Get High-res Image As an example, this figure shows the association of ST3GAL4|6484 to 'COMPLETENESS.OF.RESECTION'. P value = 2.33e-07 with ANOVA analysis.
-
Expresson data file = UCEC-TP.uncv2.mRNAseq_RSEM_normalized_log2.txt
-
Clinical data file = UCEC-TP.merged_data.txt
-
Number of patients = 477
-
Number of genes = 18555
-
Number of clinical features = 5
For survival clinical features, Wald's test in univariate Cox regression analysis with proportional hazards model (Andersen and Gill 1982) was used to estimate the P values using the 'coxph' function in R. Kaplan-Meier survival curves were plot using the four quartile subgroups of patients based on expression levels
For continuous numerical clinical features, Spearman's rank correlation coefficients (Spearman 1904) and two-tailed P values were estimated using 'cor.test' function in R
For multi-class clinical features (ordinal or nominal), one-way analysis of variance (Howell 2002) was applied to compare the log2-expression levels between different clinical classes using 'anova' function in R
For two-class clinical features, two-tailed Student's t test with unequal variance (Lehmann and Romano 2005) was applied to compare the log2-expression levels between the two clinical classes using 't.test' function in R
For multiple hypothesis correction, Q value is the False Discovery Rate (FDR) analogue of the P value (Benjamini and Hochberg 1995), defined as the minimum FDR at which the test may be called significant. We used the 'Benjamini and Hochberg' method of 'p.adjust' function in R to convert P values into Q values.
In addition to the links below, the full results of the analysis summarized in this report can also be downloaded programmatically using firehose_get, or interactively from either the Broad GDAC website or TCGA Data Coordination Center Portal.