This pipeline uses various statistical tests to identify miRs whose expression levels correlated to selected clinical features.
Testing the association between 556 miRs and 5 clinical features across 473 samples, statistically thresholded by Q value < 0.05, 4 clinical features related to at least one miRs.
-
5 miRs correlated to 'Time to Death'.
-
HSA-LET-7G , HSA-MIR-497 , HSA-MIR-34A , HSA-MIR-628 , HSA-MIR-195
-
44 miRs correlated to 'AGE'.
-
HSA-MIR-424 , HSA-MIR-1247 , HSA-MIR-935 , HSA-MIR-337 , HSA-MIR-516A-1 , ...
-
104 miRs correlated to 'HISTOLOGICAL.TYPE'.
-
HSA-MIR-9-3 , HSA-MIR-9-2 , HSA-MIR-9-1 , HSA-MIR-934 , HSA-MIR-34A , ...
-
9 miRs correlated to 'RADIATIONS.RADIATION.REGIMENINDICATION'.
-
HSA-MIR-3613 , HSA-MIR-128-1 , HSA-MIR-628 , HSA-MIR-107 , HSA-MIR-128-2 , ...
-
No miRs correlated to 'COMPLETENESS.OF.RESECTION'
Complete statistical result table is provided in Supplement Table 1
Table 1. Get Full Table This table shows the clinical features, statistical methods used, and the number of miRs that are significantly associated with each clinical feature at Q value < 0.05.
| Clinical feature | Statistical test | Significant miRs | Associated with | Associated with | ||
|---|---|---|---|---|---|---|
| Time to Death | Cox regression test | N=5 | shorter survival | N=0 | longer survival | N=5 |
| AGE | Spearman correlation test | N=44 | older | N=5 | younger | N=39 |
| HISTOLOGICAL TYPE | ANOVA test | N=104 | ||||
| RADIATIONS RADIATION REGIMENINDICATION | t test | N=9 | yes | N=6 | no | N=3 |
| COMPLETENESS OF RESECTION | ANOVA test | N=0 |
Table S1. Basic characteristics of clinical feature: 'Time to Death'
| Time to Death | Duration (Months) | 0-191.8 (median=21.2) |
| censored | N = 415 | |
| death | N = 56 | |
| Significant markers | N = 5 | |
| associated with shorter survival | 0 | |
| associated with longer survival | 5 |
Table S2. Get Full Table List of 5 miRs significantly associated with 'Time to Death' by Cox regression test
| HazardRatio | Wald_P | Q | C_index | |
|---|---|---|---|---|
| HSA-LET-7G | 0.51 | 1.422e-05 | 0.0079 | 0.335 |
| HSA-MIR-497 | 0.67 | 1.581e-05 | 0.0088 | 0.344 |
| HSA-MIR-34A | 0.72 | 3.324e-05 | 0.018 | 0.358 |
| HSA-MIR-628 | 0.68 | 4.485e-05 | 0.025 | 0.357 |
| HSA-MIR-195 | 0.69 | 5.344e-05 | 0.03 | 0.349 |
Figure S1. Get High-res Image As an example, this figure shows the association of HSA-LET-7G to 'Time to Death'. four curves present the cumulative survival rates of 4 quartile subsets of patients. P value = 1.42e-05 with univariate Cox regression analysis using continuous log-2 expression values.
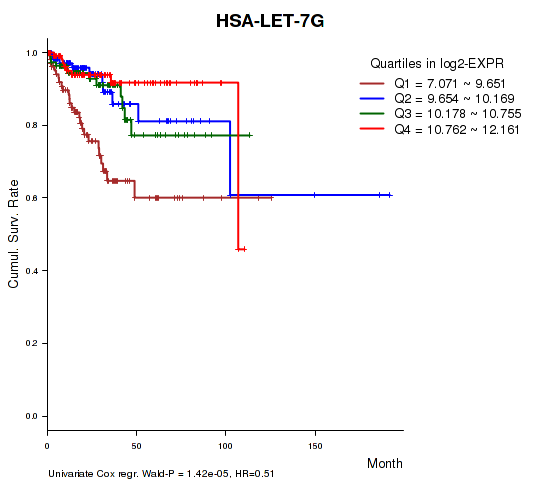
Table S3. Basic characteristics of clinical feature: 'AGE'
| AGE | Mean (SD) | 63.65 (11) |
| Significant markers | N = 44 | |
| pos. correlated | 5 | |
| neg. correlated | 39 |
Table S4. Get Full Table List of top 10 miRs significantly correlated to 'AGE' by Spearman correlation test
| SpearmanCorr | corrP | Q | |
|---|---|---|---|
| HSA-MIR-424 | -0.3174 | 1.665e-12 | 9.26e-10 |
| HSA-MIR-1247 | -0.2618 | 9.021e-09 | 5.01e-06 |
| HSA-MIR-935 | 0.2676 | 7.171e-08 | 3.97e-05 |
| HSA-MIR-337 | -0.242 | 1.024e-07 | 5.66e-05 |
| HSA-MIR-516A-1 | 0.3035 | 1.837e-07 | 0.000101 |
| HSA-MIR-199A-1 | -0.2364 | 2.027e-07 | 0.000112 |
| HSA-MIR-34A | -0.2354 | 2.298e-07 | 0.000126 |
| HSA-MIR-214 | -0.2347 | 2.576e-07 | 0.000141 |
| HSA-MIR-409 | -0.2333 | 2.946e-07 | 0.000161 |
| HSA-MIR-199A-2 | -0.2316 | 3.642e-07 | 0.000199 |
Figure S2. Get High-res Image As an example, this figure shows the association of HSA-MIR-424 to 'AGE'. P value = 1.67e-12 with Spearman correlation analysis. The straight line presents the best linear regression.
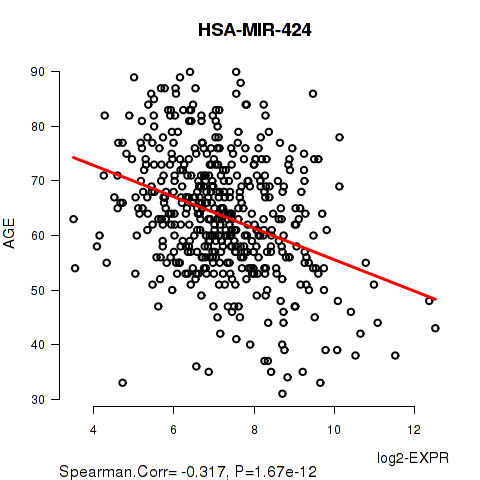
Table S5. Basic characteristics of clinical feature: 'HISTOLOGICAL.TYPE'
| HISTOLOGICAL.TYPE | Labels | N |
| ENDOMETRIOID ENDOMETRIAL ADENOCARCINOMA | 365 | |
| MIXED SEROUS AND ENDOMETRIOID | 19 | |
| SEROUS ENDOMETRIAL ADENOCARCINOMA | 89 | |
| Significant markers | N = 104 |
Table S6. Get Full Table List of top 10 miRs differentially expressed by 'HISTOLOGICAL.TYPE'
| ANOVA_P | Q | |
|---|---|---|
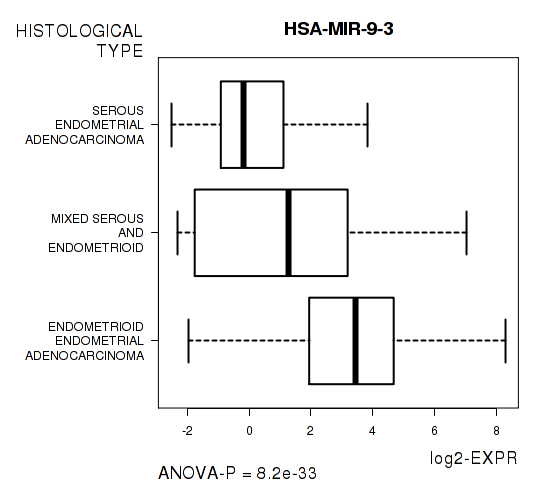
| HSA-MIR-9-3 | 8.199e-33 | 4.56e-30 |
| HSA-MIR-9-2 | 9.865e-30 | 5.47e-27 |
| HSA-MIR-9-1 | 1.157e-29 | 6.41e-27 |
| HSA-MIR-934 | 1.503e-25 | 8.31e-23 |
| HSA-MIR-34A | 6.614e-22 | 3.65e-19 |
| HSA-MIR-375 | 6.377e-20 | 3.51e-17 |
| HSA-MIR-221 | 3.644e-19 | 2e-16 |
| HSA-MIR-452 | 7.84e-19 | 4.3e-16 |
| HSA-MIR-195 | 1.348e-18 | 7.39e-16 |
| HSA-MIR-548V | 1.693e-18 | 9.26e-16 |
Figure S3. Get High-res Image As an example, this figure shows the association of HSA-MIR-9-3 to 'HISTOLOGICAL.TYPE'. P value = 8.2e-33 with ANOVA analysis.
9 miRs related to 'RADIATIONS.RADIATION.REGIMENINDICATION'.
Table S7. Basic characteristics of clinical feature: 'RADIATIONS.RADIATION.REGIMENINDICATION'
| RADIATIONS.RADIATION.REGIMENINDICATION | Labels | N |
| NO | 131 | |
| YES | 342 | |
| Significant markers | N = 9 | |
| Higher in YES | 6 | |
| Higher in NO | 3 |
Table S8. Get Full Table List of 9 miRs differentially expressed by 'RADIATIONS.RADIATION.REGIMENINDICATION'
| T(pos if higher in 'YES') | ttestP | Q | AUC | |
|---|---|---|---|---|
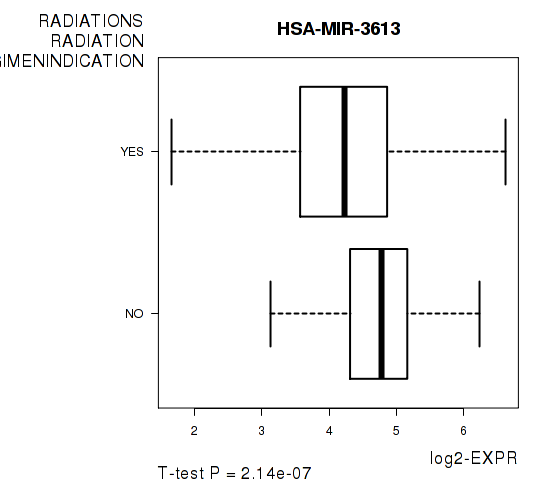
| HSA-MIR-3613 | -5.32 | 2.137e-07 | 0.000119 | 0.6555 |
| HSA-MIR-128-1 | 4.86 | 1.924e-06 | 0.00107 | 0.6399 |
| HSA-MIR-628 | -4.7 | 4.202e-06 | 0.00233 | 0.6305 |
| HSA-MIR-107 | 4.6 | 6.227e-06 | 0.00344 | 0.6209 |
| HSA-MIR-128-2 | 4.57 | 7.289e-06 | 0.00402 | 0.6294 |
| HSA-MIR-361 | 4.43 | 1.43e-05 | 0.00788 | 0.6212 |
| HSA-MIR-181D | 4.37 | 1.815e-05 | 0.00999 | 0.629 |
| HSA-MIR-103-1 | 4.3 | 2.482e-05 | 0.0136 | 0.6239 |
| HSA-MIR-146A | -4.21 | 3.663e-05 | 0.0201 | 0.6177 |
Figure S4. Get High-res Image As an example, this figure shows the association of HSA-MIR-3613 to 'RADIATIONS.RADIATION.REGIMENINDICATION'. P value = 2.14e-07 with T-test analysis.
-
Expresson data file = UCEC-TP.miRseq_RPKM_log2.txt
-
Clinical data file = UCEC-TP.merged_data.txt
-
Number of patients = 473
-
Number of miRs = 556
-
Number of clinical features = 5
For survival clinical features, Wald's test in univariate Cox regression analysis with proportional hazards model (Andersen and Gill 1982) was used to estimate the P values using the 'coxph' function in R. Kaplan-Meier survival curves were plot using the four quartile subgroups of patients based on expression levels
For continuous numerical clinical features, Spearman's rank correlation coefficients (Spearman 1904) and two-tailed P values were estimated using 'cor.test' function in R
For multi-class clinical features (ordinal or nominal), one-way analysis of variance (Howell 2002) was applied to compare the log2-expression levels between different clinical classes using 'anova' function in R
For two-class clinical features, two-tailed Student's t test with unequal variance (Lehmann and Romano 2005) was applied to compare the log2-expression levels between the two clinical classes using 't.test' function in R
For multiple hypothesis correction, Q value is the False Discovery Rate (FDR) analogue of the P value (Benjamini and Hochberg 1995), defined as the minimum FDR at which the test may be called significant. We used the 'Benjamini and Hochberg' method of 'p.adjust' function in R to convert P values into Q values.
In addition to the links below, the full results of the analysis summarized in this report can also be downloaded programmatically using firehose_get, or interactively from either the Broad GDAC website or TCGA Data Coordination Center Portal.