This pipeline computes the correlation between significant arm-level copy number variations (cnvs) and molecular subtypes.
Testing the association between copy number variation 77 arm-level events and 8 molecular subtypes across 56 patients, one significant finding detected with P value < 0.05 and Q value < 0.25.
-
4q loss cnv correlated to 'MIRSEQ_CNMF'.
Table 1. Get Full Table Overview of the association between significant copy number variation of 77 arm-level events and 8 molecular subtypes. Shown in the table are P values (Q values). Thresholded by P value < 0.05 and Q value < 0.25, one significant finding detected.
|
Clinical Features |
CN CNMF |
METHLYATION CNMF |
MRNASEQ CNMF |
MRNASEQ CHIERARCHICAL |
MIRSEQ CNMF |
MIRSEQ CHIERARCHICAL |
MIRSEQ MATURE CNMF |
MIRSEQ MATURE CHIERARCHICAL |
||
| nCNV (%) | nWild-Type | Fisher's exact test | Chi-square test | Fisher's exact test | Fisher's exact test | Fisher's exact test | Fisher's exact test | Fisher's exact test | Fisher's exact test | |
| 4q loss | 33 (59%) | 23 |
0.0654 (1.00) |
0.0196 (1.00) |
0.00525 (1.00) |
0.0104 (1.00) |
0.000195 (0.12) |
0.218 (1.00) |
0.0184 (1.00) |
0.101 (1.00) |
| 1p gain | 24 (43%) | 32 |
0.0443 (1.00) |
0.738 (1.00) |
0.795 (1.00) |
0.801 (1.00) |
0.518 (1.00) |
0.0796 (1.00) |
0.611 (1.00) |
0.366 (1.00) |
| 1q gain | 31 (55%) | 25 |
0.305 (1.00) |
0.739 (1.00) |
0.747 (1.00) |
0.414 (1.00) |
0.663 (1.00) |
0.552 (1.00) |
0.952 (1.00) |
1 (1.00) |
| 2p gain | 23 (41%) | 33 |
0.758 (1.00) |
0.00996 (1.00) |
0.02 (1.00) |
0.0503 (1.00) |
0.477 (1.00) |
0.0395 (1.00) |
0.281 (1.00) |
0.0293 (1.00) |
| 2q gain | 21 (38%) | 35 |
0.612 (1.00) |
0.0171 (1.00) |
0.0125 (1.00) |
0.0255 (1.00) |
0.579 (1.00) |
0.0314 (1.00) |
0.378 (1.00) |
0.0269 (1.00) |
| 3p gain | 12 (21%) | 44 |
0.369 (1.00) |
0.25 (1.00) |
0.435 (1.00) |
0.382 (1.00) |
0.861 (1.00) |
0.415 (1.00) |
0.959 (1.00) |
0.485 (1.00) |
| 3q gain | 23 (41%) | 33 |
0.209 (1.00) |
0.0444 (1.00) |
0.197 (1.00) |
0.169 (1.00) |
0.477 (1.00) |
0.326 (1.00) |
0.492 (1.00) |
0.246 (1.00) |
| 4p gain | 9 (16%) | 47 |
1 (1.00) |
0.571 (1.00) |
0.823 (1.00) |
0.814 (1.00) |
0.776 (1.00) |
0.557 (1.00) |
0.825 (1.00) |
0.764 (1.00) |
| 4q gain | 3 (5%) | 53 |
0.581 (1.00) |
0.278 (1.00) |
0.513 (1.00) |
0.491 (1.00) |
0.673 (1.00) |
1 (1.00) |
0.687 (1.00) |
1 (1.00) |
| 5p gain | 23 (41%) | 33 |
0.376 (1.00) |
0.366 (1.00) |
0.431 (1.00) |
0.377 (1.00) |
0.737 (1.00) |
1 (1.00) |
0.894 (1.00) |
0.704 (1.00) |
| 5q gain | 8 (14%) | 48 |
0.781 (1.00) |
0.557 (1.00) |
0.309 (1.00) |
0.297 (1.00) |
0.0803 (1.00) |
0.0934 (1.00) |
0.24 (1.00) |
0.221 (1.00) |
| 6p gain | 30 (54%) | 26 |
0.312 (1.00) |
0.504 (1.00) |
0.601 (1.00) |
0.138 (1.00) |
1 (1.00) |
0.264 (1.00) |
0.892 (1.00) |
0.64 (1.00) |
| 6q gain | 27 (48%) | 29 |
0.351 (1.00) |
0.199 (1.00) |
0.219 (1.00) |
0.0382 (1.00) |
1 (1.00) |
0.446 (1.00) |
0.809 (1.00) |
1 (1.00) |
| 7p gain | 21 (38%) | 35 |
0.519 (1.00) |
0.539 (1.00) |
0.143 (1.00) |
0.133 (1.00) |
0.565 (1.00) |
0.449 (1.00) |
0.373 (1.00) |
0.227 (1.00) |
| 7q gain | 17 (30%) | 39 |
0.424 (1.00) |
0.833 (1.00) |
0.335 (1.00) |
0.745 (1.00) |
0.685 (1.00) |
0.509 (1.00) |
0.57 (1.00) |
0.723 (1.00) |
| 8p gain | 19 (34%) | 37 |
0.0125 (1.00) |
0.718 (1.00) |
0.438 (1.00) |
0.659 (1.00) |
0.952 (1.00) |
0.299 (1.00) |
0.804 (1.00) |
0.624 (1.00) |
| 8q gain | 30 (54%) | 26 |
0.00509 (1.00) |
0.184 (1.00) |
0.0477 (1.00) |
0.309 (1.00) |
0.224 (1.00) |
0.446 (1.00) |
0.218 (1.00) |
0.116 (1.00) |
| 9p gain | 6 (11%) | 50 |
0.465 (1.00) |
0.619 (1.00) |
0.936 (1.00) |
0.358 (1.00) |
0.832 (1.00) |
0.477 (1.00) |
0.798 (1.00) |
0.71 (1.00) |
| 10p gain | 21 (38%) | 35 |
0.891 (1.00) |
0.0284 (1.00) |
0.0413 (1.00) |
0.254 (1.00) |
0.317 (1.00) |
0.808 (1.00) |
0.519 (1.00) |
0.57 (1.00) |
| 10q gain | 17 (30%) | 39 |
1 (1.00) |
0.293 (1.00) |
0.552 (1.00) |
0.311 (1.00) |
0.205 (1.00) |
0.513 (1.00) |
0.412 (1.00) |
0.216 (1.00) |
| 11p gain | 5 (9%) | 51 |
0.483 (1.00) |
0.407 (1.00) |
0.265 (1.00) |
0.515 (1.00) |
0.494 (1.00) |
1 (1.00) |
0.352 (1.00) |
1 (1.00) |
| 11q gain | 7 (12%) | 49 |
0.17 (1.00) |
0.337 (1.00) |
0.226 (1.00) |
0.605 (1.00) |
0.755 (1.00) |
0.738 (1.00) |
0.726 (1.00) |
1 (1.00) |
| 12p gain | 22 (39%) | 34 |
0.44 (1.00) |
0.00524 (1.00) |
0.376 (1.00) |
0.132 (1.00) |
0.783 (1.00) |
0.83 (1.00) |
0.762 (1.00) |
0.779 (1.00) |
| 12q gain | 11 (20%) | 45 |
0.555 (1.00) |
0.503 (1.00) |
0.805 (1.00) |
0.708 (1.00) |
1 (1.00) |
0.403 (1.00) |
0.529 (1.00) |
0.57 (1.00) |
| 13q gain | 15 (27%) | 41 |
0.663 (1.00) |
0.061 (1.00) |
0.0222 (1.00) |
0.0645 (1.00) |
0.228 (1.00) |
0.0108 (1.00) |
0.0655 (1.00) |
0.0157 (1.00) |
| 14q gain | 7 (12%) | 49 |
0.365 (1.00) |
0.475 (1.00) |
0.258 (1.00) |
0.444 (1.00) |
0.206 (1.00) |
0.0616 (1.00) |
0.213 (1.00) |
0.0355 (1.00) |
| 15q gain | 4 (7%) | 52 |
0.389 (1.00) |
0.36 (1.00) |
0.577 (1.00) |
0.503 (1.00) |
0.755 (1.00) |
0.39 (1.00) |
0.53 (1.00) |
0.643 (1.00) |
| 16p gain | 10 (18%) | 46 |
0.0396 (1.00) |
0.256 (1.00) |
0.195 (1.00) |
0.273 (1.00) |
1 (1.00) |
0.115 (1.00) |
0.716 (1.00) |
0.157 (1.00) |
| 16q gain | 6 (11%) | 50 |
0.269 (1.00) |
0.768 (1.00) |
0.547 (1.00) |
0.87 (1.00) |
0.771 (1.00) |
0.706 (1.00) |
0.917 (1.00) |
1 (1.00) |
| 17p gain | 9 (16%) | 47 |
0.215 (1.00) |
0.832 (1.00) |
0.568 (1.00) |
0.653 (1.00) |
0.285 (1.00) |
0.557 (1.00) |
0.271 (1.00) |
0.393 (1.00) |
| 17q gain | 18 (32%) | 38 |
0.88 (1.00) |
0.246 (1.00) |
0.7 (1.00) |
0.716 (1.00) |
0.394 (1.00) |
0.48 (1.00) |
0.704 (1.00) |
0.277 (1.00) |
| 18p gain | 18 (32%) | 38 |
1 (1.00) |
0.0416 (1.00) |
0.0952 (1.00) |
0.0322 (1.00) |
0.152 (1.00) |
0.621 (1.00) |
0.411 (1.00) |
0.3 (1.00) |
| 18q gain | 14 (25%) | 42 |
0.635 (1.00) |
0.111 (1.00) |
0.153 (1.00) |
0.0652 (1.00) |
0.199 (1.00) |
0.378 (1.00) |
0.21 (1.00) |
0.0518 (1.00) |
| 19p gain | 24 (43%) | 32 |
0.501 (1.00) |
0.18 (1.00) |
0.254 (1.00) |
0.826 (1.00) |
0.524 (1.00) |
0.472 (1.00) |
0.389 (1.00) |
0.3 (1.00) |
| 19q gain | 28 (50%) | 28 |
0.32 (1.00) |
0.0705 (1.00) |
0.357 (1.00) |
0.575 (1.00) |
0.891 (1.00) |
1 (1.00) |
0.535 (1.00) |
1 (1.00) |
| 20p gain | 37 (66%) | 19 |
0.906 (1.00) |
0.486 (1.00) |
0.923 (1.00) |
0.345 (1.00) |
0.852 (1.00) |
0.537 (1.00) |
0.843 (1.00) |
0.548 (1.00) |
| 20q gain | 44 (79%) | 12 |
0.493 (1.00) |
0.892 (1.00) |
0.969 (1.00) |
0.861 (1.00) |
0.582 (1.00) |
0.336 (1.00) |
0.432 (1.00) |
0.465 (1.00) |
| 21q gain | 18 (32%) | 38 |
0.207 (1.00) |
0.375 (1.00) |
0.901 (1.00) |
0.767 (1.00) |
0.882 (1.00) |
0.784 (1.00) |
1 (1.00) |
0.624 (1.00) |
| 22q gain | 8 (14%) | 48 |
0.535 (1.00) |
0.927 (1.00) |
0.804 (1.00) |
0.791 (1.00) |
0.887 (1.00) |
0.539 (1.00) |
0.852 (1.00) |
0.753 (1.00) |
| xq gain | 14 (25%) | 42 |
0.896 (1.00) |
0.453 (1.00) |
0.88 (1.00) |
0.574 (1.00) |
0.962 (1.00) |
0.56 (1.00) |
1 (1.00) |
0.63 (1.00) |
| 1p loss | 9 (16%) | 47 |
0.0519 (1.00) |
0.613 (1.00) |
0.921 (1.00) |
0.957 (1.00) |
0.111 (1.00) |
0.0169 (1.00) |
0.125 (1.00) |
0.0442 (1.00) |
| 1q loss | 9 (16%) | 47 |
0.0238 (1.00) |
0.525 (1.00) |
0.515 (1.00) |
0.49 (1.00) |
0.421 (1.00) |
0.136 (1.00) |
0.386 (1.00) |
0.292 (1.00) |
| 3p loss | 20 (36%) | 36 |
0.0711 (1.00) |
0.376 (1.00) |
0.0499 (1.00) |
0.0581 (1.00) |
0.352 (1.00) |
0.377 (1.00) |
0.603 (1.00) |
0.39 (1.00) |
| 3q loss | 14 (25%) | 42 |
0.514 (1.00) |
0.467 (1.00) |
0.137 (1.00) |
0.246 (1.00) |
0.498 (1.00) |
0.181 (1.00) |
0.653 (1.00) |
0.215 (1.00) |
| 4p loss | 31 (55%) | 25 |
0.0591 (1.00) |
0.0596 (1.00) |
0.255 (1.00) |
0.131 (1.00) |
0.042 (1.00) |
0.699 (1.00) |
0.28 (1.00) |
0.541 (1.00) |
| 5p loss | 9 (16%) | 47 |
0.712 (1.00) |
0.476 (1.00) |
0.885 (1.00) |
0.557 (1.00) |
1 (1.00) |
1 (1.00) |
1 (1.00) |
1 (1.00) |
| 5q loss | 18 (32%) | 38 |
0.88 (1.00) |
0.308 (1.00) |
0.264 (1.00) |
0.187 (1.00) |
0.36 (1.00) |
0.784 (1.00) |
0.152 (1.00) |
1 (1.00) |
| 6p loss | 5 (9%) | 51 |
0.315 (1.00) |
0.811 (1.00) |
0.755 (1.00) |
0.916 (1.00) |
0.544 (1.00) |
0.694 (1.00) |
0.745 (1.00) |
1 (1.00) |
| 6q loss | 7 (12%) | 49 |
0.0186 (1.00) |
0.577 (1.00) |
0.64 (1.00) |
0.552 (1.00) |
0.705 (1.00) |
0.0616 (1.00) |
0.726 (1.00) |
0.121 (1.00) |
| 7p loss | 13 (23%) | 43 |
0.416 (1.00) |
0.617 (1.00) |
0.736 (1.00) |
0.696 (1.00) |
0.309 (1.00) |
1 (1.00) |
0.483 (1.00) |
0.629 (1.00) |
| 7q loss | 13 (23%) | 43 |
0.0864 (1.00) |
0.826 (1.00) |
0.92 (1.00) |
0.664 (1.00) |
0.688 (1.00) |
0.56 (1.00) |
0.639 (1.00) |
1 (1.00) |
| 8p loss | 23 (41%) | 33 |
0.0273 (1.00) |
0.974 (1.00) |
0.804 (1.00) |
0.958 (1.00) |
0.666 (1.00) |
0.293 (1.00) |
0.819 (1.00) |
0.655 (1.00) |
| 8q loss | 9 (16%) | 47 |
0.187 (1.00) |
0.752 (1.00) |
0.296 (1.00) |
0.753 (1.00) |
0.95 (1.00) |
1 (1.00) |
1 (1.00) |
0.764 (1.00) |
| 9p loss | 34 (61%) | 22 |
0.0377 (1.00) |
0.0146 (1.00) |
0.66 (1.00) |
0.624 (1.00) |
0.829 (1.00) |
0.755 (1.00) |
0.826 (1.00) |
1 (1.00) |
| 9q loss | 39 (70%) | 17 |
0.0621 (1.00) |
0.00331 (1.00) |
0.493 (1.00) |
0.674 (1.00) |
0.635 (1.00) |
1 (1.00) |
0.871 (1.00) |
0.779 (1.00) |
| 10p loss | 23 (41%) | 33 |
0.859 (1.00) |
0.0126 (1.00) |
0.0304 (1.00) |
0.0575 (1.00) |
0.239 (1.00) |
0.736 (1.00) |
0.421 (1.00) |
0.825 (1.00) |
| 10q loss | 21 (38%) | 35 |
1 (1.00) |
0.296 (1.00) |
0.176 (1.00) |
0.251 (1.00) |
0.128 (1.00) |
0.755 (1.00) |
0.188 (1.00) |
0.176 (1.00) |
| 11p loss | 26 (46%) | 30 |
0.833 (1.00) |
0.00422 (1.00) |
0.377 (1.00) |
0.516 (1.00) |
0.259 (1.00) |
0.446 (1.00) |
0.241 (1.00) |
0.309 (1.00) |
| 11q loss | 24 (43%) | 32 |
0.724 (1.00) |
0.00885 (1.00) |
0.79 (1.00) |
0.86 (1.00) |
0.286 (1.00) |
0.194 (1.00) |
0.386 (1.00) |
0.366 (1.00) |
| 12p loss | 13 (23%) | 43 |
0.195 (1.00) |
0.297 (1.00) |
0.579 (1.00) |
0.804 (1.00) |
0.546 (1.00) |
0.103 (1.00) |
0.274 (1.00) |
0.328 (1.00) |
| 12q loss | 14 (25%) | 42 |
0.5 (1.00) |
0.854 (1.00) |
0.82 (1.00) |
1 (1.00) |
0.958 (1.00) |
0.181 (1.00) |
0.456 (1.00) |
0.361 (1.00) |
| 13q loss | 26 (46%) | 30 |
0.775 (1.00) |
0.00156 (0.957) |
0.0567 (1.00) |
0.104 (1.00) |
0.356 (1.00) |
0.193 (1.00) |
0.251 (1.00) |
0.107 (1.00) |
| 14q loss | 27 (48%) | 29 |
1 (1.00) |
0.0995 (1.00) |
0.114 (1.00) |
0.217 (1.00) |
0.569 (1.00) |
0.598 (1.00) |
0.575 (1.00) |
1 (1.00) |
| 15q loss | 32 (57%) | 24 |
0.00613 (1.00) |
0.693 (1.00) |
0.893 (1.00) |
0.757 (1.00) |
0.871 (1.00) |
0.765 (1.00) |
0.881 (1.00) |
0.825 (1.00) |
| 16p loss | 32 (57%) | 24 |
0.35 (1.00) |
0.465 (1.00) |
0.324 (1.00) |
0.189 (1.00) |
0.789 (1.00) |
0.519 (1.00) |
0.881 (1.00) |
0.467 (1.00) |
| 16q loss | 37 (66%) | 19 |
0.318 (1.00) |
0.768 (1.00) |
0.449 (1.00) |
0.392 (1.00) |
0.692 (1.00) |
0.784 (1.00) |
0.359 (1.00) |
0.779 (1.00) |
| 17p loss | 34 (61%) | 22 |
0.397 (1.00) |
0.278 (1.00) |
0.958 (1.00) |
0.884 (1.00) |
0.785 (1.00) |
1 (1.00) |
0.42 (1.00) |
0.671 (1.00) |
| 17q loss | 17 (30%) | 39 |
0.893 (1.00) |
0.331 (1.00) |
0.715 (1.00) |
0.257 (1.00) |
0.903 (1.00) |
0.451 (1.00) |
0.766 (1.00) |
1 (1.00) |
| 18p loss | 18 (32%) | 38 |
0.556 (1.00) |
0.0127 (1.00) |
0.0535 (1.00) |
0.0356 (1.00) |
0.0634 (1.00) |
0.197 (1.00) |
0.313 (1.00) |
0.0514 (1.00) |
| 18q loss | 20 (36%) | 36 |
0.212 (1.00) |
0.054 (1.00) |
0.181 (1.00) |
0.0272 (1.00) |
0.013 (1.00) |
0.0122 (1.00) |
0.0634 (1.00) |
0.00158 (0.972) |
| 19p loss | 15 (27%) | 41 |
0.914 (1.00) |
0.427 (1.00) |
0.203 (1.00) |
0.103 (1.00) |
0.313 (1.00) |
1 (1.00) |
0.713 (1.00) |
1 (1.00) |
| 19q loss | 13 (23%) | 43 |
1 (1.00) |
0.112 (1.00) |
0.945 (1.00) |
0.784 (1.00) |
0.232 (1.00) |
0.704 (1.00) |
0.693 (1.00) |
0.629 (1.00) |
| 20p loss | 7 (12%) | 49 |
0.429 (1.00) |
0.257 (1.00) |
0.0816 (1.00) |
0.0871 (1.00) |
0.617 (1.00) |
0.738 (1.00) |
0.726 (1.00) |
0.503 (1.00) |
| 20q loss | 4 (7%) | 52 |
1 (1.00) |
0.523 (1.00) |
0.117 (1.00) |
0.454 (1.00) |
1 (1.00) |
1 (1.00) |
1 (1.00) |
1 (1.00) |
| 21q loss | 17 (30%) | 39 |
0.843 (1.00) |
0.187 (1.00) |
0.632 (1.00) |
0.873 (1.00) |
0.637 (1.00) |
0.733 (1.00) |
1 (1.00) |
1 (1.00) |
| 22q loss | 33 (59%) | 23 |
0.859 (1.00) |
0.969 (1.00) |
0.94 (1.00) |
1 (1.00) |
0.708 (1.00) |
0.242 (1.00) |
0.607 (1.00) |
0.305 (1.00) |
| xq loss | 19 (34%) | 37 |
0.44 (1.00) |
0.299 (1.00) |
0.326 (1.00) |
0.541 (1.00) |
0.53 (1.00) |
1 (1.00) |
0.543 (1.00) |
1 (1.00) |
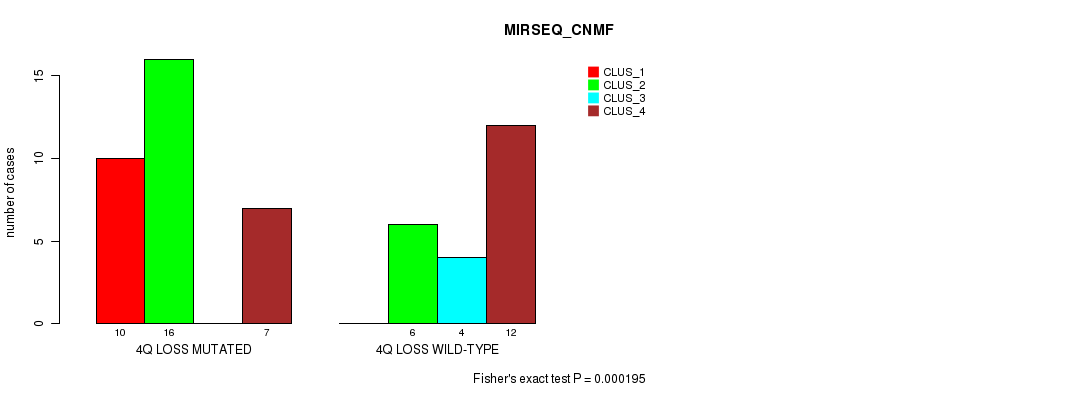
P value = 0.000195 (Fisher's exact test), Q value = 0.12
Table S1. Gene #45: '4q loss' versus Molecular Subtype #5: 'MIRSEQ_CNMF'
| nPatients | CLUS_1 | CLUS_2 | CLUS_3 | CLUS_4 |
|---|---|---|---|---|
| ALL | 10 | 22 | 4 | 19 |
| 4Q LOSS MUTATED | 10 | 16 | 0 | 7 |
| 4Q LOSS WILD-TYPE | 0 | 6 | 4 | 12 |
Figure S1. Get High-res Image Gene #45: '4q loss' versus Molecular Subtype #5: 'MIRSEQ_CNMF'
-
Copy number data file = transformed.cor.cli.txt
-
Molecular subtypes file = UCS-TP.transferedmergedcluster.txt
-
Number of patients = 56
-
Number of significantly arm-level cnvs = 77
-
Number of molecular subtypes = 8
-
Exclude genes that fewer than K tumors have mutations, K = 3
For binary or multi-class clinical features (nominal or ordinal), two-tailed Fisher's exact tests (Fisher 1922) were used to estimate the P values using the 'fisher.test' function in R
For multi-class clinical features (nominal or ordinal), Chi-square tests (Greenwood and Nikulin 1996) were used to estimate the P values using the 'chisq.test' function in R
For multiple hypothesis correction, Q value is the False Discovery Rate (FDR) analogue of the P value (Benjamini and Hochberg 1995), defined as the minimum FDR at which the test may be called significant. We used the 'Benjamini and Hochberg' method of 'p.adjust' function in R to convert P values into Q values.
In addition to the links below, the full results of the analysis summarized in this report can also be downloaded programmatically using firehose_get, or interactively from either the Broad GDAC website or TCGA Data Coordination Center Portal.