This report serves to describe the mutational landscape and properties of a given individual set, as well as rank genes and genesets according to mutational significance. MutSig v2.0 and MutSigCV v0.9 merged result was used to generate the results found in this report.
-
Working with individual set: UCS-TP
-
Number of patients in set: 57
The input for this pipeline is a set of individuals with the following files associated for each:
-
An annotated .maf file describing the mutations called for the respective individual, and their properties.
-
A .wig file that contains information about the coverage of the sample.
-
MAF used for this analysis:UCS-TP.final_analysis_set.maf
-
Blacklist used for this analysis: pancan_mutation_blacklist.v14.hg19.txt
-
Significantly mutated genes (q ≤ 0.1): 8
-
Mutations seen in COSMIC: 139
-
Significantly mutated genes in COSMIC territory: 13
-
Significantly mutated genesets: 104
-
Read 57 MAFs of type "Broad"
-
Total number of mutations in input MAFs: 11339
-
After removing 78 mutations outside chr1-24: 11261
-
After removing 432 blacklisted mutations: 10829
-
After removing 889 noncoding mutations: 9940
-
Number of mutations before filtering: 9940
-
After removing 511 mutations outside gene set: 9429
-
After removing 38 mutations outside category set: 9391
Table 1. Get Full Table Table representing breakdown of mutations by type.
| type | count |
|---|---|
| Frame_Shift_Del | 241 |
| Frame_Shift_Ins | 81 |
| In_Frame_Del | 66 |
| In_Frame_Ins | 10 |
| Missense_Mutation | 6146 |
| Nonsense_Mutation | 592 |
| Nonstop_Mutation | 13 |
| Silent | 1922 |
| Splice_Site | 284 |
| Translation_Start_Site | 36 |
| Total | 9391 |
Table 2. Get Full Table A breakdown of mutation rates per category discovered for this individual set.
| category | n | N | rate | rate_per_mb | relative_rate | exp_ns_s_ratio |
|---|---|---|---|---|---|---|
| *CpG->T | 1706 | 95243737 | 0.000018 | 18 | 4 | 2.1 |
| *Cp(A/C/T)->T | 829 | 765648006 | 1.1e-06 | 1.1 | 0.24 | 1.7 |
| C->(G/A) | 1893 | 860891743 | 2.2e-06 | 2.2 | 0.49 | 4.7 |
| A->mut | 1752 | 819427697 | 2.1e-06 | 2.1 | 0.48 | 3.9 |
| indel+null | 1257 | 1680319440 | 7.5e-07 | 0.75 | 0.17 | NaN |
| double_null | 32 | 1680319440 | 1.9e-08 | 0.019 | 0.0043 | NaN |
| Total | 7469 | 1680319440 | 4.4e-06 | 4.4 | 1 | 3.5 |
The x axis represents the samples. The y axis represents the exons, one row per exon, and they are sorted by average coverage across samples. For exons with exactly the same average coverage, they are sorted next by the %GC of the exon. (The secondary sort is especially useful for the zero-coverage exons at the bottom). If the figure is unpopulated, then full coverage is assumed (e.g. MutSig CV doesn't use WIGs and assumes full coverage).
Figure 1.
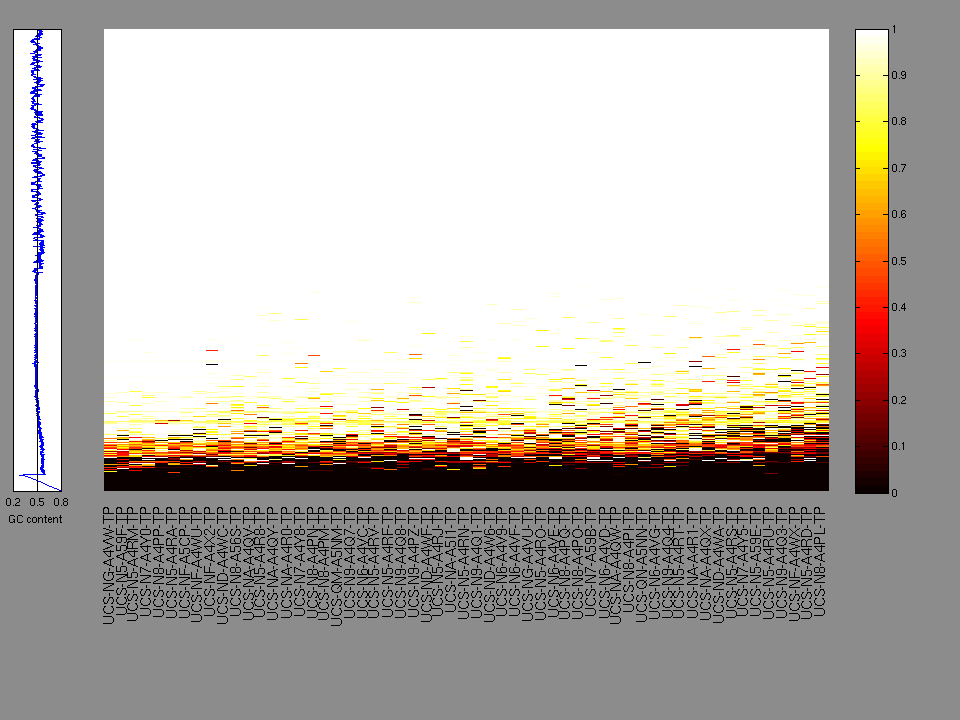
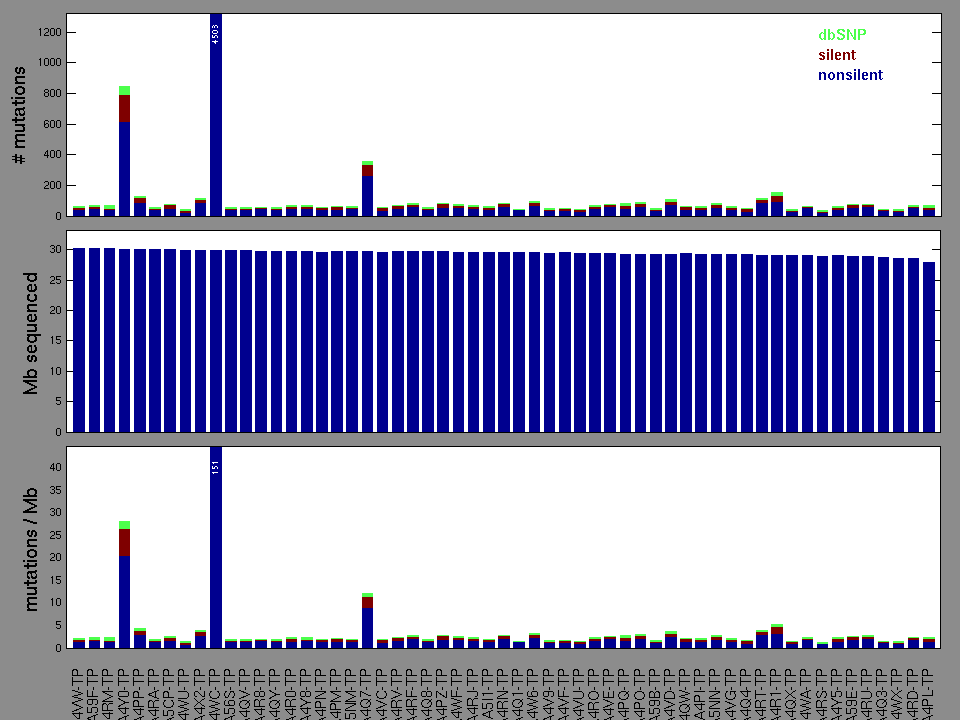
Figure 2. Patients counts and rates file used to generate this plot: UCS-TP.patients.counts_and_rates.txt
The mutation spectrum is depicted in the lego plots below in which the 96 possible mutation types are subdivided into six large blocks, color-coded to reflect the base substitution type. Each large block is further subdivided into the 16 possible pairs of 5' and 3' neighbors, as listed in the 4x4 trinucleotide context legend. The height of each block corresponds to the mutation frequency for that kind of mutation (counts of mutations normalized by the base coverage in a given bin). The shape of the spectrum is a signature for dominant mutational mechanisms in different tumor types.
Figure 3. Get High-res Image SNV Mutation rate lego plot for entire set. Each bin is normalized by base coverage for that bin. Colors represent the six SNV types on the upper right. The three-base context for each mutation is labeled in the 4x4 legend on the lower right. The fractional breakdown of SNV counts is shown in the pie chart on the upper left. If this figure is blank, not enough information was provided in the MAF to generate it.
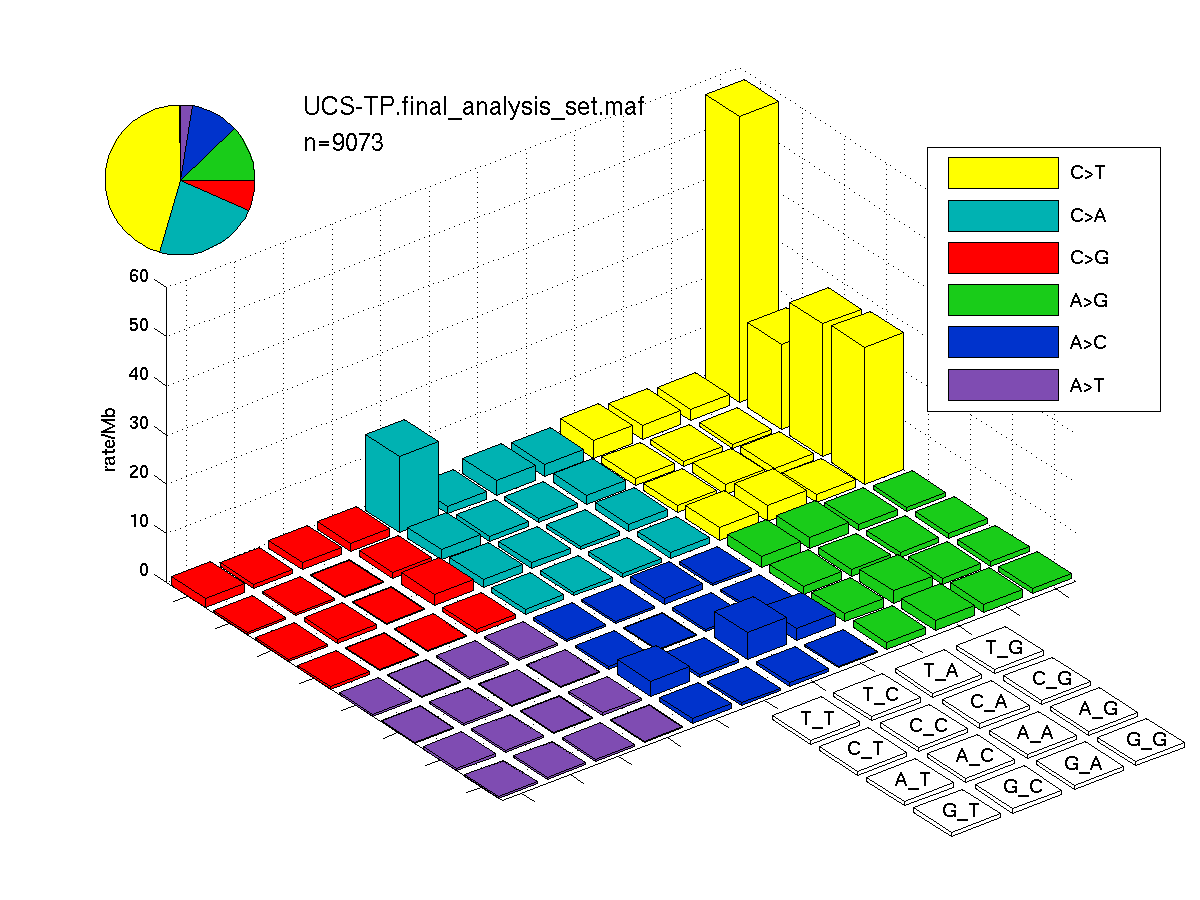
Figure 4. Get High-res Image SNV Mutation rate lego plots for 4 slices of mutation allele fraction (0<=AF<0.1, 0.1<=AF<0.25, 0.25<=AF<0.5, & 0.5<=AF) . The color code and three-base context legends are the same as the previous figure. If this figure is blank, not enough information was provided in the MAF to generate it.
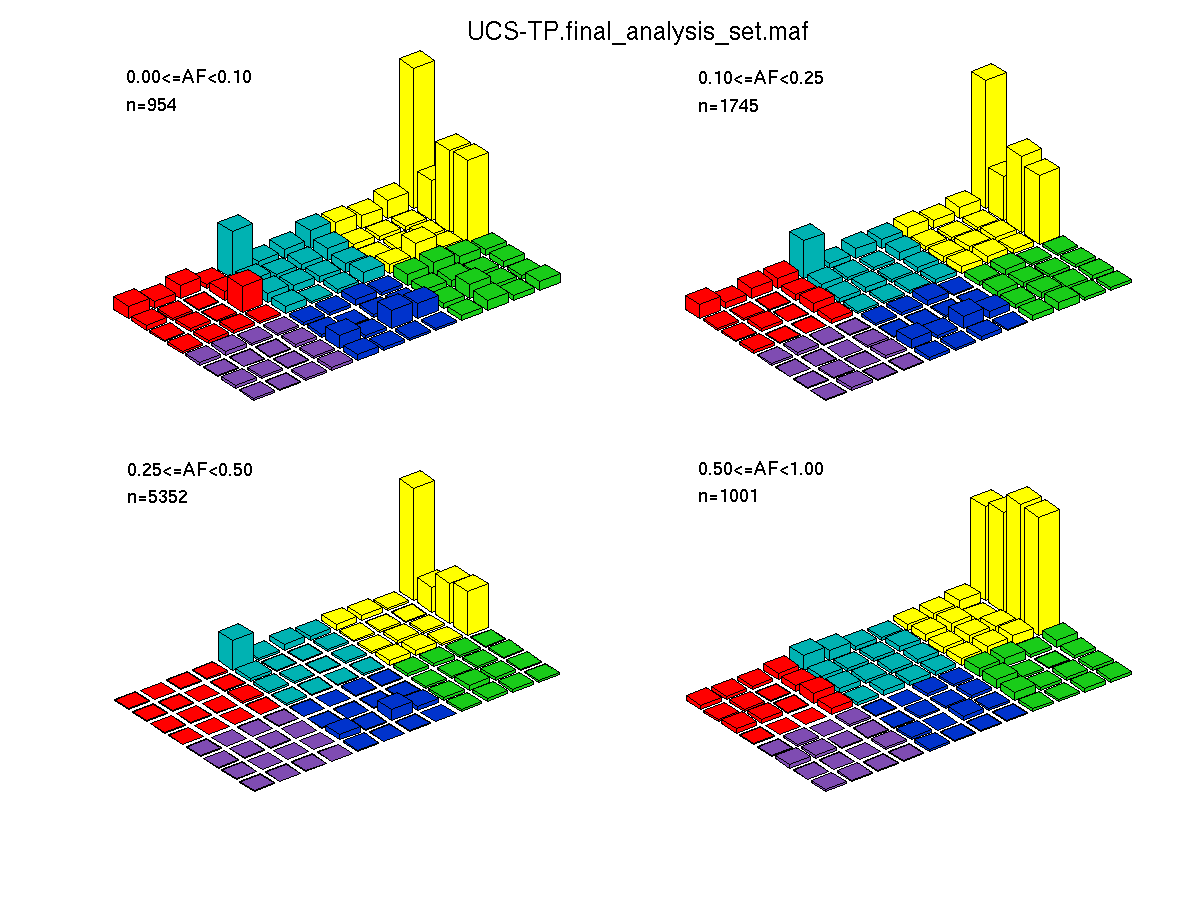
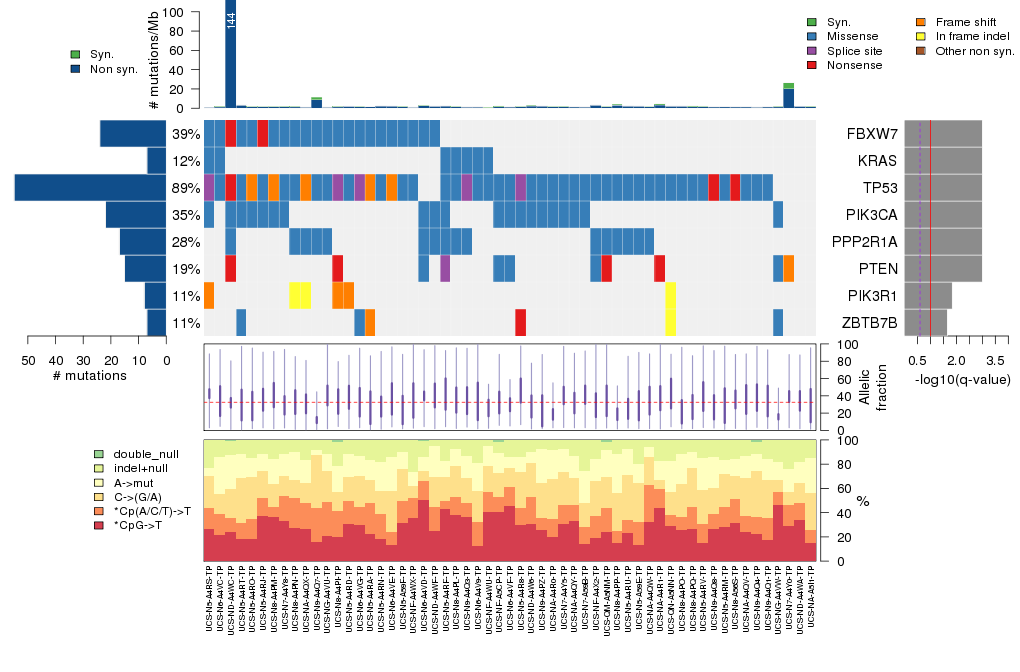
Figure 5. Get High-res Image The matrix in the center of the figure represents individual mutations in patient samples, color-coded by type of mutation, for the significantly mutated genes. The rate of synonymous and non-synonymous mutations is displayed at the top of the matrix. The barplot on the left of the matrix shows the number of mutations in each gene. The percentages represent the fraction of tumors with at least one mutation in the specified gene. The barplot to the right of the matrix displays the q-values for the most significantly mutated genes. The purple boxplots below the matrix (only displayed if required columns are present in the provided MAF) represent the distributions of allelic fractions observed in each sample. The plot at the bottom represents the base substitution distribution of individual samples, using the same categories that were used to calculate significance.
Column Descriptions:
-
N = number of sequenced bases in this gene across the individual set
-
n = number of (nonsilent) mutations in this gene across the individual set
-
npat = number of patients (individuals) with at least one nonsilent mutation
-
nsite = number of unique sites having a non-silent mutation
-
nsil = number of silent mutations in this gene across the individual set
-
n1 = number of nonsilent mutations of type: *CpG->T
-
n2 = number of nonsilent mutations of type: *Cp(A/C/T)->T
-
n3 = number of nonsilent mutations of type: C->(G/A)
-
n4 = number of nonsilent mutations of type: A->mut
-
n5 = number of nonsilent mutations of type: indel+null
-
n6 = number of nonsilent mutations of type: double_null
-
p_cons = p-value for enrichment of mutations at evolutionarily most-conserved sites in gene
-
p_joint = p-value for clustering + conservation
-
p = p-value (overall)
-
q = q-value, False Discovery Rate (Benjamini-Hochberg procedure)
Table 3. Get Full Table A Ranked List of Significantly Mutated Genes. Number of significant genes found: 8. Number of genes displayed: 35. Click on a gene name to display its stick figure depicting the distribution of mutations and mutation types across the chosen gene (this feature may not be available for all significant genes).
| rank | gene | description | N | n | npat | nsite | nsil | n1 | n2 | n3 | n4 | n5 | n6 | p_clust | p_cons | p_joint | p_cv | p | q |
|---|---|---|---|---|---|---|---|---|---|---|---|---|---|---|---|---|---|---|---|
| 1 | FBXW7 | F-box and WD repeat domain containing 7 | 139842 | 24 | 22 | 15 | 0 | 12 | 4 | 5 | 1 | 2 | 0 | 2e-07 | 0.001 | 0 | 4.3e-15 | 0 | 0 |
| 2 | KRAS | v-Ki-ras2 Kirsten rat sarcoma viral oncogene homolog | 36696 | 7 | 7 | 2 | 0 | 0 | 2 | 5 | 0 | 0 | 0 | 0 | 0.047 | 0 | 0.52 | 0 | 0 |
| 3 | TP53 | tumor protein p53 | 68846 | 55 | 51 | 43 | 0 | 14 | 5 | 11 | 12 | 12 | 1 | 0 | 0 | 0 | 7.8e-16 | 0 | 0 |
| 4 | PIK3CA | phosphoinositide-3-kinase, catalytic, alpha polypeptide | 186411 | 22 | 20 | 13 | 0 | 3 | 5 | 4 | 10 | 0 | 0 | 0.012 | 0.0027 | 0.00074 | 4.4e-11 | 1e-12 | 4.7e-09 |
| 5 | PPP2R1A | protein phosphatase 2 (formerly 2A), regulatory subunit A , alpha isoform | 99487 | 17 | 16 | 10 | 0 | 7 | 3 | 7 | 0 | 0 | 0 | 0.000055 | 0.018 | 0.000029 | 2.4e-08 | 2e-11 | 7.2e-08 |
| 6 | PTEN | phosphatase and tensin homolog (mutated in multiple advanced cancers 1) | 64171 | 15 | 11 | 14 | 0 | 1 | 2 | 4 | 2 | 5 | 1 | 0.15 | 0.73 | 0.28 | 1.3e-10 | 9.3e-10 | 2.8e-06 |
| 7 | PIK3R1 | phosphoinositide-3-kinase, regulatory subunit 1 (alpha) | 134194 | 8 | 6 | 8 | 0 | 0 | 1 | 0 | 0 | 7 | 0 | 0.02 | 0.56 | 0.042 | 7.9e-06 | 5.2e-06 | 0.013 |
| 8 | ZBTB7B | zinc finger and BTB domain containing 7B | 92321 | 7 | 6 | 7 | 0 | 1 | 0 | 2 | 1 | 3 | 0 | 0.38 | 0.022 | 0.077 | 7.8e-06 | 9.2e-06 | 0.021 |
| 9 | RB1 | retinoblastoma 1 (including osteosarcoma) | 133287 | 6 | 6 | 6 | 0 | 0 | 0 | 0 | 1 | 4 | 1 | 0.78 | 0.7 | 1 | 7.2e-06 | 0.000092 | 0.18 |
| 10 | BCL2L11 | BCL2-like 11 (apoptosis facilitator) | 34712 | 2 | 2 | 1 | 0 | 0 | 0 | 0 | 0 | 2 | 0 | 0.012 | 0.096 | 0.062 | 0.0011 | 0.00073 | 1 |
| 11 | CHD4 | chromodomain helicase DNA binding protein 4 | 336006 | 12 | 10 | 12 | 0 | 2 | 1 | 0 | 6 | 3 | 0 | 0.089 | 0.037 | 0.053 | 0.002 | 0.0011 | 1 |
| 12 | SPOP | speckle-type POZ protein | 66102 | 5 | 4 | 5 | 0 | 1 | 0 | 2 | 2 | 0 | 0 | 0.018 | 0.12 | 0.022 | 0.0088 | 0.0018 | 1 |
| 13 | HCFC1R1 | host cell factor C1 regulator 1 (XPO1 dependent) | 18746 | 2 | 2 | 2 | 0 | 0 | 0 | 0 | 0 | 2 | 0 | 0.21 | 0.61 | 0.35 | 0.0009 | 0.0029 | 1 |
| 14 | FAM92B | family with sequence similarity 92, member B | 52370 | 3 | 3 | 3 | 0 | 0 | 1 | 1 | 0 | 1 | 0 | 0.35 | 0.015 | 0.044 | 0.0079 | 0.0031 | 1 |
| 15 | NDUFAF2 | NADH dehydrogenase (ubiquinone) 1 alpha subcomplex, assembly factor 2 | 23615 | 3 | 3 | 1 | 0 | 3 | 0 | 0 | 0 | 0 | 0 | NaN | NaN | NaN | 0.0042 | 0.0042 | 1 |
| 16 | CDK11A | cyclin-dependent kinase 11A | 72275 | 3 | 2 | 3 | 0 | 1 | 0 | 1 | 1 | 0 | 0 | 0.0036 | 0.022 | 0.00062 | 0.93 | 0.0049 | 1 |
| 17 | YARS | tyrosyl-tRNA synthetase | 92520 | 3 | 3 | 3 | 0 | 1 | 0 | 2 | 0 | 0 | 0 | 0.0018 | 0.3 | 0.0022 | 0.32 | 0.0059 | 1 |
| 18 | TBXAS1 | thromboxane A synthase 1 (platelet, cytochrome P450, family 5, subfamily A) | 94215 | 2 | 2 | 2 | 0 | 0 | 0 | 0 | 0 | 2 | 0 | 0.13 | 0.088 | 0.075 | 0.011 | 0.0066 | 1 |
| 19 | LYPLA2 | lysophospholipase II | 41440 | 3 | 3 | 3 | 0 | 0 | 0 | 1 | 0 | 2 | 0 | 1 | 0.8 | 1 | 0.001 | 0.0081 | 1 |
| 20 | GPRASP1 | G protein-coupled receptor associated sorting protein 1 | 238270 | 4 | 4 | 4 | 1 | 1 | 1 | 1 | 0 | 1 | 0 | 0.0015 | 0.31 | 0.004 | 0.26 | 0.0082 | 1 |
| 21 | MYOZ1 | myozenin 1 | 52440 | 2 | 2 | 2 | 0 | 0 | 0 | 0 | 0 | 2 | 0 | 0.012 | 0.89 | 0.28 | 0.004 | 0.0087 | 1 |
| 22 | UBE2G1 | ubiquitin-conjugating enzyme E2G 1 (UBC7 homolog, yeast) | 28206 | 2 | 2 | 2 | 0 | 0 | 1 | 0 | 0 | 1 | 0 | 0.4 | 0.89 | 0.43 | 0.0031 | 0.01 | 1 |
| 23 | NUDT14 | nudix (nucleoside diphosphate linked moiety X)-type motif 14 | 34351 | 2 | 2 | 2 | 0 | 1 | 0 | 0 | 0 | 1 | 0 | NaN | NaN | NaN | 0.01 | 0.01 | 1 |
| 24 | U2AF1 | U2 small nuclear RNA auxiliary factor 1 | 46802 | 2 | 2 | 1 | 0 | 0 | 2 | 0 | 0 | 0 | 0 | 0.016 | 0.0084 | 0.031 | 0.059 | 0.013 | 1 |
| 25 | TEX15 | testis expressed 15 | 468146 | 3 | 1 | 3 | 0 | 0 | 0 | 0 | 3 | 0 | 0 | 0.25 | 0.0015 | 0.0022 | 1 | 0.016 | 1 |
| 26 | HMGN2 | high-mobility group nucleosomal binding domain 2 | 15466 | 1 | 1 | 1 | 0 | 0 | 0 | 0 | 0 | 1 | 0 | NaN | NaN | NaN | 0.017 | 0.017 | 1 |
| 27 | LYRM2 | LYR motif containing 2 | 14424 | 1 | 1 | 1 | 0 | 0 | 0 | 0 | 0 | 1 | 0 | NaN | NaN | NaN | 0.017 | 0.017 | 1 |
| 28 | C22orf24 | chromosome 22 open reading frame 24 | 13532 | 1 | 1 | 1 | 0 | 0 | 0 | 0 | 0 | 1 | 0 | NaN | NaN | NaN | 0.017 | 0.017 | 1 |
| 29 | HBA1 | hemoglobin, alpha 1 | 13301 | 1 | 1 | 1 | 0 | 0 | 0 | 0 | 0 | 1 | 0 | NaN | NaN | NaN | 0.018 | 0.018 | 1 |
| 30 | ZFP36L1 | zinc finger protein 36, C3H type-like 1 | 58312 | 2 | 2 | 2 | 0 | 0 | 0 | 0 | 0 | 2 | 0 | 0.92 | 0.24 | 0.71 | 0.004 | 0.019 | 1 |
| 31 | CTCFL | CCCTC-binding factor (zinc finger protein)-like | 115824 | 2 | 2 | 2 | 0 | 0 | 0 | 0 | 1 | 1 | 0 | 0.025 | 0.029 | 0.019 | 0.15 | 0.02 | 1 |
| 32 | OSTN | osteocrin | 23471 | 2 | 2 | 2 | 0 | 0 | 1 | 0 | 0 | 1 | 0 | 0.78 | 0.35 | 0.55 | 0.0052 | 0.02 | 1 |
| 33 | LYL1 | lymphoblastic leukemia derived sequence 1 | 11886 | 1 | 1 | 1 | 0 | 0 | 0 | 0 | 0 | 1 | 0 | NaN | NaN | NaN | 0.021 | 0.021 | 1 |
| 34 | IER3 | immediate early response 3 | 22580 | 1 | 1 | 1 | 0 | 0 | 0 | 0 | 0 | 1 | 0 | NaN | NaN | NaN | 0.022 | 0.022 | 1 |
| 35 | SPANXN1 | SPANX family, member N1 | 12939 | 1 | 1 | 1 | 1 | 0 | 0 | 0 | 0 | 1 | 0 | NaN | NaN | NaN | 0.022 | 0.022 | 1 |
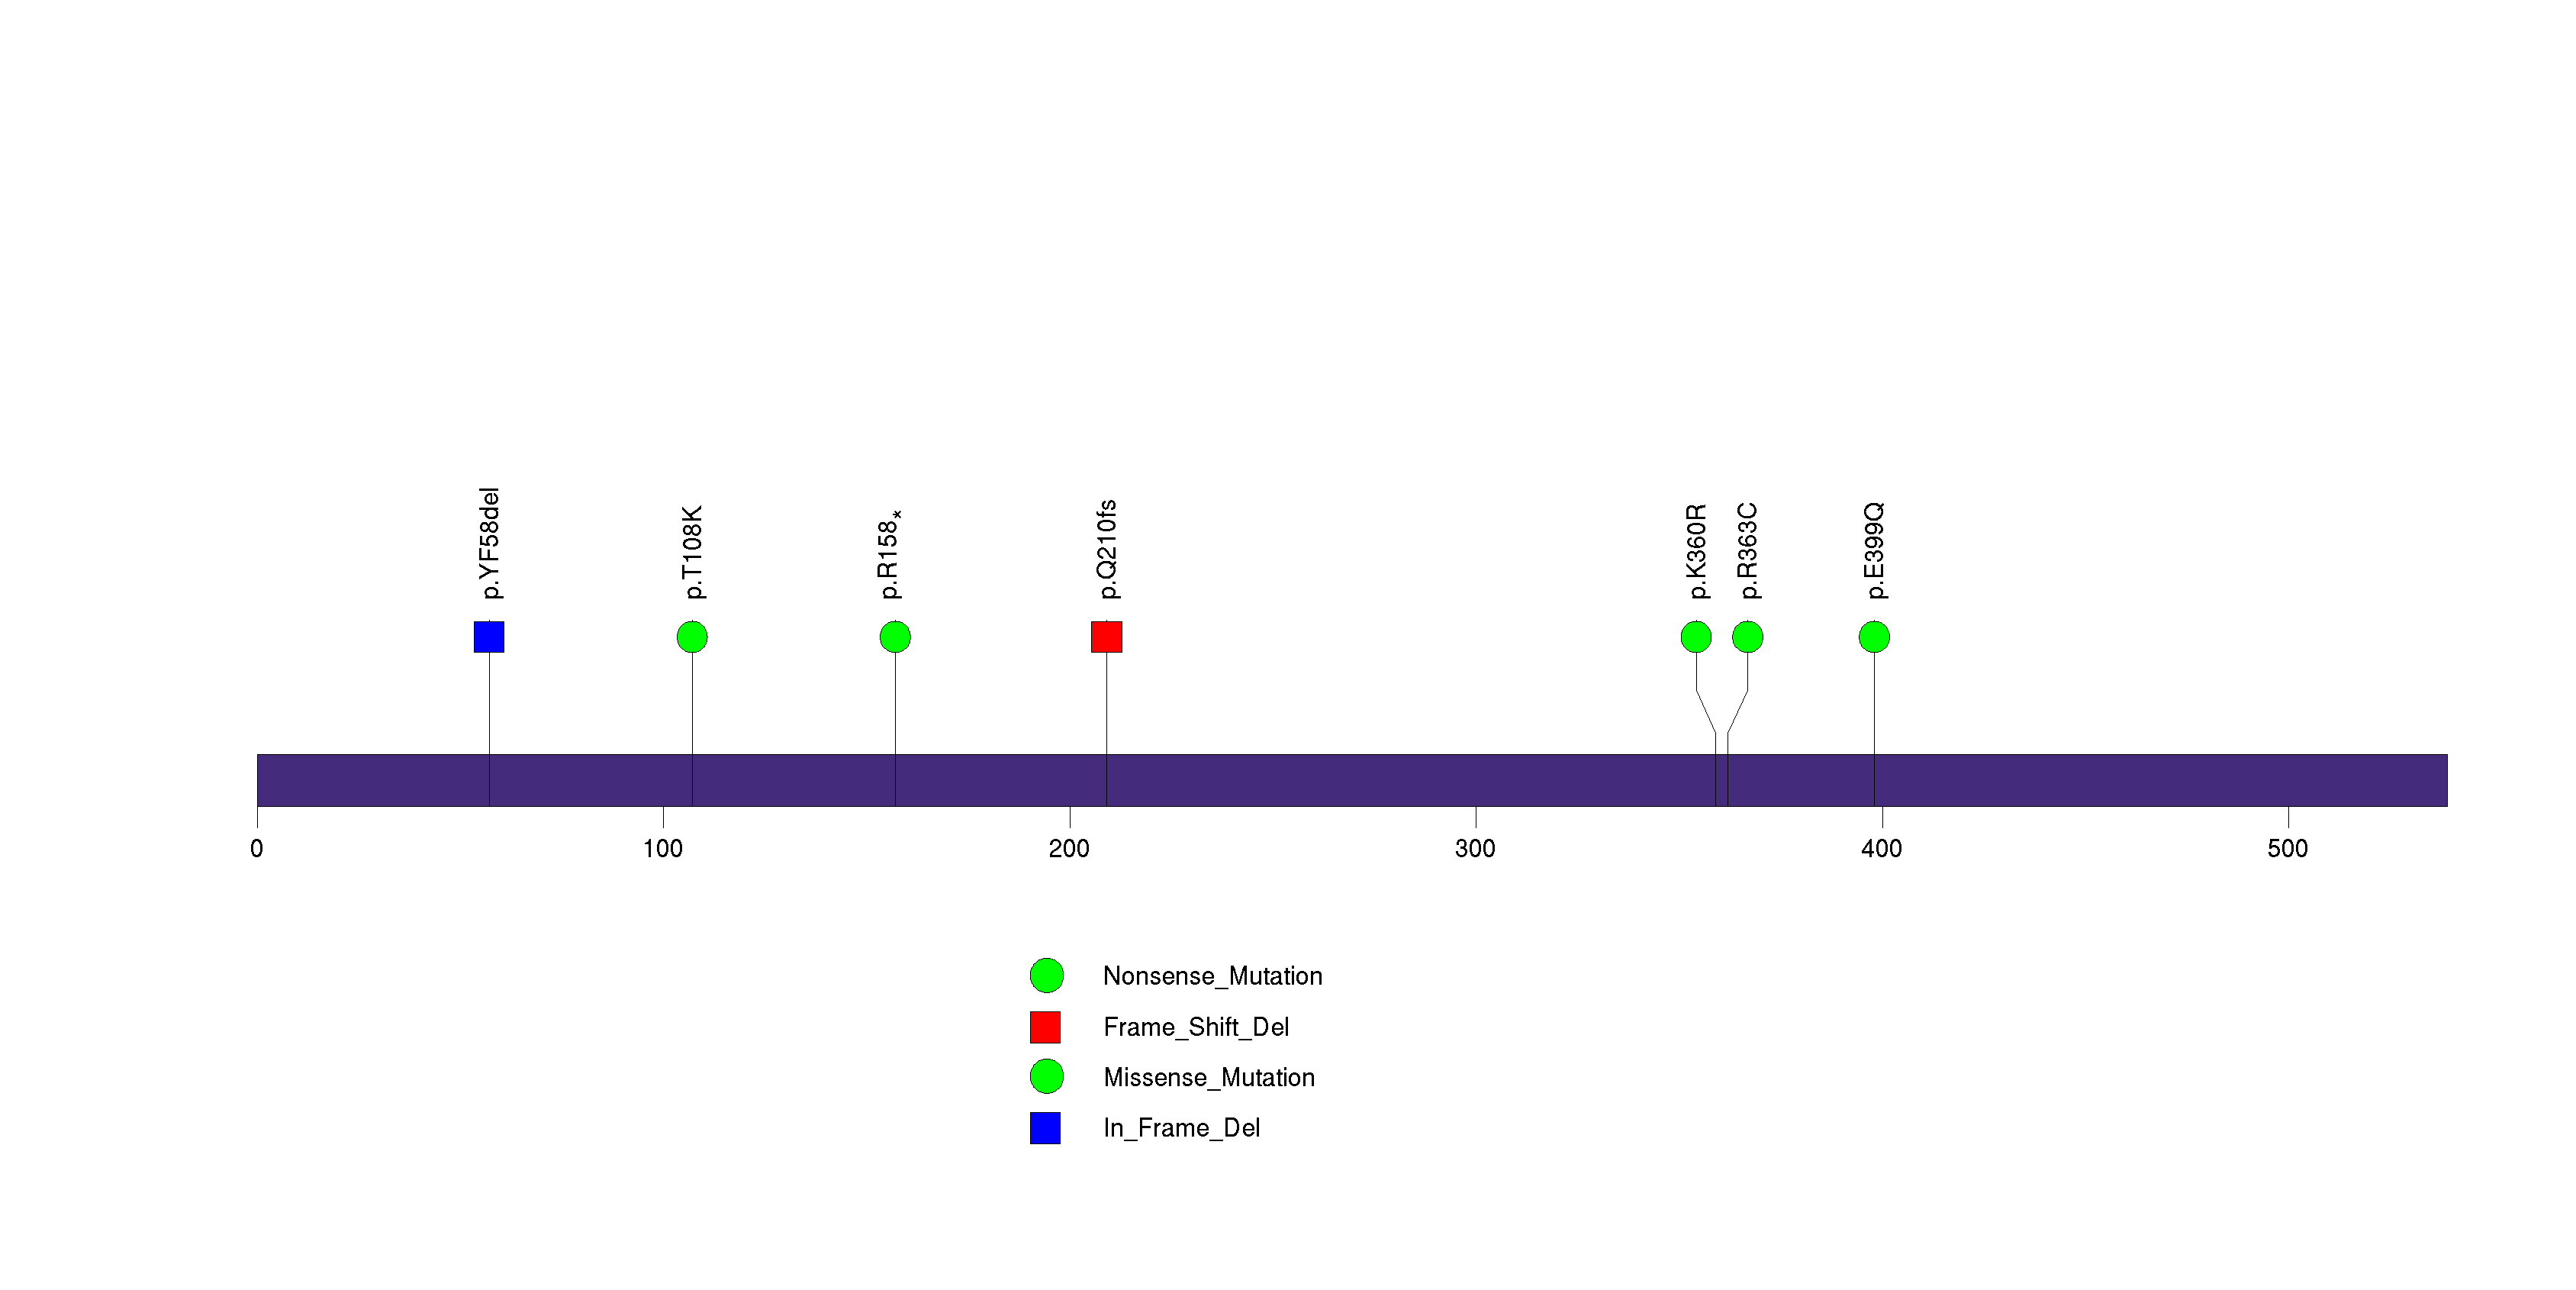
Figure S1. This figure depicts the distribution of mutations and mutation types across the FBXW7 significant gene.
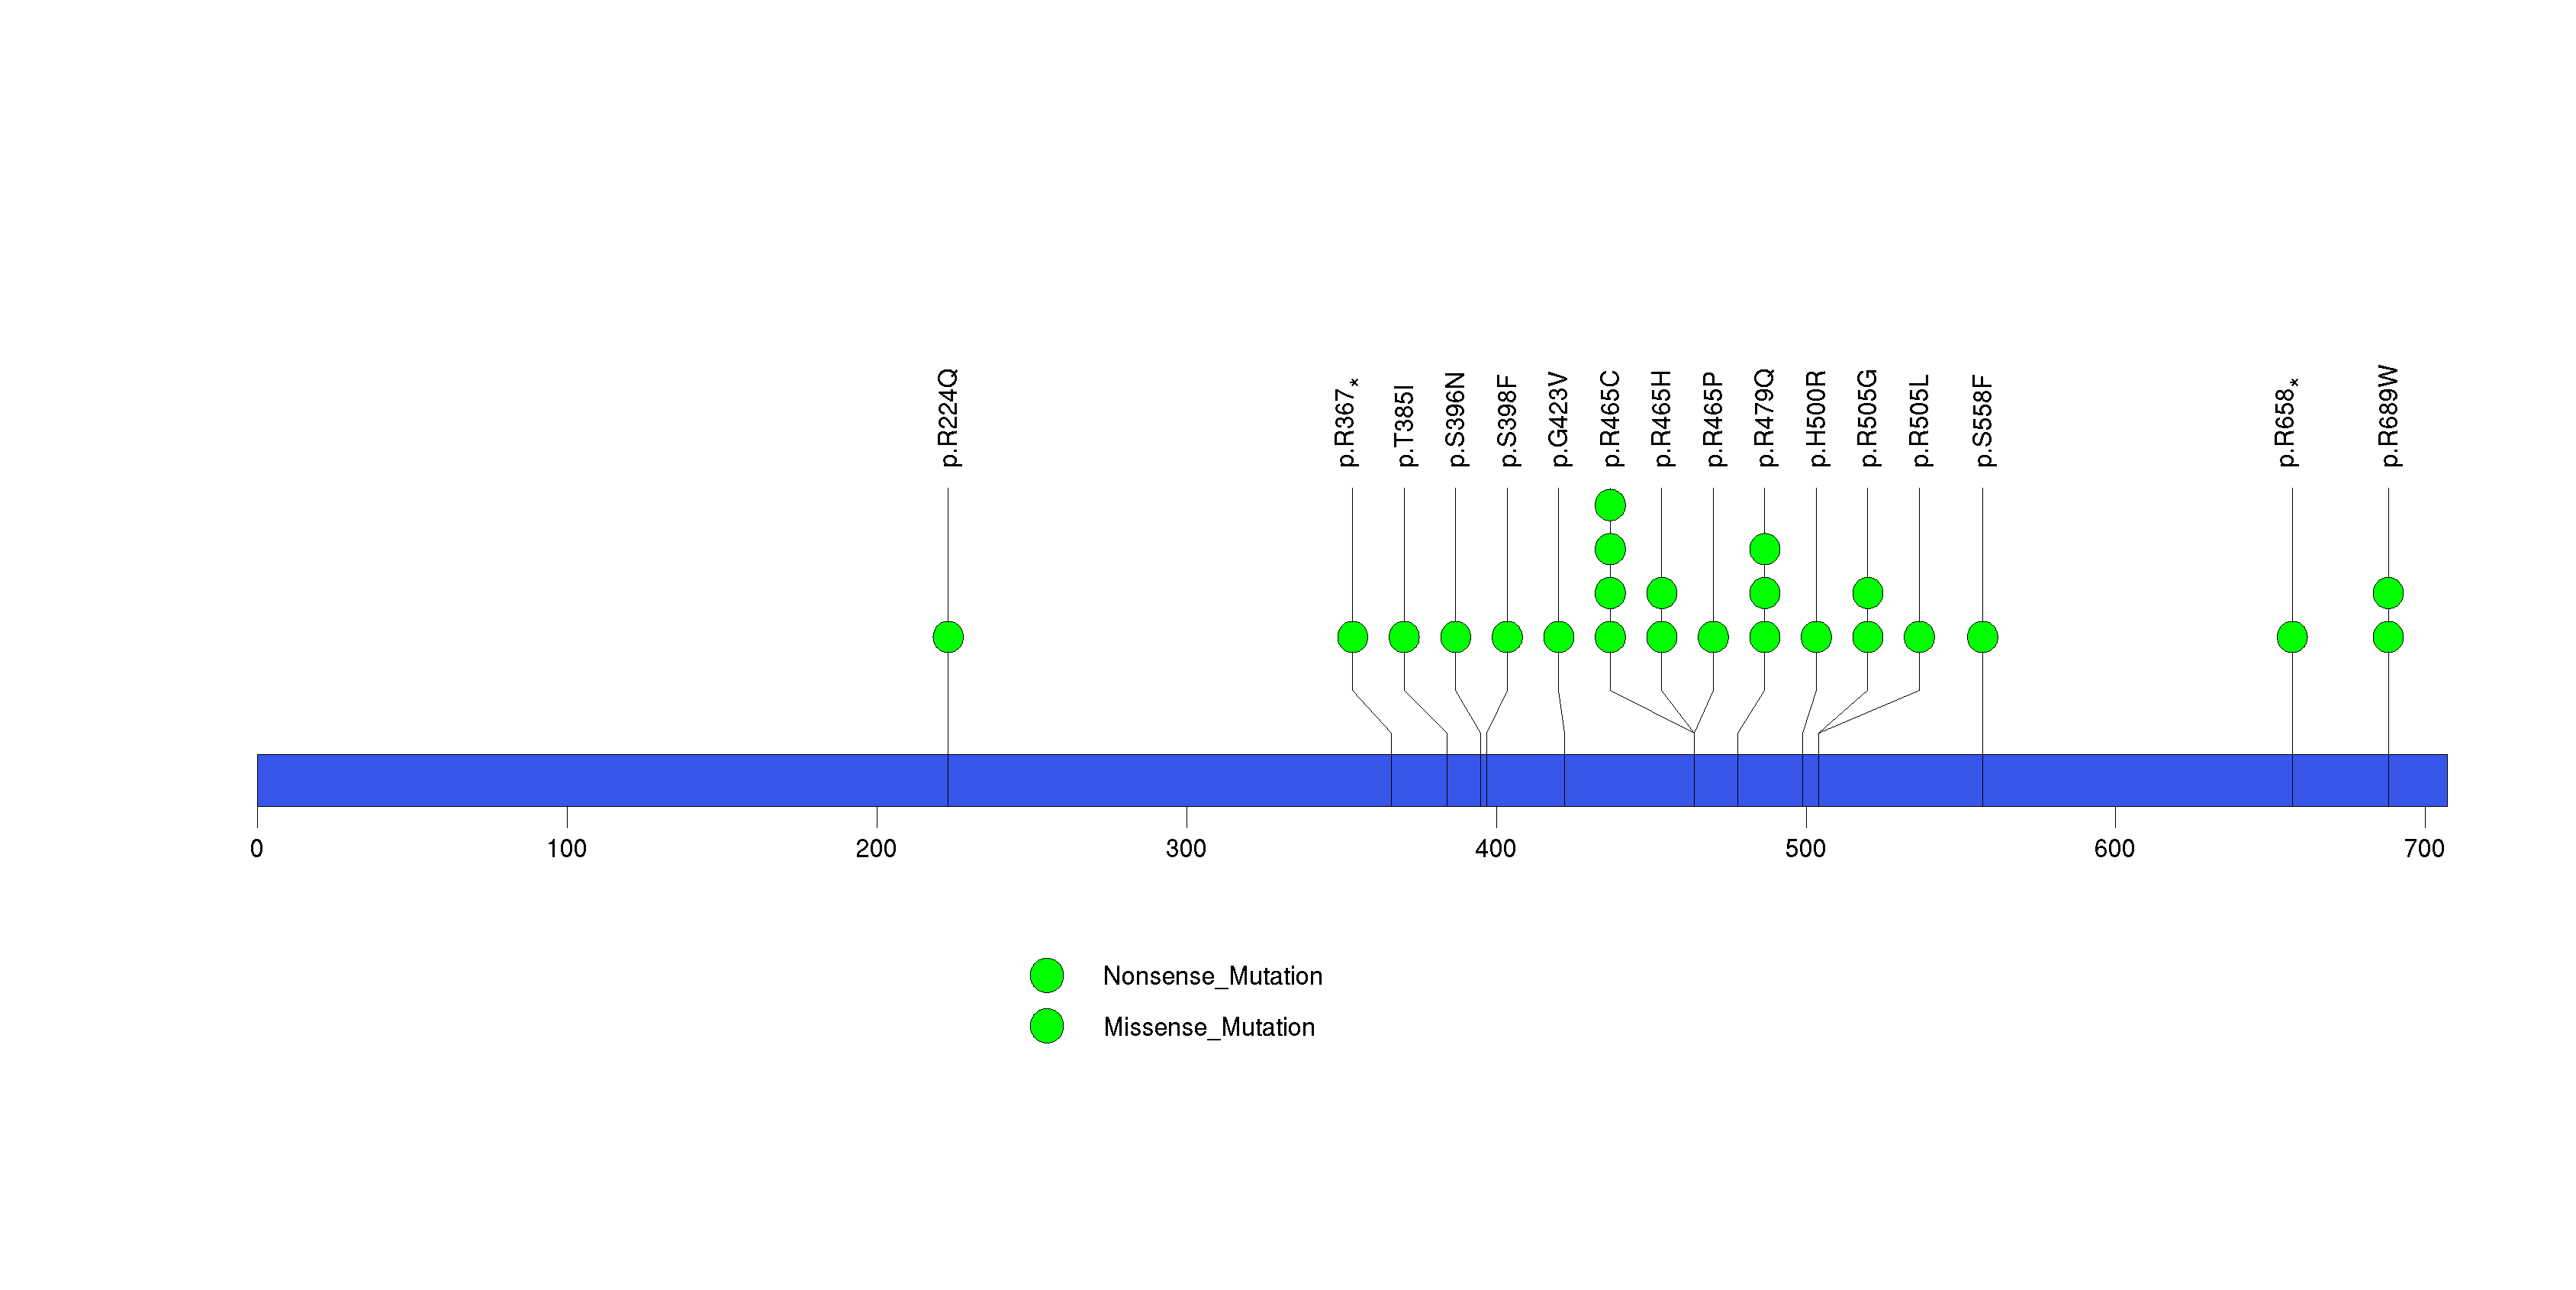
Figure S2. This figure depicts the distribution of mutations and mutation types across the KRAS significant gene.
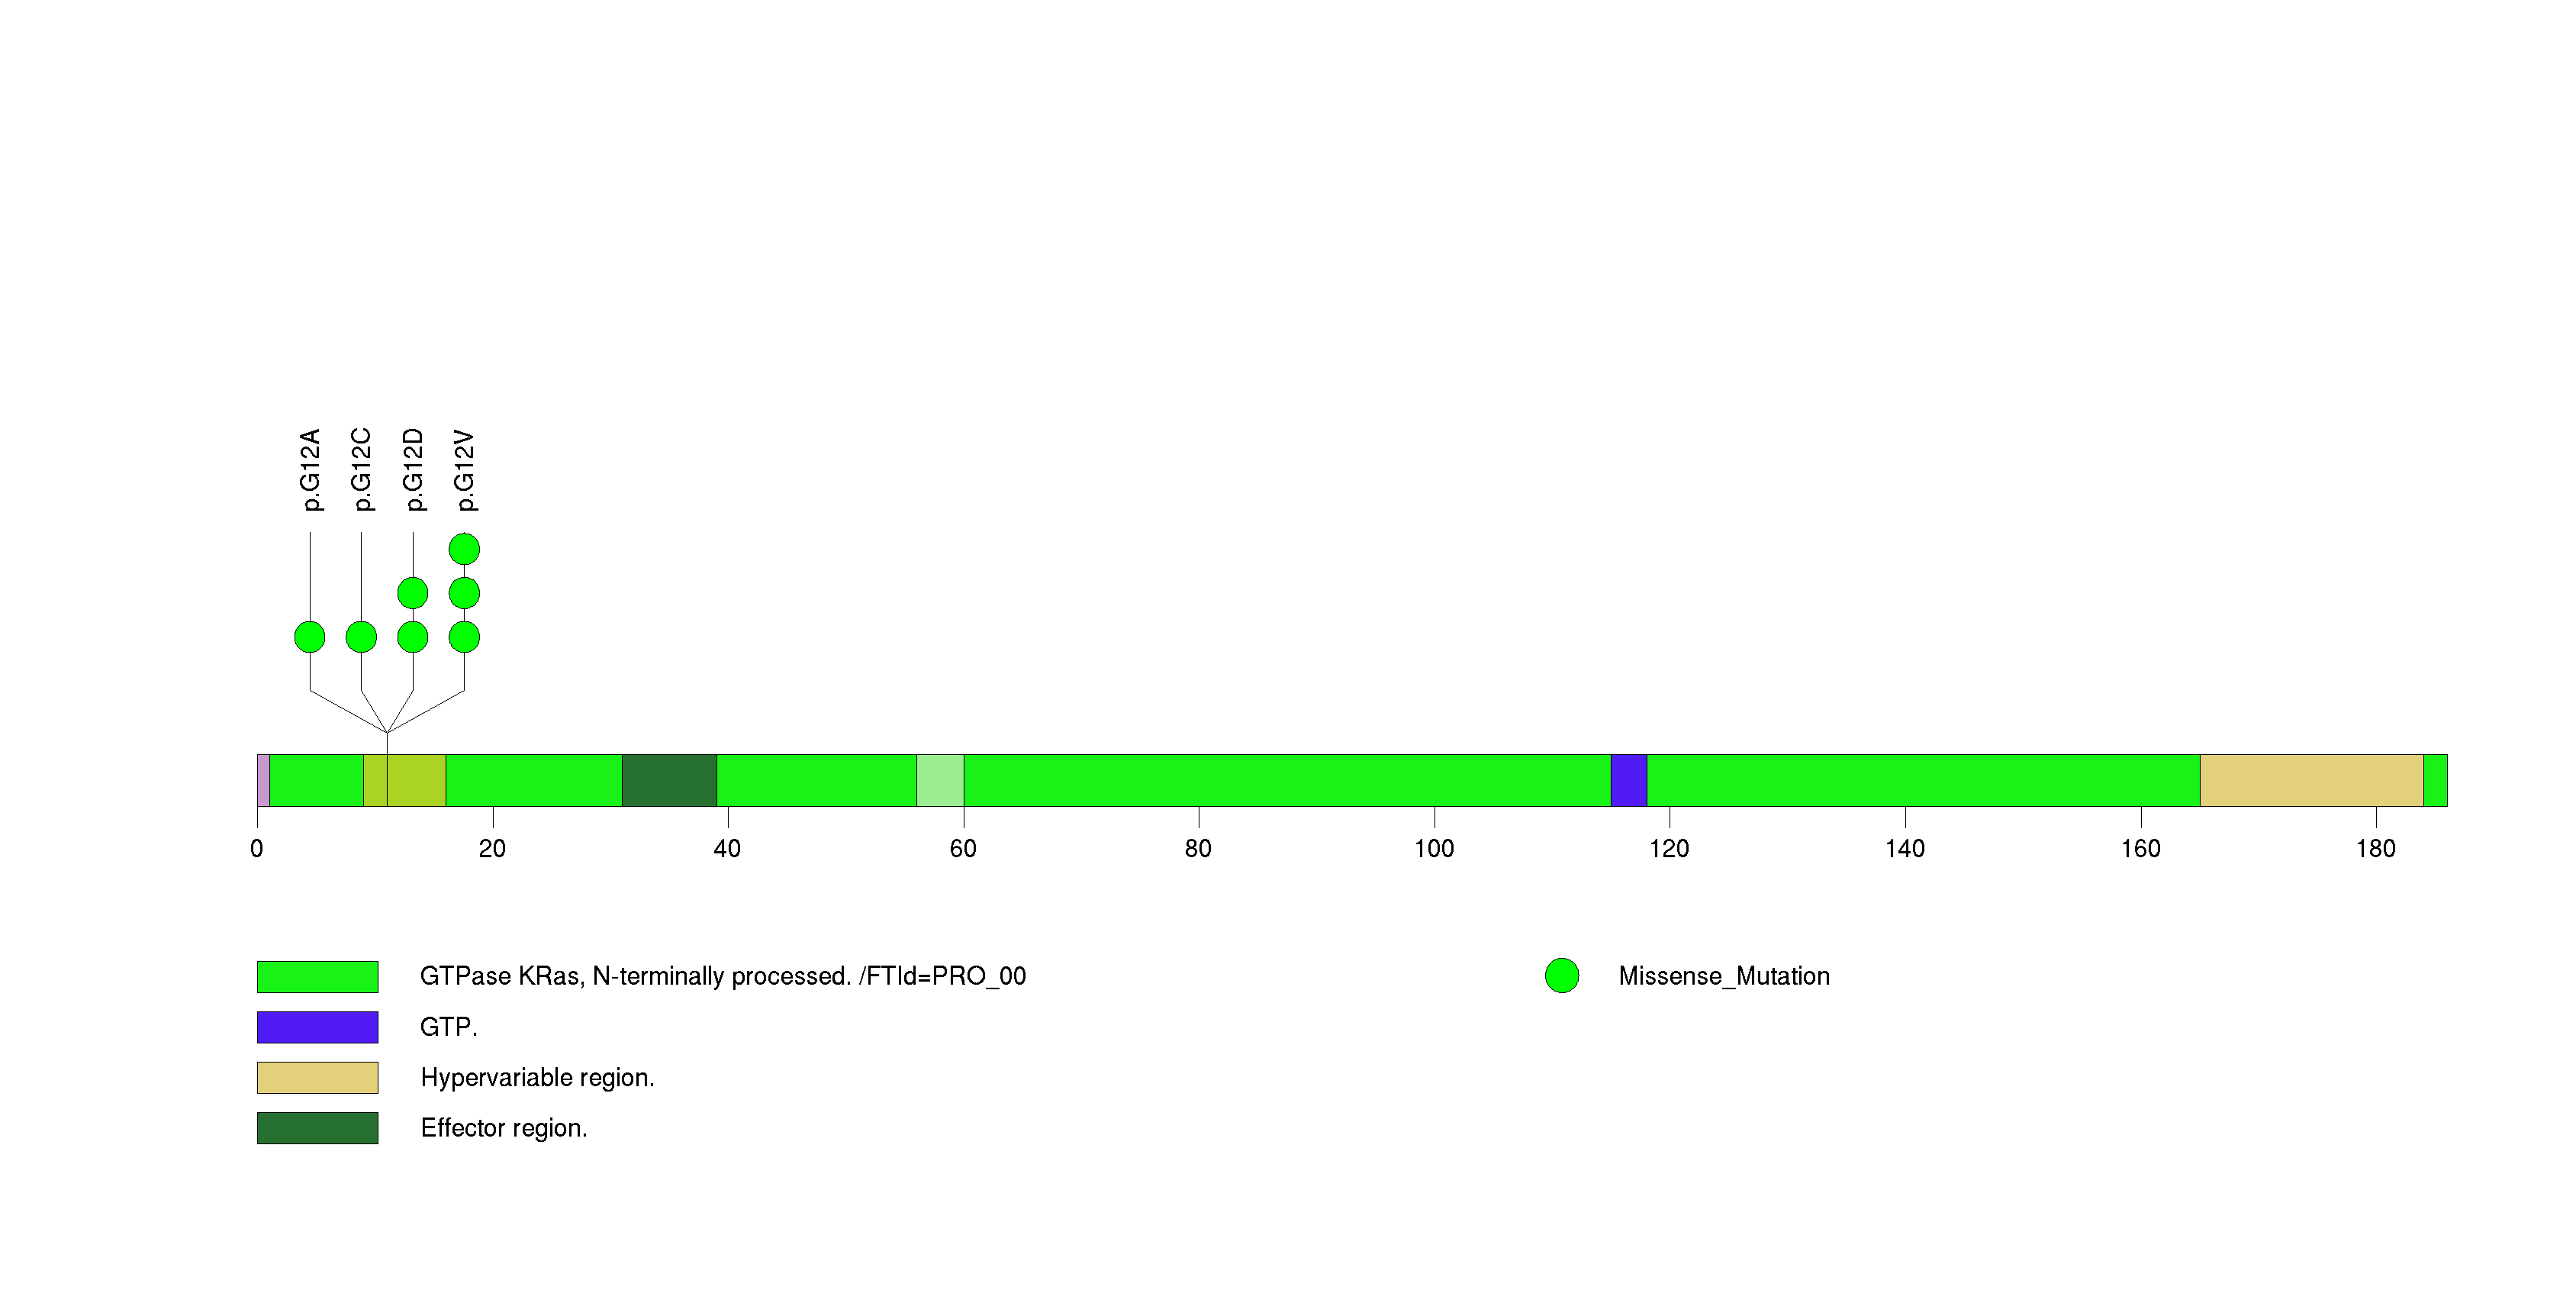
Figure S3. This figure depicts the distribution of mutations and mutation types across the TP53 significant gene.
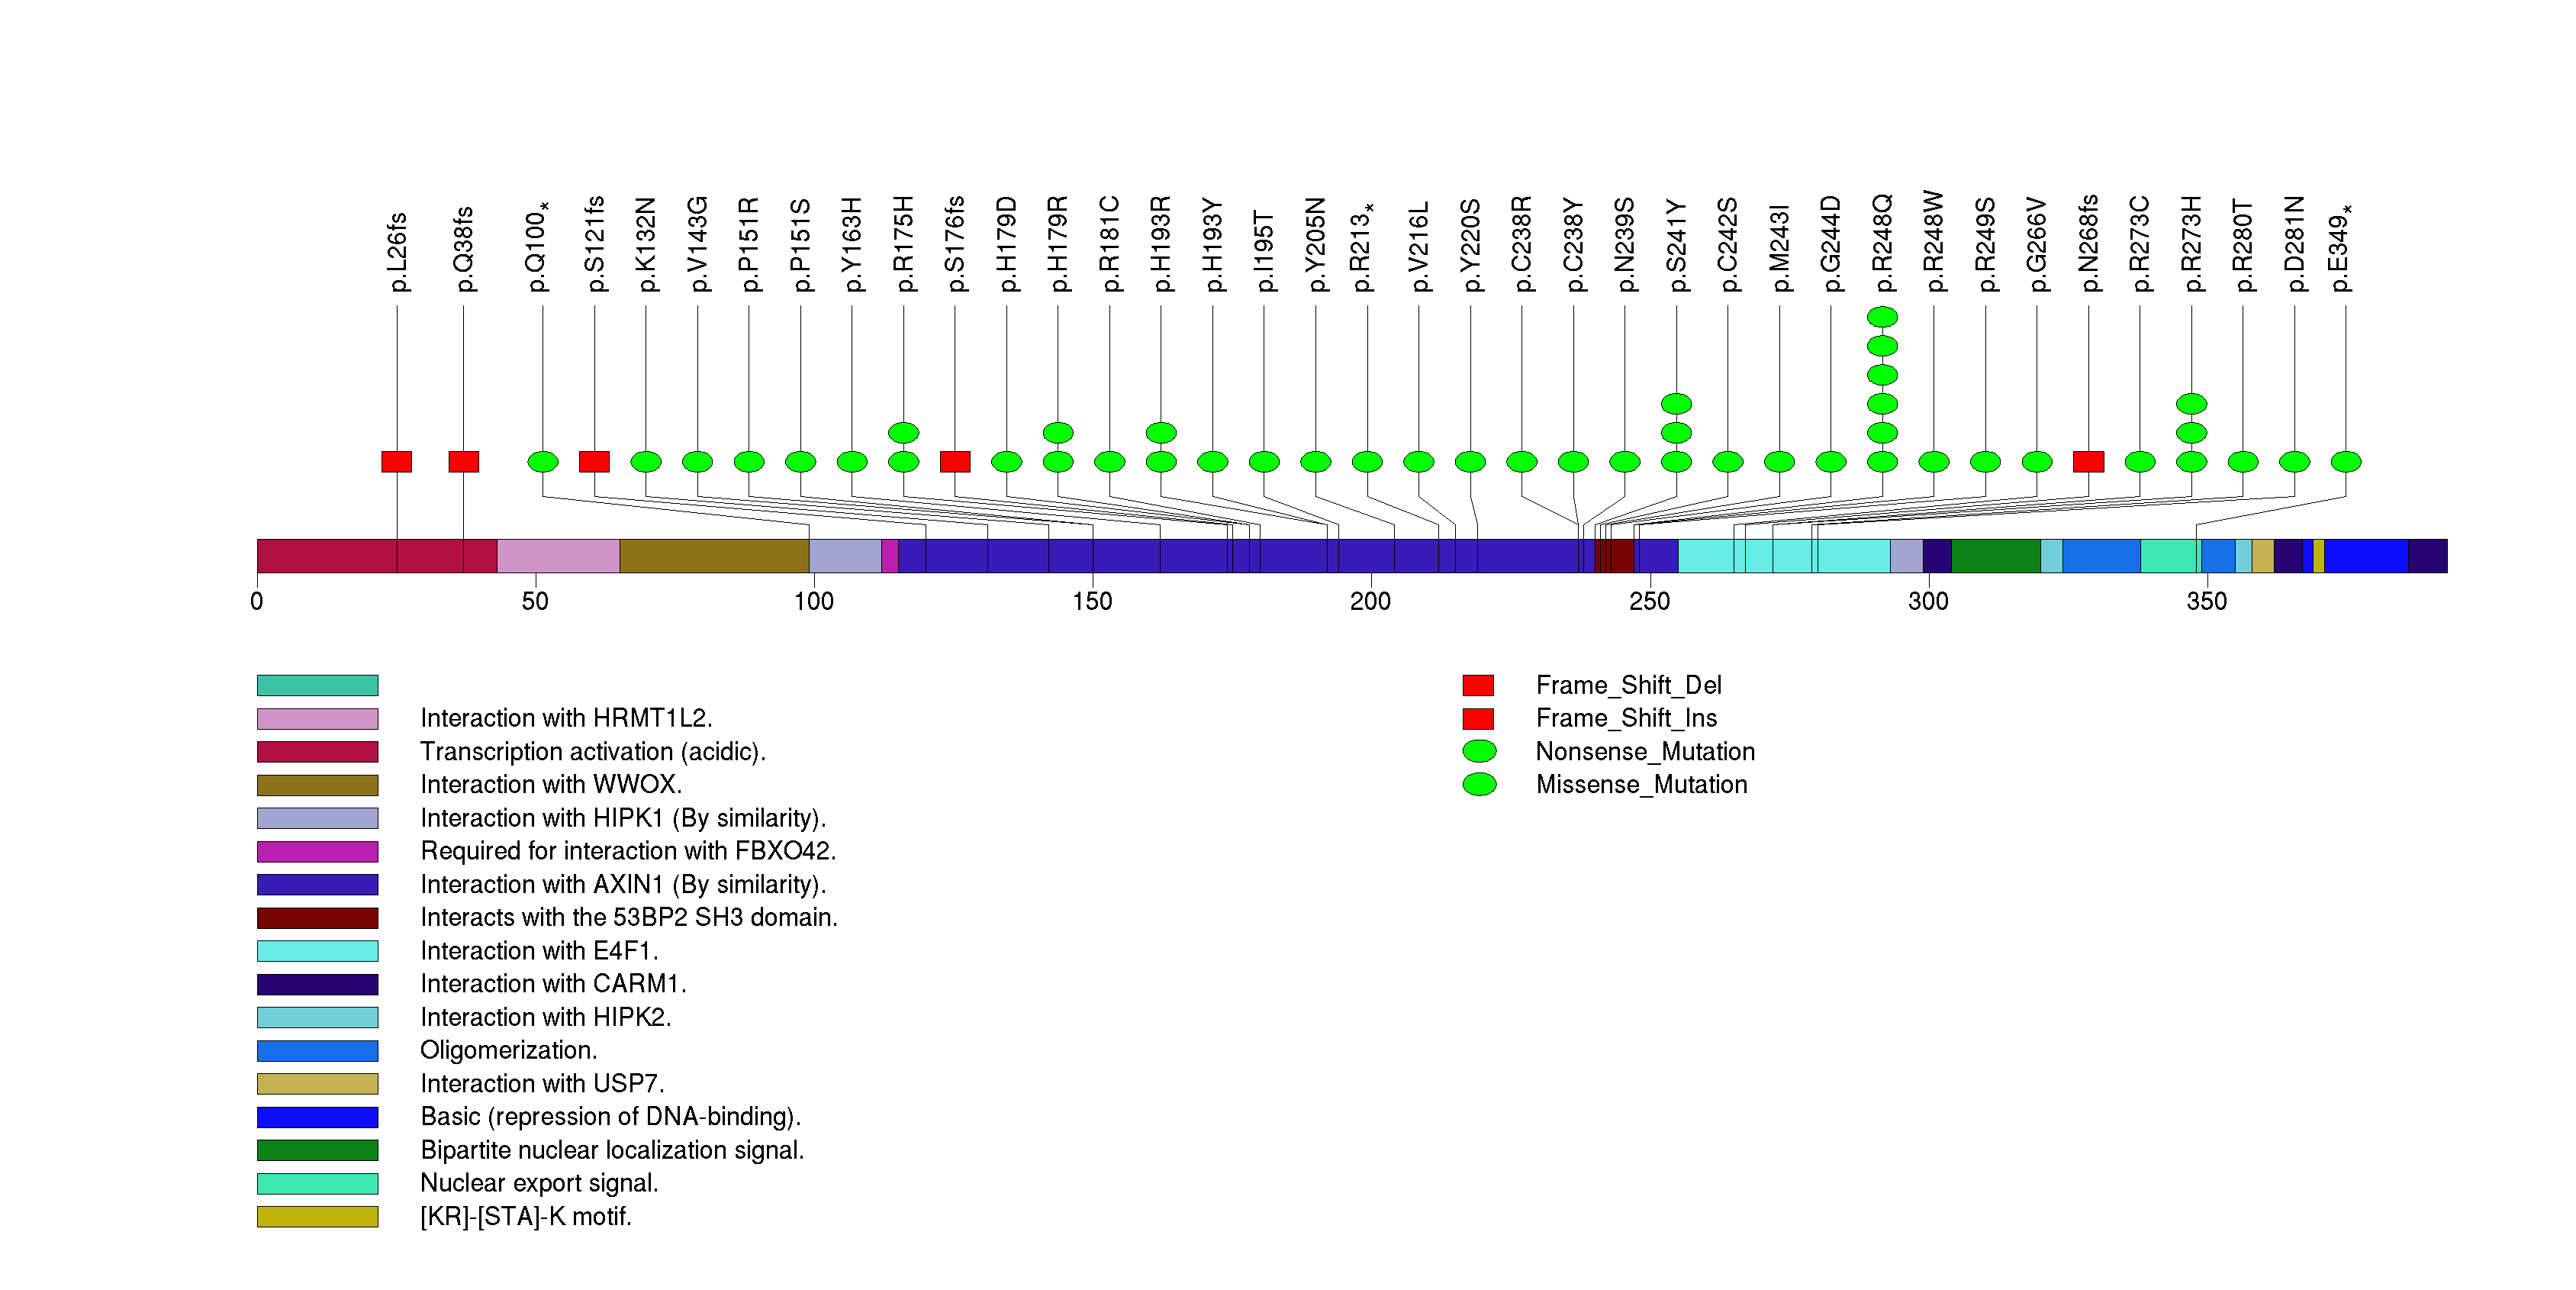
Figure S4. This figure depicts the distribution of mutations and mutation types across the PIK3CA significant gene.
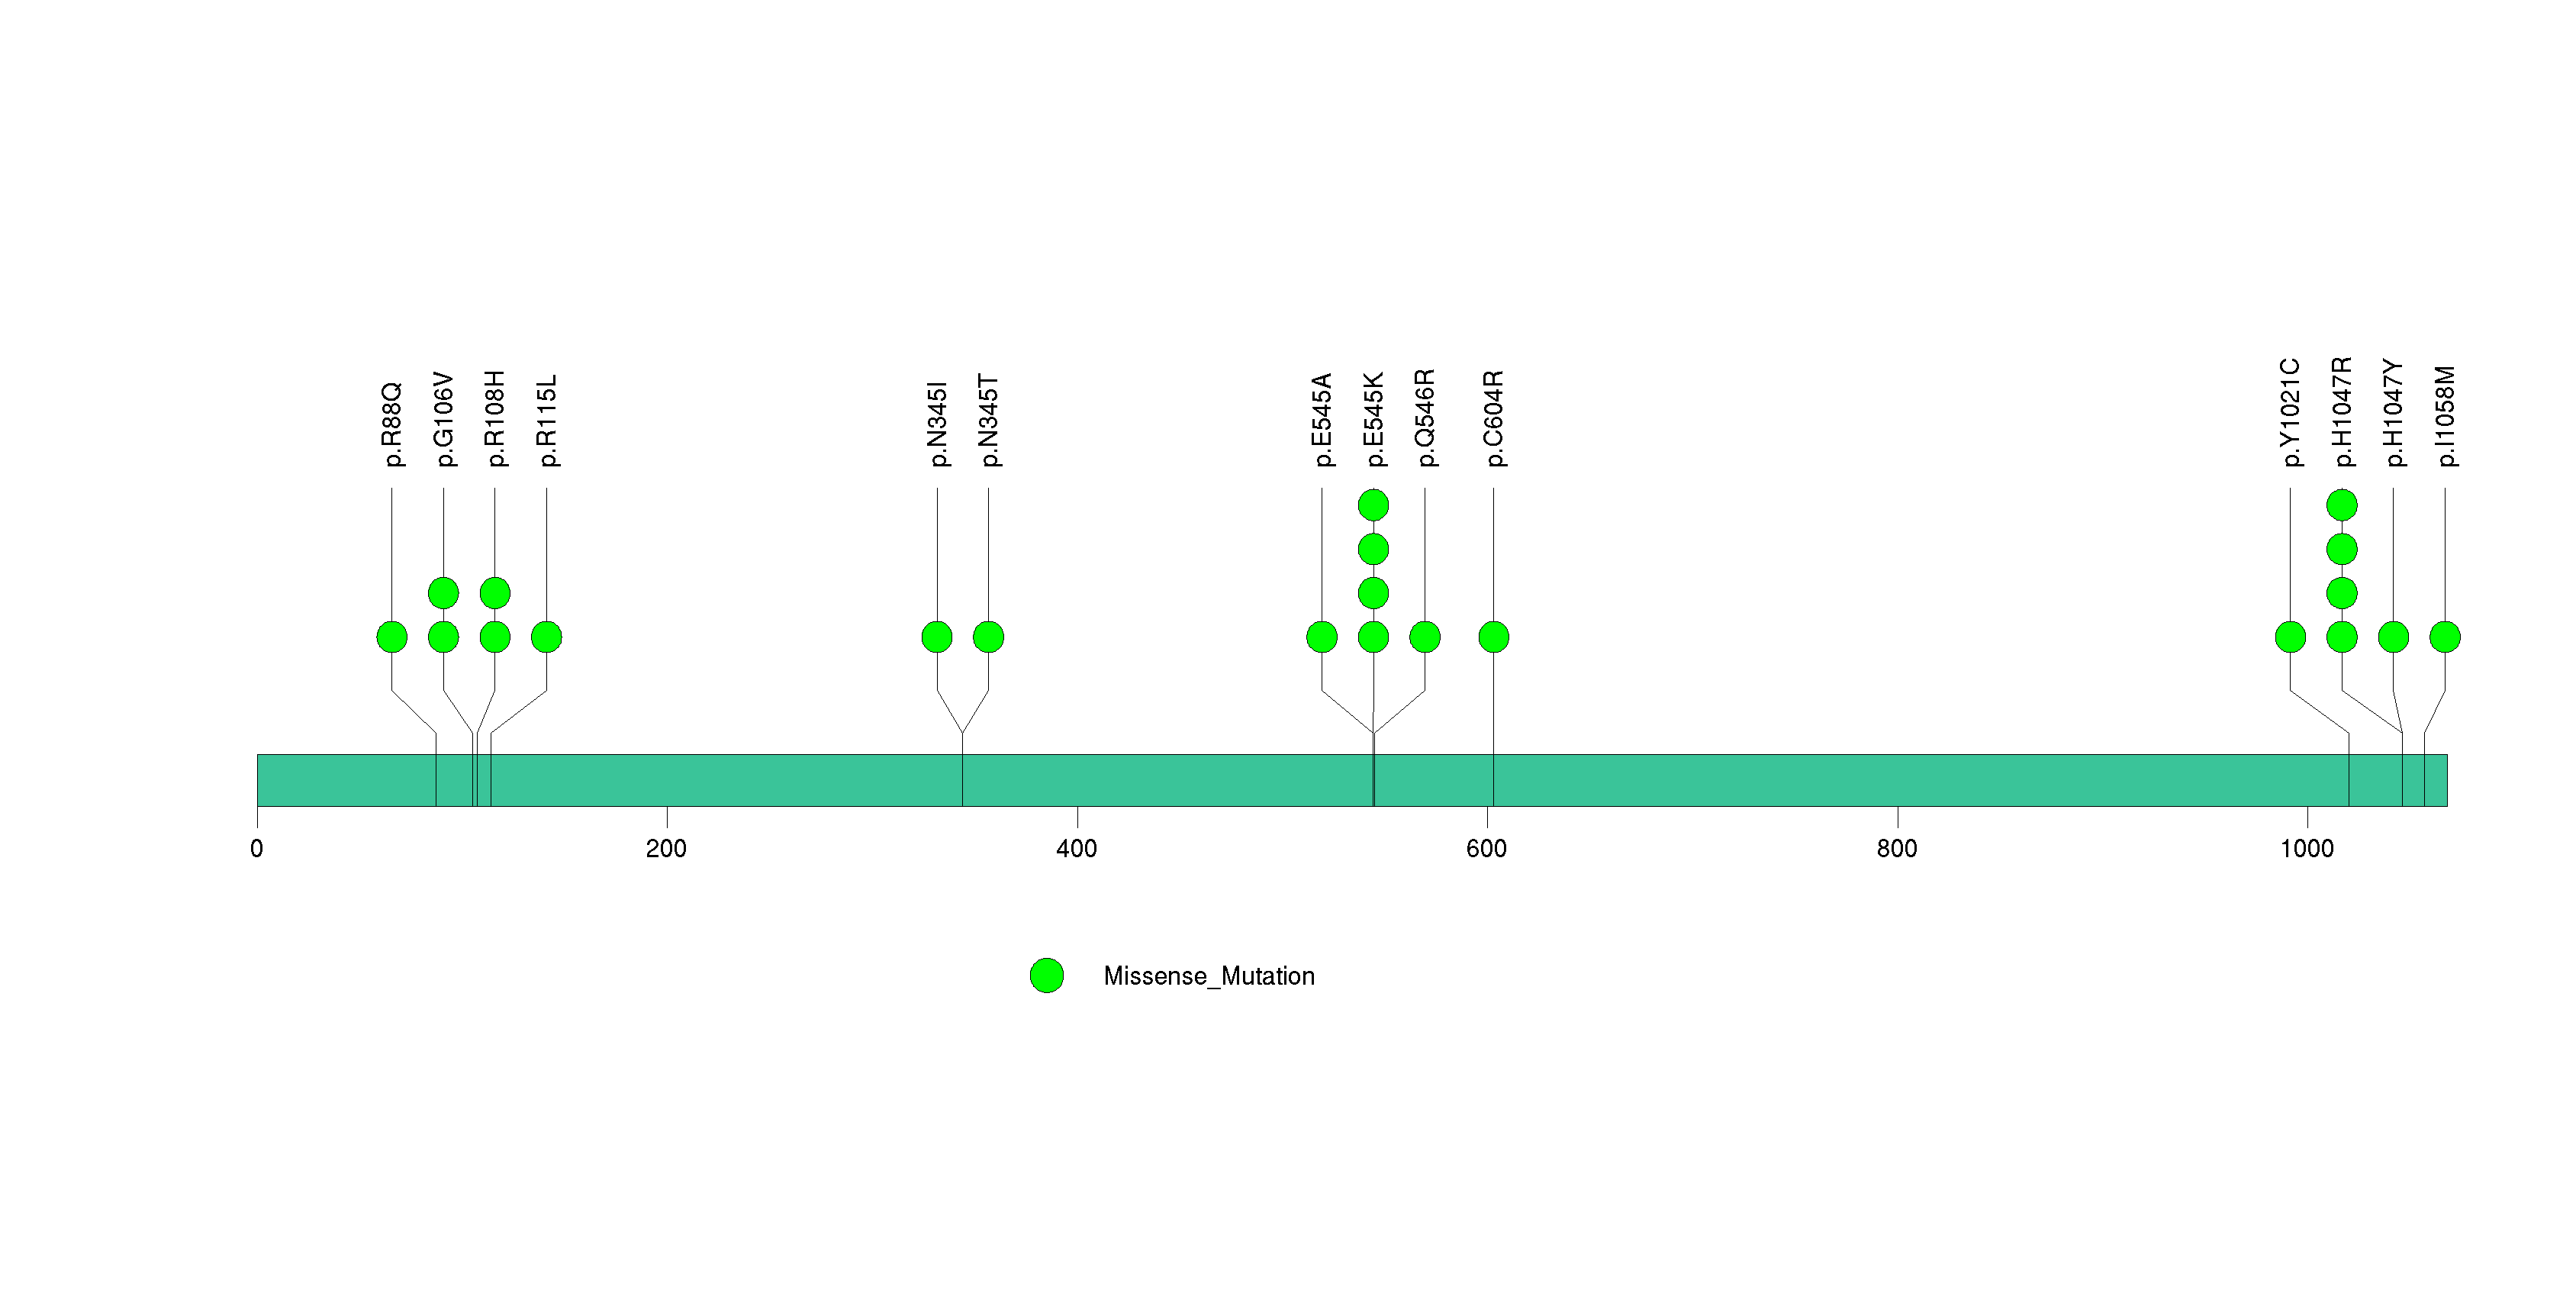
Figure S5. This figure depicts the distribution of mutations and mutation types across the PPP2R1A significant gene.
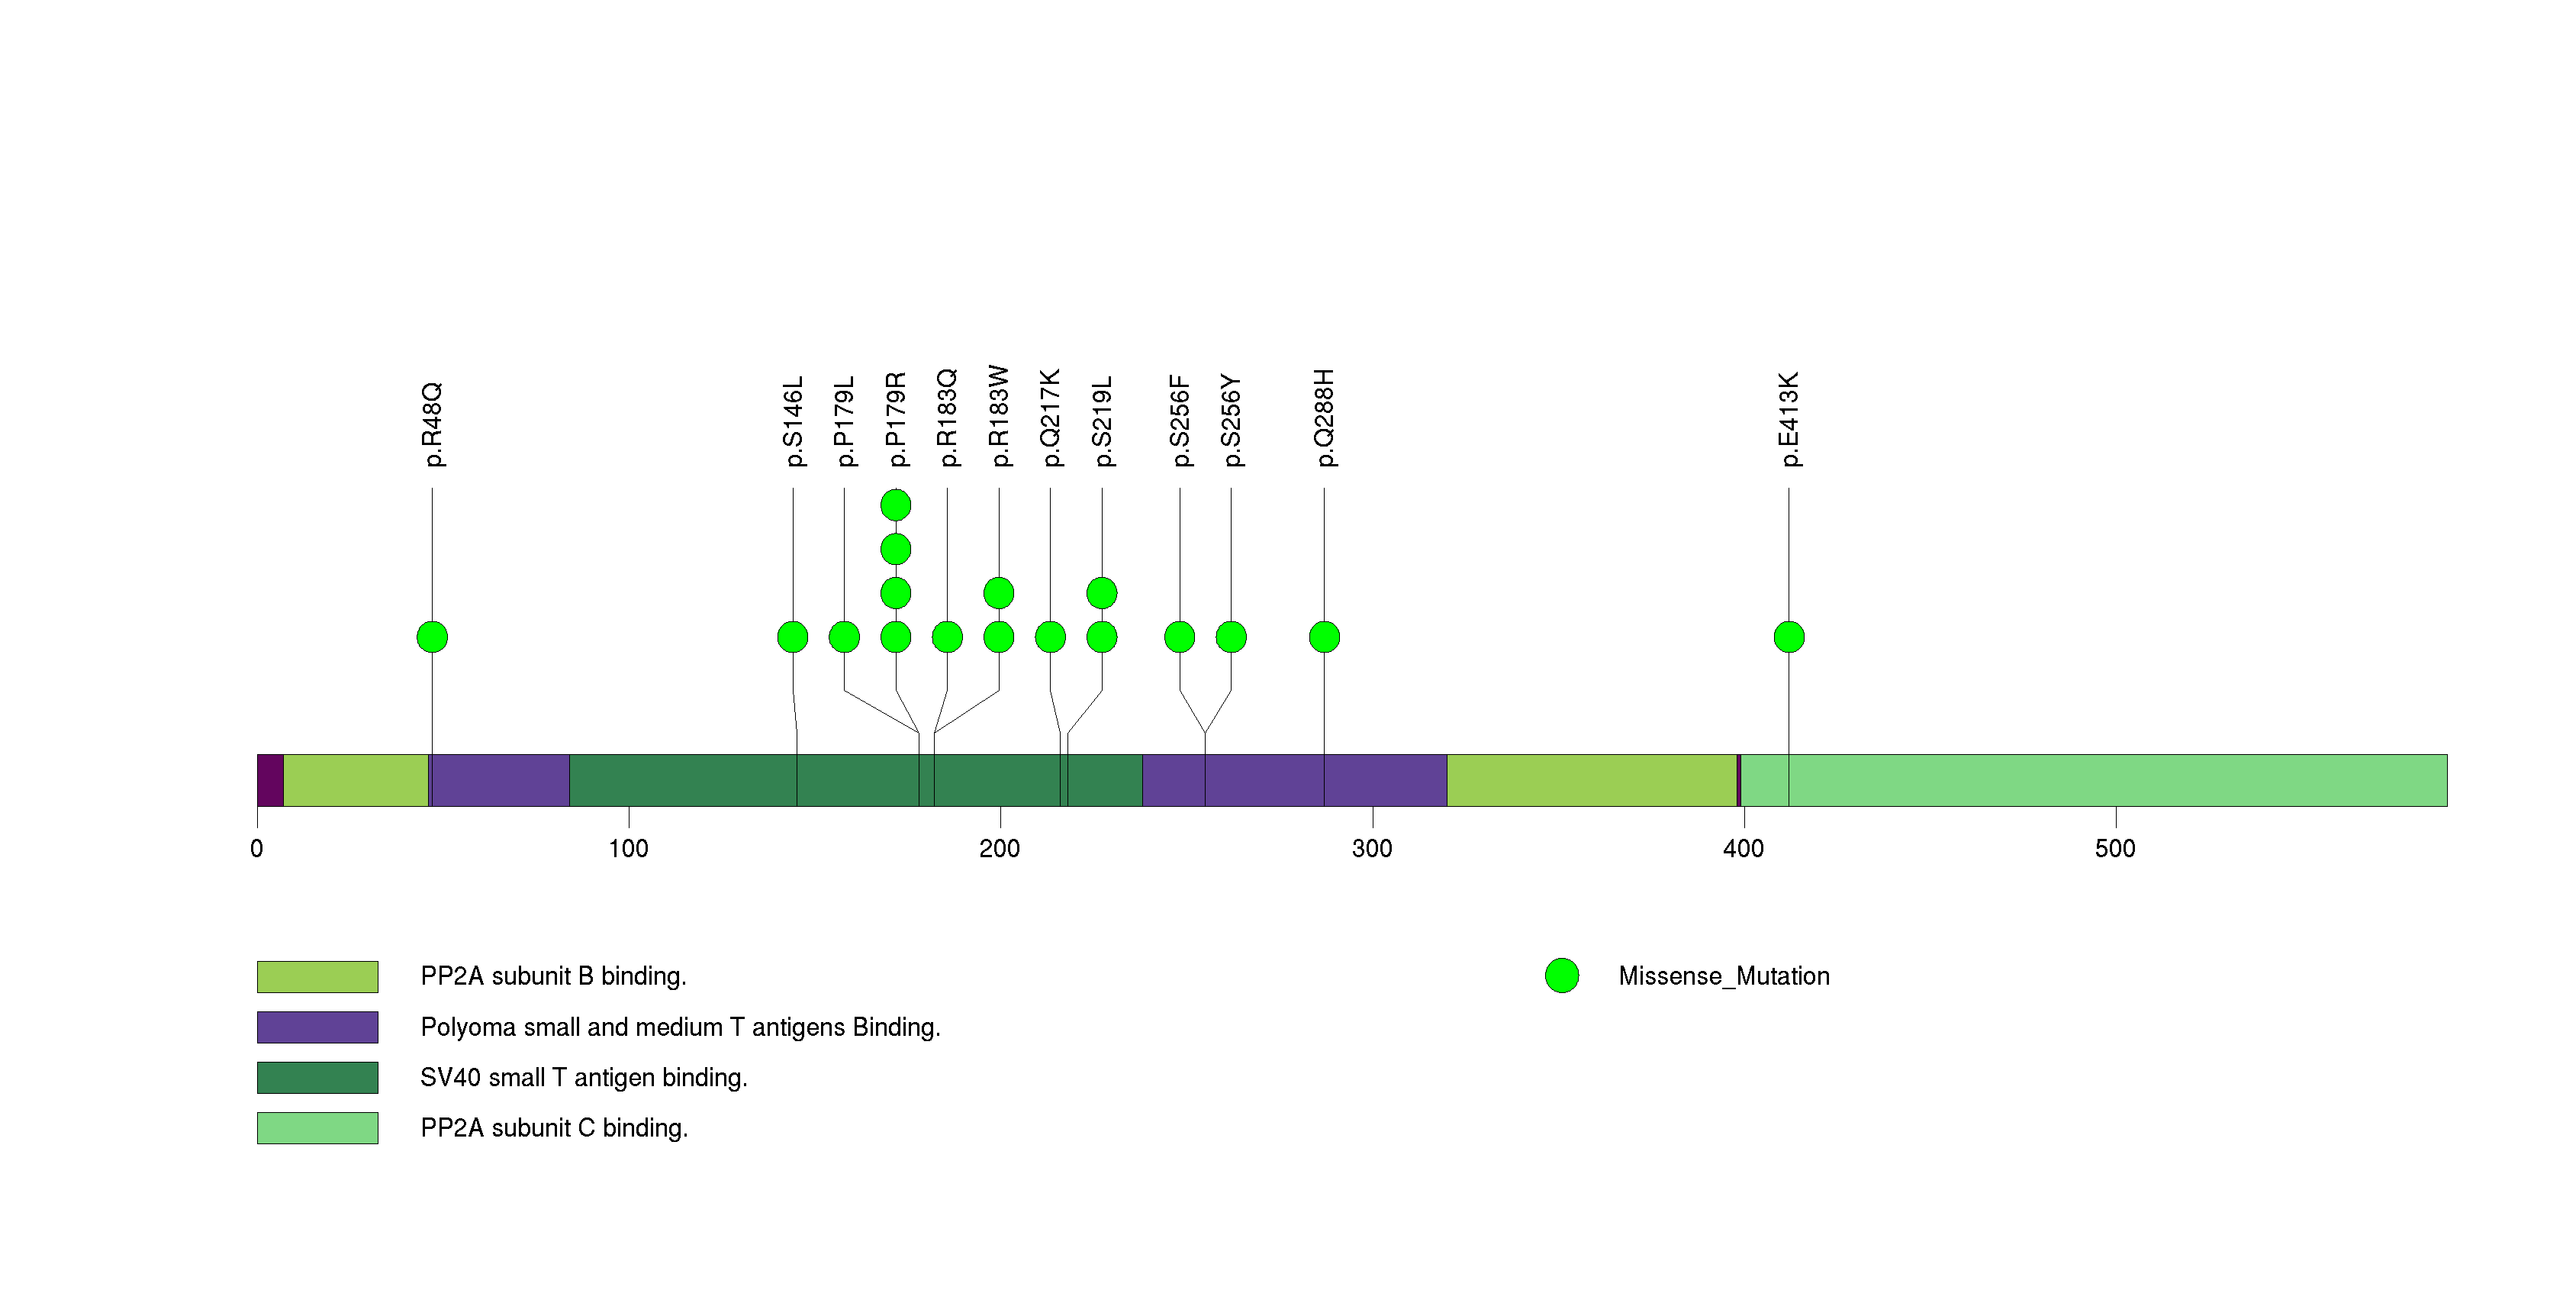
Figure S6. This figure depicts the distribution of mutations and mutation types across the PTEN significant gene.
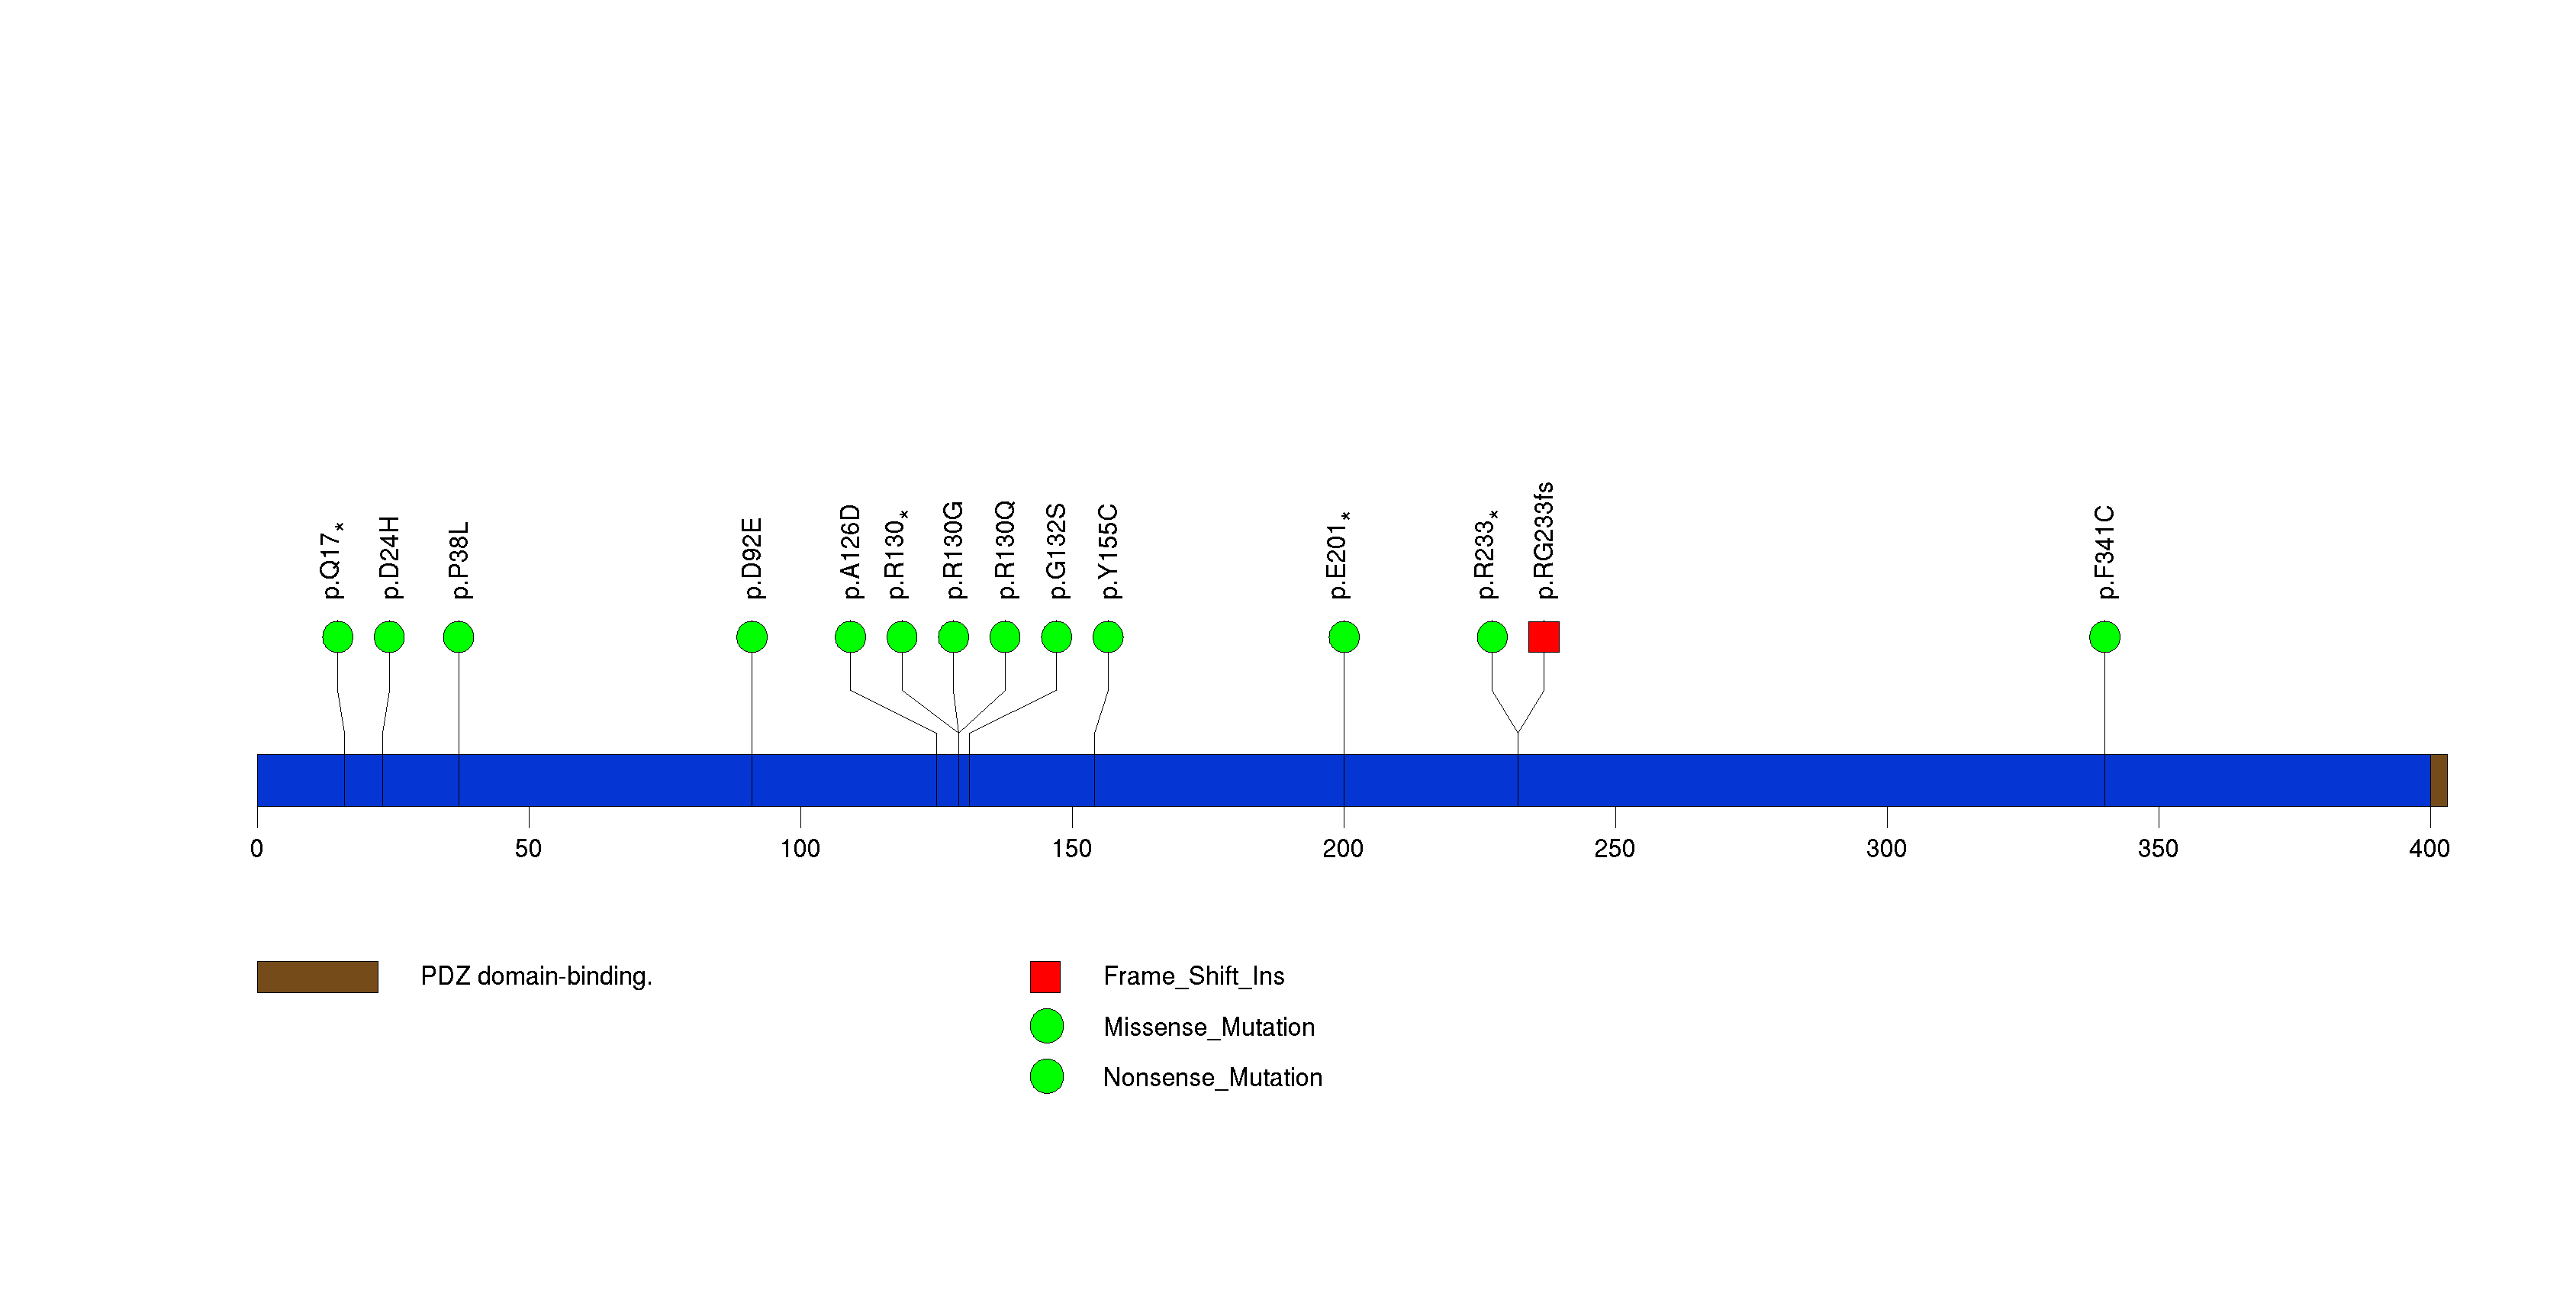
Figure S7. This figure depicts the distribution of mutations and mutation types across the PIK3R1 significant gene.
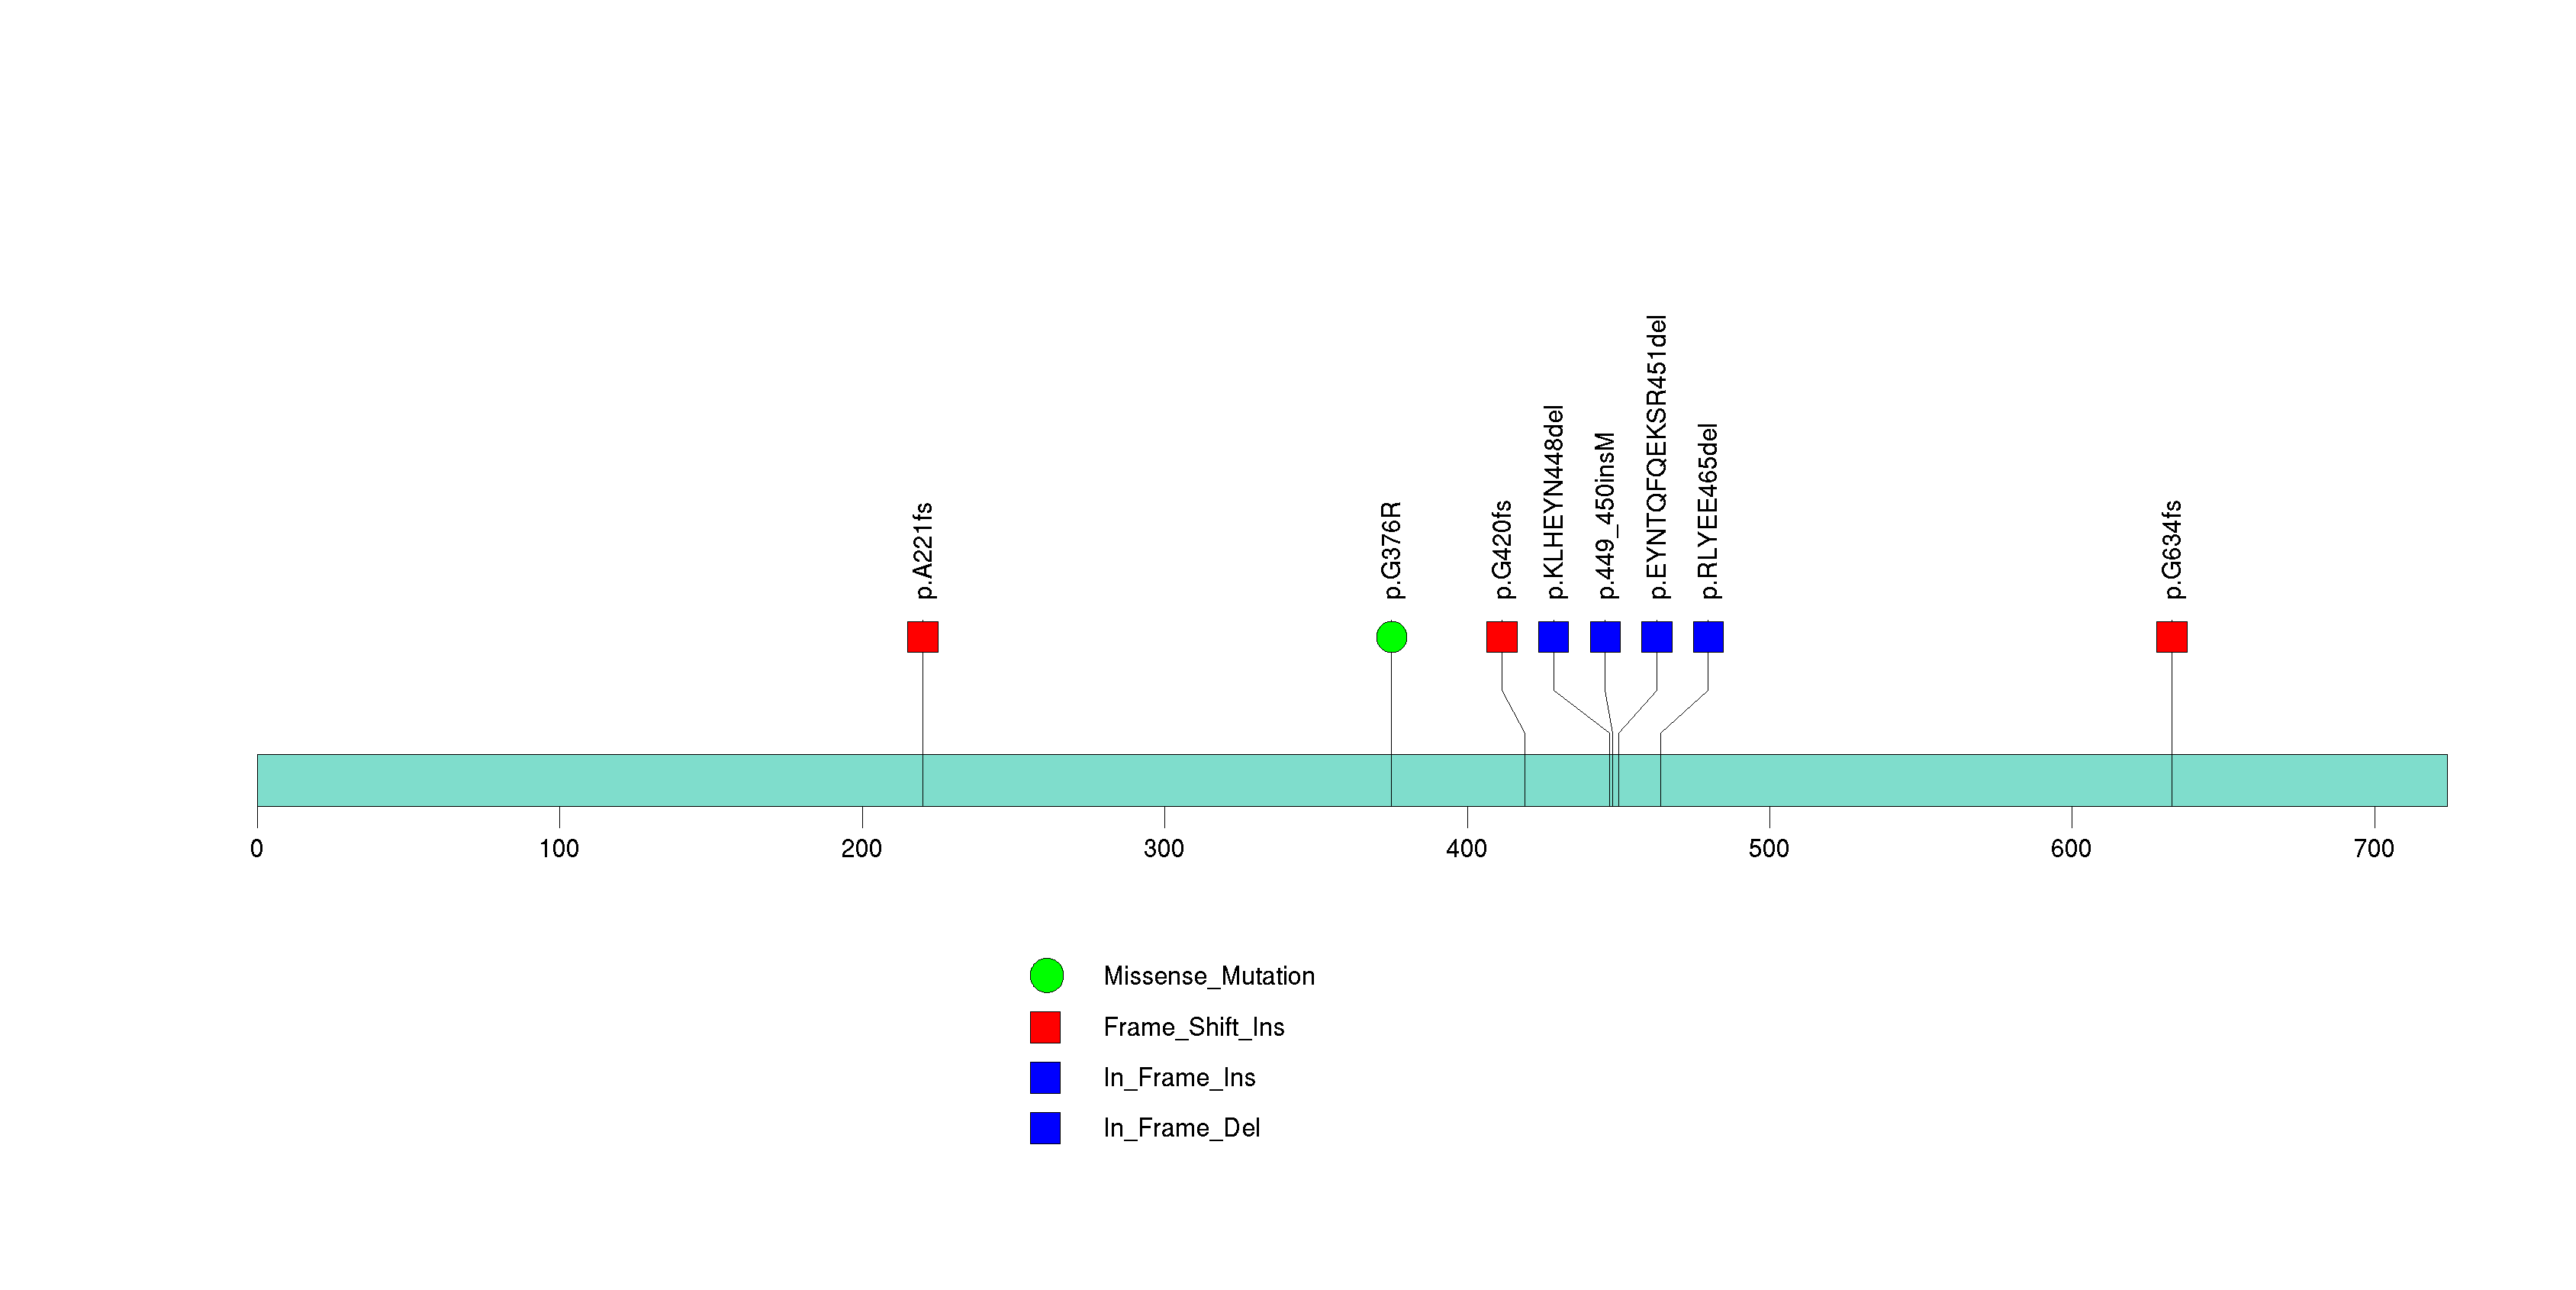
Figure S8. This figure depicts the distribution of mutations and mutation types across the ZBTB7B significant gene.
In this analysis, COSMIC is used as a filter to increase power by restricting the territory of each gene. Cosmic version: v48.
Table 4. Get Full Table Significantly mutated genes (COSMIC territory only). To access the database please go to: COSMIC. Number of significant genes found: 13. Number of genes displayed: 10
| rank | gene | description | n | cos | n_cos | N_cos | cos_ev | p | q |
|---|---|---|---|---|---|---|---|---|---|
| 1 | FBXW7 | F-box and WD repeat domain containing 7 | 24 | 91 | 19 | 5187 | 788 | 0 | 0 |
| 2 | TP53 | tumor protein p53 | 55 | 356 | 52 | 20292 | 16225 | 0 | 0 |
| 3 | KRAS | v-Ki-ras2 Kirsten rat sarcoma viral oncogene homolog | 7 | 52 | 7 | 2964 | 101988 | 0 | 0 |
| 4 | PIK3CA | phosphoinositide-3-kinase, catalytic, alpha polypeptide | 22 | 220 | 20 | 12540 | 8438 | 0 | 0 |
| 5 | PTEN | phosphatase and tensin homolog (mutated in multiple advanced cancers 1) | 15 | 767 | 15 | 43719 | 769 | 0 | 0 |
| 6 | PIK3R1 | phosphoinositide-3-kinase, regulatory subunit 1 (alpha) | 8 | 33 | 4 | 1881 | 9 | 2e-10 | 1.5e-07 |
| 7 | ERBB3 | v-erb-b2 erythroblastic leukemia viral oncogene homolog 3 (avian) | 5 | 6 | 2 | 342 | 2 | 1.2e-06 | 0.00074 |
| 8 | RB1 | retinoblastoma 1 (including osteosarcoma) | 6 | 267 | 3 | 15219 | 10 | 0.000049 | 0.028 |
| 9 | F13A1 | coagulation factor XIII, A1 polypeptide | 1 | 1 | 1 | 57 | 1 | 0.00025 | 0.088 |
| 10 | FERD3L | Fer3-like (Drosophila) | 2 | 1 | 1 | 57 | 1 | 0.00025 | 0.088 |
Note:
n - number of (nonsilent) mutations in this gene across the individual set.
cos = number of unique mutated sites in this gene in COSMIC
n_cos = overlap between n and cos.
N_cos = number of individuals times cos.
cos_ev = total evidence: number of reports in COSMIC for mutations seen in this gene.
p = p-value for seeing the observed amount of overlap in this gene)
q = q-value, False Discovery Rate (Benjamini-Hochberg procedure)
Table 5. Get Full Table A Ranked List of Significantly Mutated Genesets. (Source: MSigDB GSEA Cannonical Pathway Set).Number of significant genesets found: 104. Number of genesets displayed: 10
| rank | geneset | description | genes | N_genes | mut_tally | N | n | npat | nsite | nsil | n1 | n2 | n3 | n4 | n5 | n6 | p_ns_s | p | q |
|---|---|---|---|---|---|---|---|---|---|---|---|---|---|---|---|---|---|---|---|
| 1 | CHEMICALPATHWAY | DNA damage promotes Bid cleavage, which stimulates mitochondrial cytochrome c release and consequent caspase activation, resulting in apoptosis. | ADPRT, AKT1, APAF1, ATM, BAD, BAX, BCL2, BCL2L1, BID, CASP3, CASP6, CASP7, CASP9, CYCS, EIF2S1, PRKCA, PRKCB1, PTK2, PXN, STAT1, TLN1, TP53 | 20 | APAF1(2), ATM(3), BCL2L1(1), CASP7(1), EIF2S1(1), PXN(1), STAT1(1), TP53(55) | 2302234 | 65 | 53 | 53 | 2 | 16 | 6 | 14 | 13 | 15 | 1 | 4.3e-06 | <1.00e-15 | <8.63e-14 |
| 2 | PMLPATHWAY | Ring-shaped PML nuclear bodies regulate transcription and are required co-activators in p53- and DAXX-mediated apoptosis. | CREBBP, DAXX, HRAS, PAX3, PML, PRAM-1, RARA, RB1, SIRT1, SP100, TNF, TNFRSF1A, TNFRSF1B, TNFRSF6, TNFSF6, TP53, UBL1 | 13 | CREBBP(6), PML(1), RB1(6), SIRT1(1), TP53(55) | 1613841 | 69 | 52 | 57 | 0 | 18 | 6 | 12 | 14 | 17 | 2 | 5.6e-09 | <1.00e-15 | <8.63e-14 |
| 3 | NKCELLSPATHWAY | Natural killer (NK) lymphocytes are inhibited by MHC and activated by surface glycoproteins on tumor or virus-infected cells, which undergo perforin-mediated lysis. | B2M, HLA-A, IL18, ITGB1, KLRC1, KLRC2, KLRC3, KLRC4, KLRD1, LAT, MAP2K1, MAPK3, PAK1, PIK3CA, PIK3R1, PTK2B, PTPN6, RAC1, SYK, VAV1 | 20 | ITGB1(1), KLRC3(1), PIK3CA(22), PIK3R1(8), PTPN6(1), RAC1(1) | 1567278 | 34 | 28 | 25 | 1 | 3 | 6 | 5 | 12 | 8 | 0 | 0.004 | 1.22e-15 | 8.63e-14 |
| 4 | G1_TO_S_CELL_CYCLE_REACTOME | ATM, CCNA1, CCNB1, CCND1, CCND2, CCND3, CCNE1, CCNE2, CCNG2, CCNH, CDC25A, CDC45L, CDK2, CDK4, CDK7, CDKN1A, CDKN1B, CDKN1C, CDKN2A, CDKN2B, CDKN2C, CDKN2D, CREB3, CREB3L1, CREB3L3, CREB3L4, CREBL1, CREBL1, TNXB, E2F1, E2F2, E2F3, E2F4, E2F5, E2F6, FLJ14001, GADD45A, GBA2, MCM2, MCM3, MCM4, MCM5, MCM6, MCM7, MDM2, MNAT1, MYC, MYT1, NACA, NACA, FKSG17, ORC1L, ORC2L, ORC3L, ORC4L, ORC5L, ORC6L, PCNA, POLA2, POLE, POLE2, PRIM1, PRIM2A, RB1, RBL1, RPA1, RPA2, RPA3, TFDP1, TFDP2, TP53, WEE1 | 64 | ATM(3), CCNA1(1), CCND1(1), CCND2(1), CCNE2(1), CDKN2A(1), CDKN2B(1), E2F1(1), MCM2(1), MCM3(1), MCM5(1), MCM6(1), MCM7(1), MNAT1(1), MYC(2), NACA(2), POLE(1), POLE2(1), RB1(6), RPA1(1), TNXB(3), TP53(55), WEE1(1) | 6583713 | 88 | 54 | 76 | 6 | 20 | 6 | 21 | 21 | 17 | 3 | 5.8e-06 | 1.33e-15 | 8.63e-14 | |
| 5 | TPOPATHWAY | Thrombopoietin binds to its receptor and activates cell growth through the Erk and JNK MAP kinase pathways, protein kinase C, and JAK/STAT activation. | CSNK2A1, FOS, GRB2, HRAS, JAK2, JUN, MAP2K1, MAPK3, MPL, PIK3CA, PIK3R1, PLCG1, PRKCA, PRKCB1, RAF1, RASA1, SHC1, SOS1, STAT1, STAT3, STAT5A, STAT5B, THPO | 22 | JAK2(2), PIK3CA(22), PIK3R1(8), RASA1(1), STAT1(1), STAT3(2) | 2536692 | 36 | 27 | 27 | 2 | 3 | 7 | 5 | 12 | 9 | 0 | 0.011 | 1.44e-15 | 8.63e-14 |
| 6 | APOPTOSIS | APAF1, BAD, BAK1, BCL2L7P1, BAX, BCL2, BCL2L1, BCL2L11, BID, BIRC2, BIRC3, BIRC4, BIRC5, BNIP3L, CASP1, CASP10, CASP1, COPl, CASP2, CASP3, CASP4, CASP6, CASP7, CASP8, CASP9, CHUK, CYCS, DFFA, DFFB, FADD, FAS, FASLG, GZMB, HELLS, HRK, IKBKB, IKBKG, IRF1, IRF2, IRF3, IRF4, IRF5, IRF6, IRF7, JUN, LTA, MAP2K4, MAP3K1, MAPK10, MDM2, MYC, NFKB1, NFKBIA, NFKBIB, NFKBIE, PRF1, RELA, RIPK1, TNF, TNFRSF10B, TNFRSF1A, TNFRSF1B, TNFRSF21, TNFRSF25, TNFRSF25, PLEKHG5, TNFSF10, TP53, TP73, TRADD, TRAF1, TRAF2, TRAF3 | 66 | APAF1(2), BCL2L1(1), BCL2L11(2), CASP4(1), CASP7(1), CASP8(2), GZMB(1), HELLS(1), IKBKB(1), IRF2(1), IRF6(1), LTA(1), MAP2K4(1), MAP3K1(1), MAPK10(1), MYC(2), TNFRSF21(1), TP53(55), TP73(1) | 4903224 | 77 | 52 | 64 | 5 | 20 | 7 | 12 | 17 | 20 | 1 | 0.000015 | 1.55e-15 | 8.63e-14 | |
| 7 | ATRBRCAPATHWAY | BRCA1 and 2 block cell cycle progression in response to DNA damage and promote double-stranded break repair; mutations induce breast cancer susceptibility. | ATM, ATR, BRCA1, BRCA2, CHEK1, CHEK2, FANCA, FANCC, FANCD2, FANCE, FANCF, FANCG, HUS1, MRE11A, NBS1, RAD1, RAD17, RAD50, RAD51, RAD9A, TP53, TREX1 | 21 | ATM(3), ATR(3), BRCA2(5), CHEK2(2), FANCC(1), FANCD2(1), FANCE(1), FANCF(1), FANCG(1), HUS1(1), MRE11A(1), RAD9A(1), TP53(55) | 3685680 | 76 | 52 | 64 | 4 | 16 | 7 | 18 | 19 | 15 | 1 | 6e-05 | 1.55e-15 | 8.63e-14 |
| 8 | TELPATHWAY | Telomerase is a ribonucleotide protein that adds telomeric repeats to the 3' ends of chromosomes. | AKT1, BCL2, EGFR, G22P1, HSPCA, IGF1R, KRAS2, MYC, POLR2A, PPP2CA, PRKCA, RB1, TEP1, TERF1, TERT, TNKS, TP53, XRCC5 | 15 | MYC(2), POLR2A(2), RB1(6), TEP1(1), TNKS(1), TP53(55) | 2390234 | 67 | 53 | 55 | 2 | 15 | 6 | 11 | 17 | 16 | 2 | 1e-06 | 1.89e-15 | 8.63e-14 |
| 9 | RASPATHWAY | Ras activation stimulates many signaling cascades, including PI3K/AKT activation to inhibit apoptosis. | AKT1, ARHA, BAD, BCL2L1, CASP9, CDC42, CHUK, ELK1, H2AFX, HRAS, MAP2K1, MAPK3, MLLT7, NFKB1, PIK3CA, PIK3R1, RAC1, RAF1, RALA, RALBP1, RALGDS, RELA, RHOA | 21 | BCL2L1(1), PIK3CA(22), PIK3R1(8), RAC1(1), RALGDS(2) | 1634536 | 34 | 28 | 25 | 1 | 5 | 7 | 5 | 10 | 7 | 0 | 0.0017 | 1.89e-15 | 8.63e-14 |
| 10 | CDC42RACPATHWAY | PI3 kinase stimulates cell migration by activating cdc42, which activates ARP2/3, which in turn promotes formation of new actin fibers. | ACTR2, ACTR3, ARHA, ARPC1A, ARPC1B, ARPC2, ARPC3, ARPC4, CDC42, PAK1, PDGFRA, PIK3CA, PIK3R1, RAC1, WASL | 14 | ACTR3(1), PIK3CA(22), PIK3R1(8), RAC1(1), WASL(1) | 1132069 | 33 | 27 | 24 | 1 | 4 | 6 | 5 | 11 | 7 | 0 | 0.0047 | 1.89e-15 | 8.63e-14 |
In brief, we tabulate the number of mutations and the number of covered bases for each gene. The counts are broken down by mutation context category: four context categories that are discovered by MutSig, and one for indel and 'null' mutations, which include indels, nonsense mutations, splice-site mutations, and non-stop (read-through) mutations. For each gene, we calculate the probability of seeing the observed constellation of mutations, i.e. the product P1 x P2 x ... x Pm, or a more extreme one, given the background mutation rates calculated across the dataset. [1]
In addition to the links below, the full results of the analysis summarized in this report can also be downloaded programmatically using firehose_get, or interactively from either the Broad GDAC website or TCGA Data Coordination Center Portal.