This pipeline computes the correlation between significant arm-level copy number variations (cnvs) and selected clinical features.
Testing the association between copy number variation 75 arm-level events and 7 clinical features across 80 patients, one significant finding detected with Q value < 0.25.
-
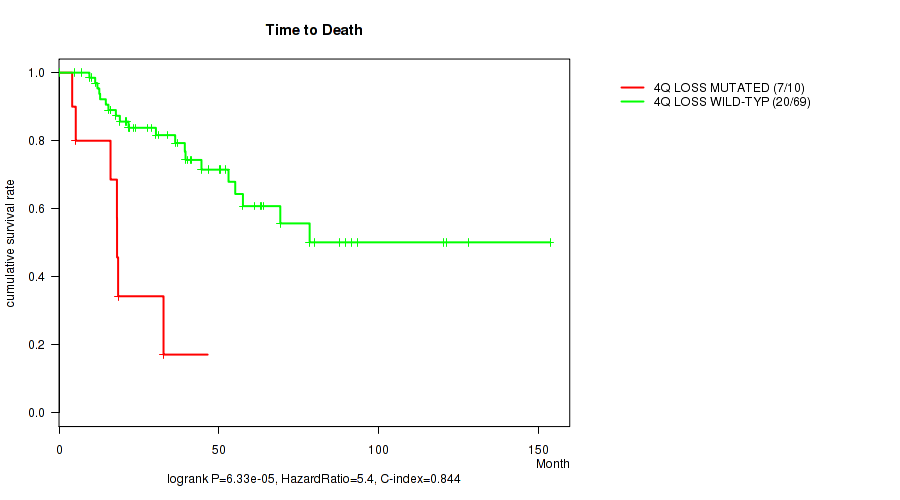
4q loss cnv correlated to 'Time to Death'.
Table 1. Get Full Table Overview of the association between significant copy number variation of 75 arm-level events and 7 clinical features. Shown in the table are P values (Q values). Thresholded by Q value < 0.25, one significant finding detected.
|
Clinical Features |
Time to Death |
AGE |
NEOPLASM DISEASESTAGE |
PATHOLOGY T STAGE |
PATHOLOGY N STAGE |
GENDER | ETHNICITY | ||
| nCNV (%) | nWild-Type | logrank test | Wilcoxon-test | Fisher's exact test | Fisher's exact test | Fisher's exact test | Fisher's exact test | Fisher's exact test | |
| 4q loss | 10 (12%) | 70 |
6.33e-05 (0.0332) |
0.631 (1.00) |
0.0923 (1.00) |
0.0223 (1.00) |
1 (1.00) |
1 (1.00) |
1 (1.00) |
| 1q gain | 6 (8%) | 74 |
0.0526 (1.00) |
0.584 (1.00) |
0.747 (1.00) |
0.338 (1.00) |
1 (1.00) |
0.086 (1.00) |
0.41 (1.00) |
| 2p gain | 11 (14%) | 69 |
0.00663 (1.00) |
1 (1.00) |
0.469 (1.00) |
0.211 (1.00) |
0.341 (1.00) |
0.312 (1.00) |
0.568 (1.00) |
| 2q gain | 9 (11%) | 71 |
0.0684 (1.00) |
0.675 (1.00) |
0.0338 (1.00) |
0.136 (1.00) |
1 (1.00) |
0.15 (1.00) |
0.602 (1.00) |
| 3p gain | 10 (12%) | 70 |
0.344 (1.00) |
0.749 (1.00) |
0.49 (1.00) |
0.911 (1.00) |
1 (1.00) |
0.734 (1.00) |
1 (1.00) |
| 3q gain | 12 (15%) | 68 |
0.502 (1.00) |
0.666 (1.00) |
0.325 (1.00) |
0.927 (1.00) |
0.65 (1.00) |
1 (1.00) |
1 (1.00) |
| 4p gain | 32 (40%) | 48 |
0.239 (1.00) |
0.817 (1.00) |
0.832 (1.00) |
0.85 (1.00) |
1 (1.00) |
0.812 (1.00) |
0.186 (1.00) |
| 4q gain | 29 (36%) | 51 |
0.183 (1.00) |
0.924 (1.00) |
0.891 (1.00) |
0.894 (1.00) |
1 (1.00) |
0.808 (1.00) |
0.346 (1.00) |
| 5p gain | 51 (64%) | 29 |
0.363 (1.00) |
0.932 (1.00) |
0.544 (1.00) |
0.948 (1.00) |
0.734 (1.00) |
0.808 (1.00) |
0.21 (1.00) |
| 5q gain | 49 (61%) | 31 |
0.571 (1.00) |
0.628 (1.00) |
0.592 (1.00) |
0.728 (1.00) |
1 (1.00) |
0.342 (1.00) |
0.21 (1.00) |
| 6p gain | 16 (20%) | 64 |
0.526 (1.00) |
0.0146 (1.00) |
0.494 (1.00) |
0.302 (1.00) |
0.676 (1.00) |
0.779 (1.00) |
0.0596 (1.00) |
| 6q gain | 14 (18%) | 66 |
0.932 (1.00) |
0.133 (1.00) |
0.229 (1.00) |
0.357 (1.00) |
0.197 (1.00) |
0.226 (1.00) |
0.602 (1.00) |
| 7p gain | 42 (52%) | 38 |
0.643 (1.00) |
0.916 (1.00) |
0.22 (1.00) |
0.343 (1.00) |
0.332 (1.00) |
0.816 (1.00) |
0.244 (1.00) |
| 7q gain | 42 (52%) | 38 |
0.559 (1.00) |
0.689 (1.00) |
0.158 (1.00) |
0.374 (1.00) |
0.332 (1.00) |
0.816 (1.00) |
0.101 (1.00) |
| 8p gain | 30 (38%) | 50 |
0.635 (1.00) |
0.415 (1.00) |
0.34 (1.00) |
0.577 (1.00) |
0.304 (1.00) |
1 (1.00) |
0.433 (1.00) |
| 8q gain | 34 (42%) | 46 |
0.694 (1.00) |
0.988 (1.00) |
0.449 (1.00) |
0.625 (1.00) |
0.502 (1.00) |
1 (1.00) |
0.685 (1.00) |
| 9p gain | 16 (20%) | 64 |
0.0164 (1.00) |
0.705 (1.00) |
0.0278 (1.00) |
0.273 (1.00) |
0.00421 (1.00) |
0.397 (1.00) |
0.312 (1.00) |
| 9q gain | 24 (30%) | 56 |
0.000866 (0.451) |
0.741 (1.00) |
0.0123 (1.00) |
0.0957 (1.00) |
0.00838 (1.00) |
0.307 (1.00) |
0.226 (1.00) |
| 10p gain | 22 (28%) | 58 |
0.0224 (1.00) |
0.397 (1.00) |
0.0148 (1.00) |
0.0281 (1.00) |
1 (1.00) |
1 (1.00) |
0.433 (1.00) |
| 10q gain | 23 (29%) | 57 |
0.00385 (1.00) |
0.398 (1.00) |
0.00485 (1.00) |
0.0103 (1.00) |
1 (1.00) |
1 (1.00) |
0.433 (1.00) |
| 11p gain | 3 (4%) | 77 |
0.732 (1.00) |
0.176 (1.00) |
0.0323 (1.00) |
1 (1.00) |
1 (1.00) |
1 (1.00) |
|
| 11q gain | 4 (5%) | 76 |
0.00194 (1.00) |
0.842 (1.00) |
0.0453 (1.00) |
0.0399 (1.00) |
1 (1.00) |
1 (1.00) |
0.553 (1.00) |
| 12p gain | 56 (70%) | 24 |
0.924 (1.00) |
0.2 (1.00) |
0.926 (1.00) |
0.869 (1.00) |
1 (1.00) |
0.611 (1.00) |
0.0734 (1.00) |
| 12q gain | 57 (71%) | 23 |
0.709 (1.00) |
0.266 (1.00) |
0.745 (1.00) |
0.835 (1.00) |
0.719 (1.00) |
0.796 (1.00) |
0.0815 (1.00) |
| 13q gain | 5 (6%) | 75 |
0.895 (1.00) |
0.835 (1.00) |
0.434 (1.00) |
0.609 (1.00) |
0.511 (1.00) |
0.653 (1.00) |
0.553 (1.00) |
| 14q gain | 18 (22%) | 62 |
0.514 (1.00) |
0.284 (1.00) |
0.291 (1.00) |
0.383 (1.00) |
0.231 (1.00) |
1 (1.00) |
0.346 (1.00) |
| 15q gain | 10 (12%) | 70 |
0.699 (1.00) |
0.805 (1.00) |
0.781 (1.00) |
0.633 (1.00) |
1 (1.00) |
0.734 (1.00) |
1 (1.00) |
| 16p gain | 43 (54%) | 37 |
0.225 (1.00) |
0.469 (1.00) |
0.721 (1.00) |
0.483 (1.00) |
1 (1.00) |
0.481 (1.00) |
0.443 (1.00) |
| 16q gain | 43 (54%) | 37 |
0.304 (1.00) |
0.881 (1.00) |
0.856 (1.00) |
0.457 (1.00) |
1 (1.00) |
0.815 (1.00) |
0.443 (1.00) |
| 17p gain | 4 (5%) | 76 |
0.542 (1.00) |
0.459 (1.00) |
0.716 (1.00) |
0.167 (1.00) |
1 (1.00) |
0.609 (1.00) |
0.41 (1.00) |
| 17q gain | 5 (6%) | 75 |
0.955 (1.00) |
0.788 (1.00) |
0.908 (1.00) |
0.402 (1.00) |
1 (1.00) |
1 (1.00) |
0.41 (1.00) |
| 19p gain | 49 (61%) | 31 |
0.496 (1.00) |
0.0579 (1.00) |
0.166 (1.00) |
0.266 (1.00) |
0.734 (1.00) |
1 (1.00) |
0.108 (1.00) |
| 19q gain | 45 (56%) | 35 |
0.584 (1.00) |
0.0241 (1.00) |
0.423 (1.00) |
0.576 (1.00) |
0.174 (1.00) |
0.64 (1.00) |
0.108 (1.00) |
| 20p gain | 41 (51%) | 39 |
0.197 (1.00) |
0.5 (1.00) |
0.367 (1.00) |
0.716 (1.00) |
1 (1.00) |
0.488 (1.00) |
1 (1.00) |
| 20q gain | 44 (55%) | 36 |
0.267 (1.00) |
0.977 (1.00) |
0.482 (1.00) |
0.827 (1.00) |
0.498 (1.00) |
0.247 (1.00) |
0.7 (1.00) |
| 21q gain | 26 (32%) | 54 |
0.919 (1.00) |
0.0705 (1.00) |
1 (1.00) |
0.913 (1.00) |
0.0692 (1.00) |
0.803 (1.00) |
0.402 (1.00) |
| xq gain | 35 (44%) | 45 |
0.5 (1.00) |
0.756 (1.00) |
0.825 (1.00) |
1 (1.00) |
0.332 (1.00) |
1 (1.00) |
0.244 (1.00) |
| 1p loss | 27 (34%) | 53 |
0.38 (1.00) |
0.963 (1.00) |
0.628 (1.00) |
0.543 (1.00) |
1 (1.00) |
0.808 (1.00) |
1 (1.00) |
| 1q loss | 18 (22%) | 62 |
0.861 (1.00) |
0.174 (1.00) |
0.859 (1.00) |
0.885 (1.00) |
0.683 (1.00) |
0.404 (1.00) |
1 (1.00) |
| 2p loss | 17 (21%) | 63 |
0.0455 (1.00) |
0.444 (1.00) |
0.925 (1.00) |
0.648 (1.00) |
1 (1.00) |
0.576 (1.00) |
1 (1.00) |
| 2q loss | 15 (19%) | 65 |
0.0825 (1.00) |
0.707 (1.00) |
0.505 (1.00) |
0.693 (1.00) |
0.679 (1.00) |
0.766 (1.00) |
1 (1.00) |
| 3p loss | 18 (22%) | 62 |
0.0617 (1.00) |
0.433 (1.00) |
0.179 (1.00) |
0.484 (1.00) |
1 (1.00) |
0.164 (1.00) |
0.553 (1.00) |
| 3q loss | 18 (22%) | 62 |
0.143 (1.00) |
0.695 (1.00) |
0.289 (1.00) |
0.711 (1.00) |
1 (1.00) |
0.404 (1.00) |
0.218 (1.00) |
| 4p loss | 9 (11%) | 71 |
0.000545 (0.285) |
0.389 (1.00) |
0.0667 (1.00) |
0.0106 (1.00) |
1 (1.00) |
1 (1.00) |
1 (1.00) |
| 5p loss | 7 (9%) | 73 |
0.386 (1.00) |
0.759 (1.00) |
0.565 (1.00) |
0.194 (1.00) |
1 (1.00) |
0.691 (1.00) |
0.553 (1.00) |
| 5q loss | 6 (8%) | 74 |
0.972 (1.00) |
0.371 (1.00) |
0.248 (1.00) |
0.363 (1.00) |
0.579 (1.00) |
0.176 (1.00) |
1 (1.00) |
| 6p loss | 17 (21%) | 63 |
0.174 (1.00) |
0.488 (1.00) |
0.147 (1.00) |
0.213 (1.00) |
0.683 (1.00) |
1 (1.00) |
0.553 (1.00) |
| 6q loss | 20 (25%) | 60 |
0.119 (1.00) |
0.353 (1.00) |
0.0244 (1.00) |
0.0393 (1.00) |
0.714 (1.00) |
0.787 (1.00) |
1 (1.00) |
| 7p loss | 4 (5%) | 76 |
0.328 (1.00) |
0.86 (1.00) |
0.502 (1.00) |
0.563 (1.00) |
1 (1.00) |
0.0129 (1.00) |
1 (1.00) |
| 7q loss | 5 (6%) | 75 |
0.308 (1.00) |
0.72 (1.00) |
0.0212 (1.00) |
0.0339 (1.00) |
1 (1.00) |
0.337 (1.00) |
1 (1.00) |
| 8p loss | 13 (16%) | 67 |
0.602 (1.00) |
0.835 (1.00) |
0.743 (1.00) |
1 (1.00) |
0.183 (1.00) |
0.761 (1.00) |
1 (1.00) |
| 8q loss | 10 (12%) | 70 |
0.979 (1.00) |
0.777 (1.00) |
0.843 (1.00) |
1 (1.00) |
0.0881 (1.00) |
1 (1.00) |
1 (1.00) |
| 9p loss | 19 (24%) | 61 |
0.25 (1.00) |
0.623 (1.00) |
0.885 (1.00) |
0.621 (1.00) |
0.437 (1.00) |
0.583 (1.00) |
1 (1.00) |
| 9q loss | 10 (12%) | 70 |
0.776 (1.00) |
0.595 (1.00) |
0.195 (1.00) |
0.327 (1.00) |
0.596 (1.00) |
0.734 (1.00) |
0.553 (1.00) |
| 10p loss | 11 (14%) | 69 |
0.356 (1.00) |
0.675 (1.00) |
0.183 (1.00) |
1 (1.00) |
0.149 (1.00) |
1 (1.00) |
0.41 (1.00) |
| 10q loss | 9 (11%) | 71 |
0.401 (1.00) |
0.594 (1.00) |
0.318 (1.00) |
0.631 (1.00) |
0.331 (1.00) |
1 (1.00) |
1 (1.00) |
| 11p loss | 23 (29%) | 57 |
0.716 (1.00) |
0.844 (1.00) |
0.141 (1.00) |
0.588 (1.00) |
1 (1.00) |
0.438 (1.00) |
1 (1.00) |
| 11q loss | 22 (28%) | 58 |
0.264 (1.00) |
0.682 (1.00) |
0.0224 (1.00) |
0.134 (1.00) |
1 (1.00) |
0.295 (1.00) |
0.553 (1.00) |
| 12p loss | 5 (6%) | 75 |
0.233 (1.00) |
0.266 (1.00) |
0.715 (1.00) |
0.388 (1.00) |
1 (1.00) |
0.337 (1.00) |
1 (1.00) |
| 12q loss | 4 (5%) | 76 |
0.0823 (1.00) |
0.508 (1.00) |
0.716 (1.00) |
0.387 (1.00) |
1 (1.00) |
0.609 (1.00) |
1 (1.00) |
| 13q loss | 33 (41%) | 47 |
0.139 (1.00) |
0.973 (1.00) |
0.605 (1.00) |
0.86 (1.00) |
0.731 (1.00) |
0.341 (1.00) |
1 (1.00) |
| 14q loss | 17 (21%) | 63 |
0.338 (1.00) |
0.828 (1.00) |
0.431 (1.00) |
0.421 (1.00) |
0.443 (1.00) |
0.576 (1.00) |
0.312 (1.00) |
| 15q loss | 20 (25%) | 60 |
0.502 (1.00) |
0.56 (1.00) |
0.827 (1.00) |
0.84 (1.00) |
1 (1.00) |
0.787 (1.00) |
0.648 (1.00) |
| 16p loss | 6 (8%) | 74 |
0.000586 (0.306) |
0.427 (1.00) |
0.247 (1.00) |
0.0648 (1.00) |
0.579 (1.00) |
1 (1.00) |
0.553 (1.00) |
| 16q loss | 5 (6%) | 75 |
0.0227 (1.00) |
0.2 (1.00) |
0.433 (1.00) |
0.187 (1.00) |
0.511 (1.00) |
1 (1.00) |
0.553 (1.00) |
| 17p loss | 29 (36%) | 51 |
0.00141 (0.733) |
0.389 (1.00) |
0.0828 (1.00) |
0.11 (1.00) |
0.734 (1.00) |
0.0876 (1.00) |
0.39 (1.00) |
| 17q loss | 24 (30%) | 56 |
0.00832 (1.00) |
0.946 (1.00) |
0.0656 (1.00) |
0.11 (1.00) |
1 (1.00) |
0.00949 (1.00) |
0.39 (1.00) |
| 18p loss | 36 (45%) | 44 |
0.745 (1.00) |
0.973 (1.00) |
0.14 (1.00) |
0.334 (1.00) |
1 (1.00) |
0.347 (1.00) |
1 (1.00) |
| 18q loss | 34 (42%) | 46 |
0.851 (1.00) |
0.819 (1.00) |
0.124 (1.00) |
0.23 (1.00) |
1 (1.00) |
0.0615 (1.00) |
1 (1.00) |
| 19p loss | 3 (4%) | 77 |
0.00472 (1.00) |
0.78 (1.00) |
0.505 (1.00) |
0.453 (1.00) |
1 (1.00) |
0.279 (1.00) |
1 (1.00) |
| 19q loss | 3 (4%) | 77 |
0.0389 (1.00) |
0.234 (1.00) |
0.861 (1.00) |
1 (1.00) |
1 (1.00) |
1 (1.00) |
1 (1.00) |
| 20p loss | 7 (9%) | 73 |
0.281 (1.00) |
0.409 (1.00) |
0.547 (1.00) |
0.926 (1.00) |
0.579 (1.00) |
0.412 (1.00) |
0.41 (1.00) |
| 21q loss | 15 (19%) | 65 |
0.00868 (1.00) |
0.434 (1.00) |
0.426 (1.00) |
0.294 (1.00) |
0.676 (1.00) |
0.557 (1.00) |
1 (1.00) |
| 22q loss | 45 (56%) | 35 |
0.00652 (1.00) |
0.467 (1.00) |
0.275 (1.00) |
0.0967 (1.00) |
0.742 (1.00) |
0.159 (1.00) |
0.121 (1.00) |
| xq loss | 15 (19%) | 65 |
0.806 (1.00) |
0.0458 (1.00) |
0.507 (1.00) |
0.283 (1.00) |
0.377 (1.00) |
0.766 (1.00) |
0.315 (1.00) |
P value = 6.33e-05 (logrank test), Q value = 0.033
Table S1. Gene #44: '4q loss' versus Clinical Feature #1: 'Time to Death'
| nPatients | nDeath | Duration Range (Median), Month | |
|---|---|---|---|
| ALL | 79 | 27 | 4.1 - 153.6 (31.2) |
| 4Q LOSS MUTATED | 10 | 7 | 4.1 - 46.5 (18.1) |
| 4Q LOSS WILD-TYPE | 69 | 20 | 4.9 - 153.6 (36.3) |
Figure S1. Get High-res Image Gene #44: '4q loss' versus Clinical Feature #1: 'Time to Death'
-
Copy number data file = transformed.cor.cli.txt
-
Clinical data file = ACC-TP.merged_data.txt
-
Number of patients = 80
-
Number of significantly arm-level cnvs = 75
-
Number of selected clinical features = 7
-
Exclude regions that fewer than K tumors have mutations, K = 3
For survival clinical features, the Kaplan-Meier survival curves of tumors with and without gene mutations were plotted and the statistical significance P values were estimated by logrank test (Bland and Altman 2004) using the 'survdiff' function in R
For binary or multi-class clinical features (nominal or ordinal), two-tailed Fisher's exact tests (Fisher 1922) were used to estimate the P values using the 'fisher.test' function in R
For multiple hypothesis correction, Q value is the False Discovery Rate (FDR) analogue of the P value (Benjamini and Hochberg 1995), defined as the minimum FDR at which the test may be called significant. We used the 'Benjamini and Hochberg' method of 'p.adjust' function in R to convert P values into Q values.
In addition to the links below, the full results of the analysis summarized in this report can also be downloaded programmatically using firehose_get, or interactively from either the Broad GDAC website or TCGA Data Coordination Center Portal.