This pipeline computes the correlation between significant copy number variation (cnv focal) genes and selected clinical features.
Testing the association between copy number variation 45 focal events and 7 clinical features across 80 patients, one significant finding detected with Q value < 0.25.
-
del_4q34.3 cnv correlated to 'Time to Death'.
Table 1. Get Full Table Overview of the association between significant copy number variation of 45 focal events and 7 clinical features. Shown in the table are P values (Q values). Thresholded by Q value < 0.25, one significant finding detected.
|
Clinical Features |
Time to Death |
AGE |
NEOPLASM DISEASESTAGE |
PATHOLOGY T STAGE |
PATHOLOGY N STAGE |
GENDER | ETHNICITY | ||
| nCNV (%) | nWild-Type | logrank test | Wilcoxon-test | Fisher's exact test | Fisher's exact test | Fisher's exact test | Fisher's exact test | Fisher's exact test | |
| del 4q34 3 | 19 (24%) | 61 |
0.000338 (0.107) |
0.941 (1.00) |
0.0355 (1.00) |
0.0598 (1.00) |
0.691 (1.00) |
1 (1.00) |
0.648 (1.00) |
| amp 1q22 | 15 (19%) | 65 |
0.00255 (0.799) |
0.698 (1.00) |
0.737 (1.00) |
0.868 (1.00) |
0.676 (1.00) |
1 (1.00) |
0.602 (1.00) |
| amp 4p16 3 | 36 (45%) | 44 |
0.229 (1.00) |
0.674 (1.00) |
0.946 (1.00) |
0.927 (1.00) |
0.748 (1.00) |
0.638 (1.00) |
0.402 (1.00) |
| amp 4q35 1 | 26 (32%) | 54 |
0.139 (1.00) |
0.582 (1.00) |
0.237 (1.00) |
0.387 (1.00) |
0.153 (1.00) |
0.453 (1.00) |
1 (1.00) |
| amp 5p15 33 | 59 (74%) | 21 |
0.59 (1.00) |
0.718 (1.00) |
0.554 (1.00) |
0.554 (1.00) |
1 (1.00) |
1 (1.00) |
0.39 (1.00) |
| amp 5q35 3 | 57 (71%) | 23 |
0.135 (1.00) |
0.778 (1.00) |
0.411 (1.00) |
0.705 (1.00) |
1 (1.00) |
1 (1.00) |
0.685 (1.00) |
| amp 6p21 31 | 14 (18%) | 66 |
0.5 (1.00) |
0.00412 (1.00) |
0.718 (1.00) |
0.657 (1.00) |
1 (1.00) |
0.76 (1.00) |
0.117 (1.00) |
| amp 6q24 3 | 15 (19%) | 65 |
0.928 (1.00) |
0.405 (1.00) |
0.844 (1.00) |
0.735 (1.00) |
0.193 (1.00) |
0.766 (1.00) |
0.568 (1.00) |
| amp 7p22 1 | 48 (60%) | 32 |
0.975 (1.00) |
0.91 (1.00) |
0.12 (1.00) |
0.136 (1.00) |
0.304 (1.00) |
0.812 (1.00) |
1 (1.00) |
| amp 9q31 3 | 27 (34%) | 53 |
0.000971 (0.305) |
0.863 (1.00) |
0.0285 (1.00) |
0.159 (1.00) |
0.0279 (1.00) |
0.621 (1.00) |
0.221 (1.00) |
| amp 12q14 1 | 62 (78%) | 18 |
0.78 (1.00) |
0.486 (1.00) |
0.932 (1.00) |
0.947 (1.00) |
0.678 (1.00) |
1 (1.00) |
0.154 (1.00) |
| amp 14q11 2 | 23 (29%) | 57 |
0.514 (1.00) |
0.0406 (1.00) |
0.294 (1.00) |
0.413 (1.00) |
0.0277 (1.00) |
0.796 (1.00) |
0.226 (1.00) |
| amp 16p13 3 | 45 (56%) | 35 |
0.457 (1.00) |
0.938 (1.00) |
0.898 (1.00) |
0.953 (1.00) |
1 (1.00) |
0.348 (1.00) |
1 (1.00) |
| amp 16q22 1 | 50 (62%) | 30 |
0.574 (1.00) |
0.429 (1.00) |
0.789 (1.00) |
0.737 (1.00) |
0.739 (1.00) |
0.629 (1.00) |
1 (1.00) |
| amp 16q24 2 | 44 (55%) | 36 |
0.336 (1.00) |
0.877 (1.00) |
0.602 (1.00) |
0.474 (1.00) |
0.742 (1.00) |
0.488 (1.00) |
0.691 (1.00) |
| amp 17q25 3 | 14 (18%) | 66 |
0.5 (1.00) |
0.239 (1.00) |
0.67 (1.00) |
0.473 (1.00) |
0.679 (1.00) |
1 (1.00) |
1 (1.00) |
| amp 19p13 12 | 51 (64%) | 29 |
0.354 (1.00) |
0.0647 (1.00) |
0.171 (1.00) |
0.262 (1.00) |
0.479 (1.00) |
0.808 (1.00) |
0.21 (1.00) |
| amp 19q12 | 48 (60%) | 32 |
0.192 (1.00) |
0.0235 (1.00) |
0.158 (1.00) |
0.258 (1.00) |
0.732 (1.00) |
0.637 (1.00) |
0.108 (1.00) |
| amp xp11 22 | 42 (52%) | 38 |
0.998 (1.00) |
0.686 (1.00) |
0.876 (1.00) |
0.942 (1.00) |
0.332 (1.00) |
0.245 (1.00) |
0.0316 (1.00) |
| amp xq28 | 40 (50%) | 40 |
0.23 (1.00) |
0.814 (1.00) |
0.986 (1.00) |
0.968 (1.00) |
1 (1.00) |
0.815 (1.00) |
1 (1.00) |
| del 1p36 23 | 35 (44%) | 45 |
0.746 (1.00) |
0.47 (1.00) |
0.796 (1.00) |
0.851 (1.00) |
0.742 (1.00) |
0.482 (1.00) |
1 (1.00) |
| del 1q43 | 17 (21%) | 63 |
0.875 (1.00) |
0.613 (1.00) |
0.597 (1.00) |
0.242 (1.00) |
0.425 (1.00) |
0.576 (1.00) |
0.568 (1.00) |
| del 2q22 1 | 17 (21%) | 63 |
0.105 (1.00) |
0.902 (1.00) |
0.356 (1.00) |
0.694 (1.00) |
1 (1.00) |
1 (1.00) |
1 (1.00) |
| del 2q37 3 | 20 (25%) | 60 |
0.413 (1.00) |
0.907 (1.00) |
0.141 (1.00) |
0.831 (1.00) |
1 (1.00) |
1 (1.00) |
0.568 (1.00) |
| del 3q13 31 | 21 (26%) | 59 |
0.0989 (1.00) |
0.223 (1.00) |
0.227 (1.00) |
0.498 (1.00) |
1 (1.00) |
0.188 (1.00) |
0.346 (1.00) |
| del 4q35 1 | 23 (29%) | 57 |
0.0275 (1.00) |
0.823 (1.00) |
0.13 (1.00) |
0.132 (1.00) |
1 (1.00) |
0.438 (1.00) |
0.648 (1.00) |
| del 6p24 3 | 18 (22%) | 62 |
0.671 (1.00) |
0.289 (1.00) |
0.399 (1.00) |
0.89 (1.00) |
1 (1.00) |
0.781 (1.00) |
1 (1.00) |
| del 6q26 | 20 (25%) | 60 |
0.24 (1.00) |
0.215 (1.00) |
0.0246 (1.00) |
0.0397 (1.00) |
0.714 (1.00) |
0.417 (1.00) |
1 (1.00) |
| del 7q32 3 | 8 (10%) | 72 |
0.131 (1.00) |
0.404 (1.00) |
0.701 (1.00) |
0.349 (1.00) |
1 (1.00) |
1 (1.00) |
0.553 (1.00) |
| del 9p23 | 21 (26%) | 59 |
0.0397 (1.00) |
0.857 (1.00) |
0.94 (1.00) |
0.624 (1.00) |
0.439 (1.00) |
0.43 (1.00) |
0.396 (1.00) |
| del 9p21 3 | 24 (30%) | 56 |
0.0261 (1.00) |
0.629 (1.00) |
1 (1.00) |
0.926 (1.00) |
0.266 (1.00) |
0.801 (1.00) |
0.661 (1.00) |
| del 10q23 1 | 9 (11%) | 71 |
0.613 (1.00) |
0.389 (1.00) |
0.317 (1.00) |
0.633 (1.00) |
0.331 (1.00) |
1 (1.00) |
1 (1.00) |
| del 11p15 5 | 26 (32%) | 54 |
0.502 (1.00) |
0.738 (1.00) |
0.488 (1.00) |
0.981 (1.00) |
0.27 (1.00) |
0.211 (1.00) |
1 (1.00) |
| del 11q14 1 | 23 (29%) | 57 |
0.435 (1.00) |
0.46 (1.00) |
0.124 (1.00) |
0.478 (1.00) |
0.719 (1.00) |
0.195 (1.00) |
1 (1.00) |
| del 12q14 2 | 5 (6%) | 75 |
0.0444 (1.00) |
0.33 (1.00) |
0.332 (1.00) |
0.546 (1.00) |
1 (1.00) |
0.653 (1.00) |
1 (1.00) |
| del 13q14 2 | 36 (45%) | 44 |
0.136 (1.00) |
0.558 (1.00) |
0.264 (1.00) |
0.522 (1.00) |
1 (1.00) |
0.638 (1.00) |
1 (1.00) |
| del 14q21 2 | 18 (22%) | 62 |
0.971 (1.00) |
0.751 (1.00) |
0.458 (1.00) |
0.513 (1.00) |
0.106 (1.00) |
0.404 (1.00) |
0.346 (1.00) |
| del 16p13 3 | 6 (8%) | 74 |
0.0538 (1.00) |
0.499 (1.00) |
0.549 (1.00) |
0.423 (1.00) |
0.579 (1.00) |
0.659 (1.00) |
0.124 (1.00) |
| del 16q23 1 | 6 (8%) | 74 |
0.089 (1.00) |
0.596 (1.00) |
0.248 (1.00) |
0.0838 (1.00) |
1 (1.00) |
0.176 (1.00) |
1 (1.00) |
| del 17q11 2 | 23 (29%) | 57 |
0.00474 (1.00) |
0.932 (1.00) |
0.07 (1.00) |
0.0264 (1.00) |
1 (1.00) |
0.0185 (1.00) |
0.648 (1.00) |
| del 17q21 31 | 26 (32%) | 54 |
0.144 (1.00) |
0.735 (1.00) |
0.34 (1.00) |
0.183 (1.00) |
1 (1.00) |
0.0789 (1.00) |
0.387 (1.00) |
| del 17q24 2 | 24 (30%) | 56 |
0.0147 (1.00) |
0.966 (1.00) |
0.00462 (1.00) |
0.125 (1.00) |
0.459 (1.00) |
0.078 (1.00) |
1 (1.00) |
| del 18q21 2 | 34 (42%) | 46 |
0.801 (1.00) |
0.37 (1.00) |
0.443 (1.00) |
0.706 (1.00) |
0.509 (1.00) |
0.0615 (1.00) |
1 (1.00) |
| del 20p12 1 | 9 (11%) | 71 |
0.00643 (1.00) |
0.365 (1.00) |
0.326 (1.00) |
0.411 (1.00) |
0.587 (1.00) |
0.483 (1.00) |
0.0471 (1.00) |
| del 22q12 1 | 46 (58%) | 34 |
0.0998 (1.00) |
0.113 (1.00) |
0.212 (1.00) |
0.116 (1.00) |
0.737 (1.00) |
0.236 (1.00) |
0.244 (1.00) |
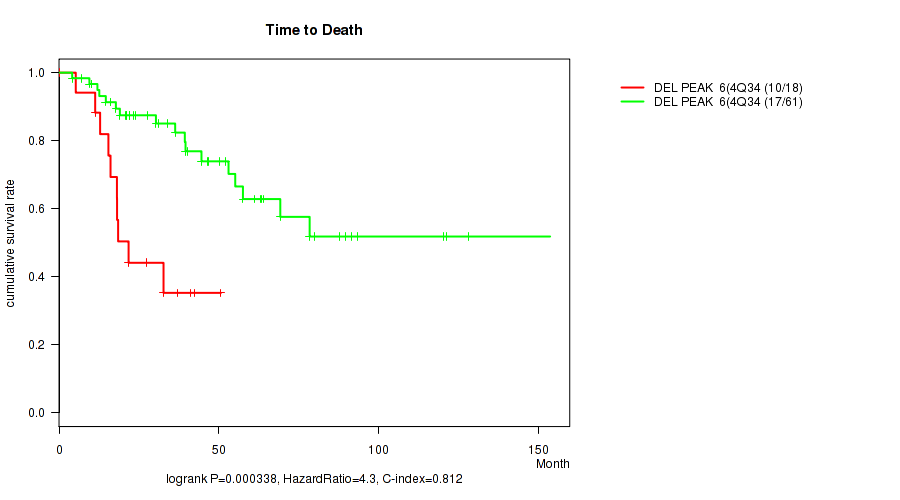
P value = 0.000338 (logrank test), Q value = 0.11
Table S1. Gene #25: 'del_4q34.3' versus Clinical Feature #1: 'Time to Death'
| nPatients | nDeath | Duration Range (Median), Month | |
|---|---|---|---|
| ALL | 79 | 27 | 4.1 - 153.6 (31.2) |
| DEL PEAK 6(4Q34.3) MUTATED | 18 | 10 | 4.9 - 50.7 (18.3) |
| DEL PEAK 6(4Q34.3) WILD-TYPE | 61 | 17 | 4.1 - 153.6 (38.9) |
Figure S1. Get High-res Image Gene #25: 'del_4q34.3' versus Clinical Feature #1: 'Time to Death'
-
Copy number data file = transformed.cor.cli.txt
-
Clinical data file = ACC-TP.merged_data.txt
-
Number of patients = 80
-
Number of significantly focal cnvs = 45
-
Number of selected clinical features = 7
-
Exclude genes that fewer than K tumors have mutations, K = 3
For survival clinical features, the Kaplan-Meier survival curves of tumors with and without gene mutations were plotted and the statistical significance P values were estimated by logrank test (Bland and Altman 2004) using the 'survdiff' function in R
For binary or multi-class clinical features (nominal or ordinal), two-tailed Fisher's exact tests (Fisher 1922) were used to estimate the P values using the 'fisher.test' function in R
For multiple hypothesis correction, Q value is the False Discovery Rate (FDR) analogue of the P value (Benjamini and Hochberg 1995), defined as the minimum FDR at which the test may be called significant. We used the 'Benjamini and Hochberg' method of 'p.adjust' function in R to convert P values into Q values.
In addition to the links below, the full results of the analysis summarized in this report can also be downloaded programmatically using firehose_get, or interactively from either the Broad GDAC website or TCGA Data Coordination Center Portal.