This report serves to describe the mutational landscape and properties of a given individual set, as well as rank genes and genesets according to mutational significance. MutSig v1.5 was used to generate the results found in this report.
-
Working with individual set: ACC-TP
-
Number of patients in set: 91
The input for this pipeline is a set of individuals with the following files associated for each:
-
An annotated .maf file describing the mutations called for the respective individual, and their properties.
-
A .wig file that contains information about the coverage of the sample.
-
MAF used for this analysis:ACC-TP.final_analysis_set.maf
-
Blacklist used for this analysis: pancan_mutation_blacklist.v14.hg19.txt
-
Significantly mutated genes (q ≤ 0.1): 174
-
Mutations seen in COSMIC: 61
-
Significantly mutated genes in COSMIC territory: 4
-
Significantly mutated genesets: 19
-
Significantly mutated genesets: (excluding sig. mutated genes):0
-
Read 91 MAFs of type "Baylor-Illumina"
-
Total number of mutations in input MAFs: 22072
-
After removing 127 mutations outside chr1-24: 21945
-
After removing 1384 blacklisted mutations: 20561
-
After removing 1399 noncoding mutations: 19162
-
After collapsing adjacent/redundant mutations: 19152
-
Number of mutations before filtering: 19152
-
After removing 1118 mutations outside gene set: 18034
-
After removing 67 mutations outside category set: 17967
-
After removing 1 "impossible" mutations in
-
gene-patient-category bins of zero coverage: 16781
Table 1. Get Full Table Table representing breakdown of mutations by type.
| type | count |
|---|---|
| Frame_Shift_Del | 514 |
| Frame_Shift_Ins | 186 |
| In_Frame_Del | 265 |
| In_Frame_Ins | 88 |
| Missense_Mutation | 10304 |
| Nonsense_Mutation | 581 |
| Silent | 5784 |
| Splice_Site | 244 |
| Translation_Start_Site | 1 |
| Total | 17967 |
Table 2. Get Full Table A breakdown of mutation rates per category discovered for this individual set.
| category | n | N | rate | rate_per_mb | relative_rate | exp_ns_s_ratio |
|---|---|---|---|---|---|---|
| *CpG->T | 2031 | 161241575 | 0.000013 | 13 | 2.9 | 2.1 |
| *CpG->(G/A) | 717 | 161241575 | 4.4e-06 | 4.4 | 1 | 2.7 |
| *Cp(A/C/T)->mut | 4997 | 1299803062 | 3.8e-06 | 3.8 | 0.9 | 3.3 |
| A->mut | 2560 | 1387389109 | 1.8e-06 | 1.8 | 0.43 | 3.9 |
| indel+null | 1814 | 2848433746 | 6.4e-07 | 0.64 | 0.15 | NaN |
| double_null | 64 | 2848433746 | 2.2e-08 | 0.022 | 0.0053 | NaN |
| Total | 12183 | 2848433746 | 4.3e-06 | 4.3 | 1 | 3.5 |
The x axis represents the samples. The y axis represents the exons, one row per exon, and they are sorted by average coverage across samples. For exons with exactly the same average coverage, they are sorted next by the %GC of the exon. (The secondary sort is especially useful for the zero-coverage exons at the bottom). If the figure is unpopulated, then full coverage is assumed (e.g. MutSig CV doesn't use WIGs and assumes full coverage).
Figure 1.
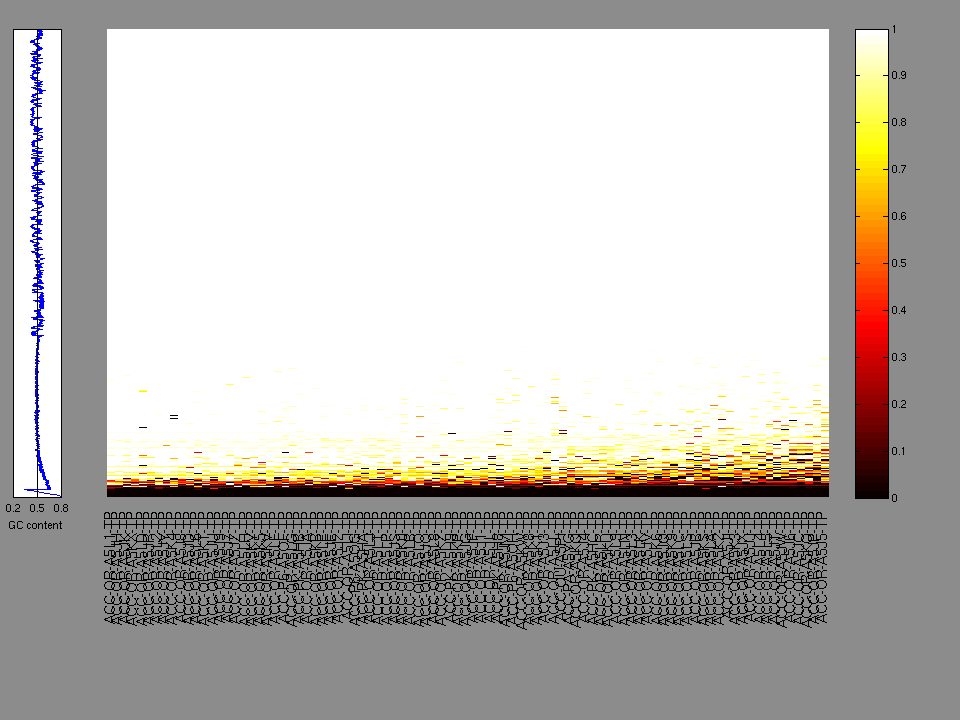
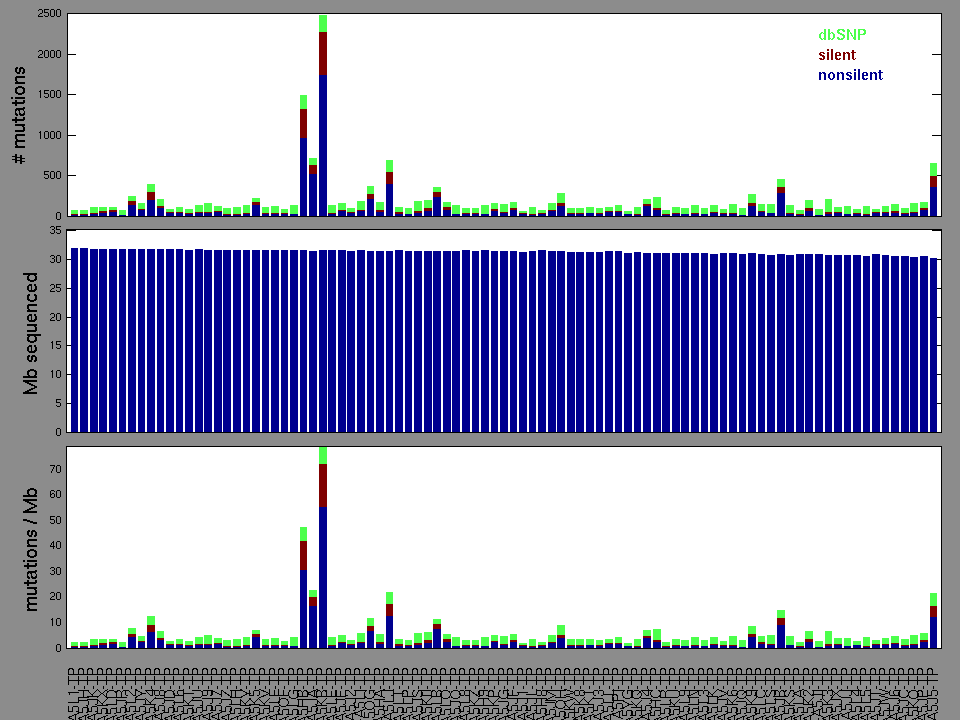
Figure 2. Patients counts and rates file used to generate this plot: ACC-TP.patients.counts_and_rates.txt
The mutation spectrum is depicted in the lego plots below in which the 96 possible mutation types are subdivided into six large blocks, color-coded to reflect the base substitution type. Each large block is further subdivided into the 16 possible pairs of 5' and 3' neighbors, as listed in the 4x4 trinucleotide context legend. The height of each block corresponds to the mutation frequency for that kind of mutation (counts of mutations normalized by the base coverage in a given bin). The shape of the spectrum is a signature for dominant mutational mechanisms in different tumor types.
Figure 3. Get High-res Image SNV Mutation rate lego plot for entire set. Each bin is normalized by base coverage for that bin. Colors represent the six SNV types on the upper right. The three-base context for each mutation is labeled in the 4x4 legend on the lower right. The fractional breakdown of SNV counts is shown in the pie chart on the upper left. If this figure is blank, not enough information was provided in the MAF to generate it.
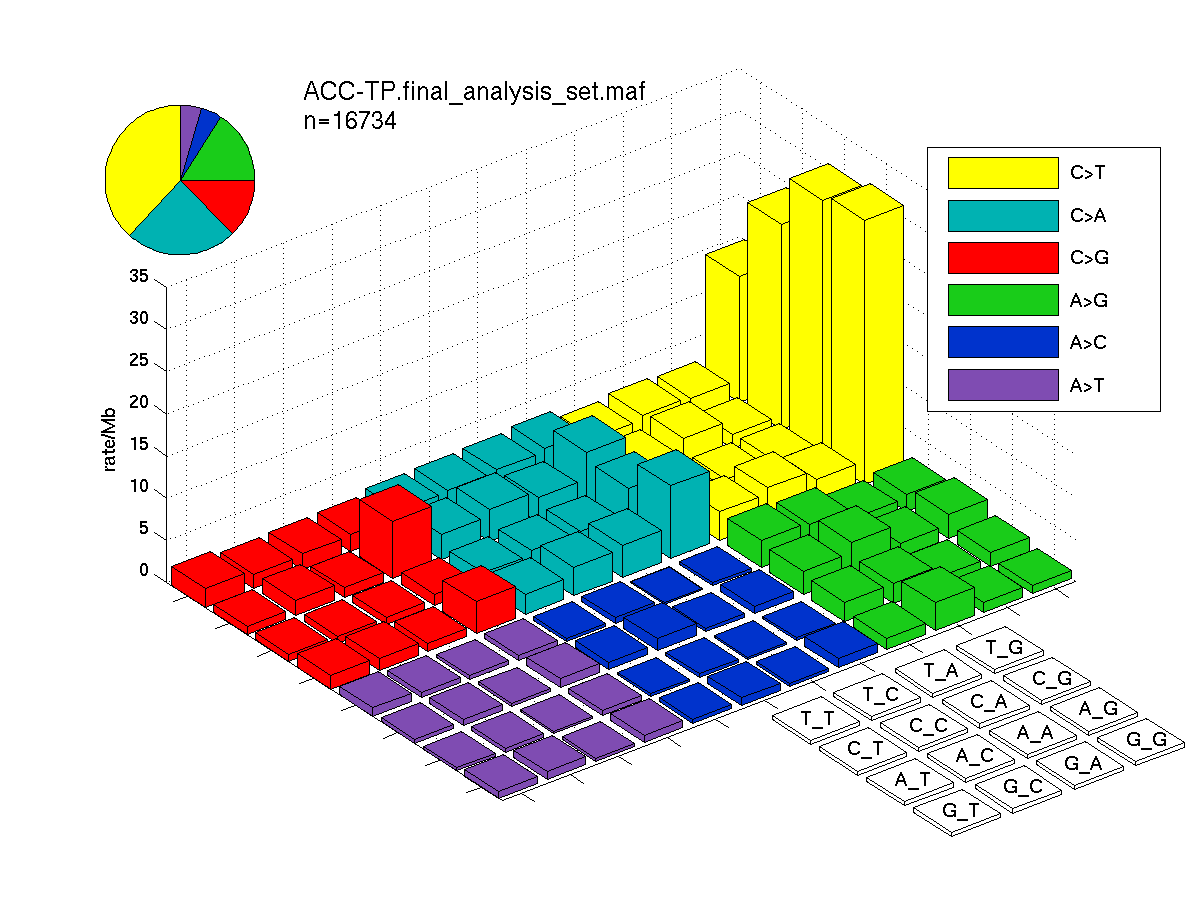
Figure 4. Get High-res Image SNV Mutation rate lego plots for 4 slices of mutation allele fraction (0<=AF<0.1, 0.1<=AF<0.25, 0.25<=AF<0.5, & 0.5<=AF) . The color code and three-base context legends are the same as the previous figure. If this figure is blank, not enough information was provided in the MAF to generate it.

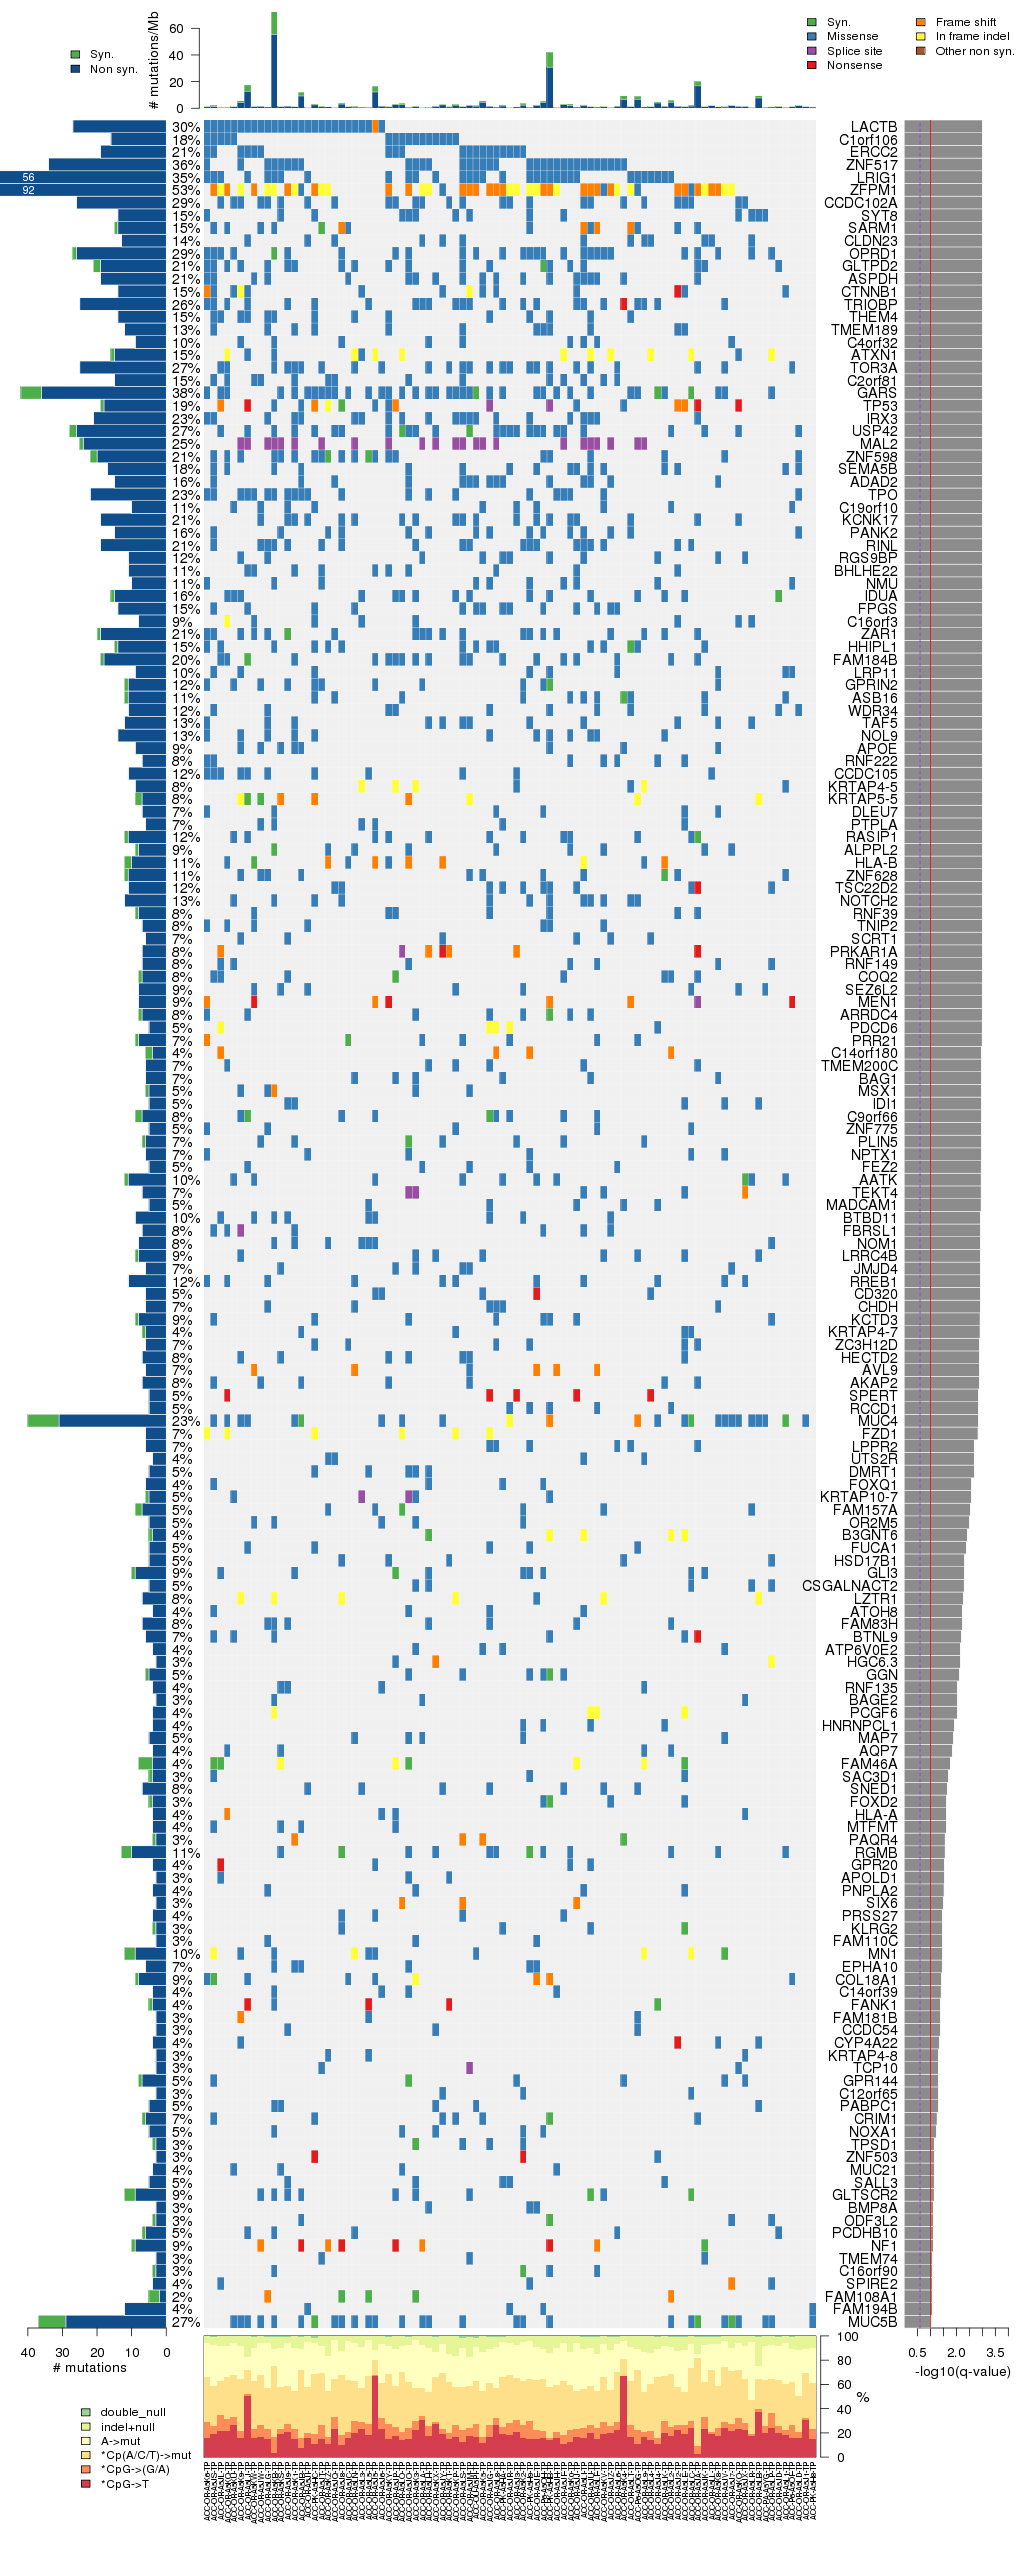
Figure 5. Get High-res Image The matrix in the center of the figure represents individual mutations in patient samples, color-coded by type of mutation, for the significantly mutated genes. The rate of synonymous and non-synonymous mutations is displayed at the top of the matrix. The barplot on the left of the matrix shows the number of mutations in each gene. The percentages represent the fraction of tumors with at least one mutation in the specified gene. The barplot to the right of the matrix displays the q-values for the most significantly mutated genes. The purple boxplots below the matrix (only displayed if required columns are present in the provided MAF) represent the distributions of allelic fractions observed in each sample. The plot at the bottom represents the base substitution distribution of individual samples, using the same categories that were used to calculate significance.
Column Descriptions:
-
N = number of sequenced bases in this gene across the individual set
-
n = number of (nonsilent) mutations in this gene across the individual set
-
npat = number of patients (individuals) with at least one nonsilent mutation
-
nsite = number of unique sites having a non-silent mutation
-
nsil = number of silent mutations in this gene across the individual set
-
n1 = number of nonsilent mutations of type: *CpG->T
-
n2 = number of nonsilent mutations of type: *CpG->(G/A)
-
n3 = number of nonsilent mutations of type: *Cp(A/C/T)->mut
-
n4 = number of nonsilent mutations of type: A->mut
-
n5 = number of nonsilent mutations of type: indel+null
-
n6 = number of nonsilent mutations of type: double_null
-
p_ns_s = p-value for the observed nonsilent/silent ratio being elevated in this gene
-
p = p-value (overall)
-
q = q-value, False Discovery Rate (Benjamini-Hochberg procedure)
Table 3. Get Full Table A Ranked List of Significantly Mutated Genes. Number of significant genes found: 174. Number of genes displayed: 35. Click on a gene name to display its stick figure depicting the distribution of mutations and mutation types across the chosen gene (this feature may not be available for all significant genes).
| rank | gene | description | N | n | npat | nsite | nsil | n1 | n2 | n3 | n4 | n5 | n6 | p_ns_s | p | q |
|---|---|---|---|---|---|---|---|---|---|---|---|---|---|---|---|---|
| 1 | LACTB | lactamase, beta | 117609 | 27 | 27 | 3 | 0 | 0 | 0 | 1 | 25 | 1 | 0 | 0.0012 | <1.00e-15 | <4.20e-12 |
| 2 | C1orf106 | chromosome 1 open reading frame 106 | 160861 | 16 | 16 | 2 | 0 | 15 | 0 | 0 | 1 | 0 | 0 | 0.0062 | <1.00e-15 | <4.20e-12 |
| 3 | ERCC2 | excision repair cross-complementing rodent repair deficiency, complementation group 2 (xeroderma pigmentosum D) | 198357 | 19 | 19 | 1 | 0 | 19 | 0 | 0 | 0 | 0 | 0 | 0.0012 | 1.55e-15 | 4.20e-12 |
| 4 | ZNF517 | zinc finger protein 517 | 113936 | 34 | 33 | 2 | 0 | 0 | 0 | 0 | 34 | 0 | 0 | 0.0076 | 2.11e-15 | 4.20e-12 |
| 5 | LRIG1 | leucine-rich repeats and immunoglobulin-like domains 1 | 285347 | 56 | 32 | 2 | 0 | 0 | 0 | 56 | 0 | 0 | 0 | 3.2e-08 | 2.11e-15 | 4.20e-12 |
| 6 | ZFPM1 | zinc finger protein, multitype 1 | 134629 | 92 | 48 | 5 | 0 | 1 | 0 | 5 | 0 | 65 | 21 | 0.11 | 2.22e-15 | 4.20e-12 |
| 7 | CCDC102A | coiled-coil domain containing 102A | 84493 | 26 | 26 | 1 | 0 | 26 | 0 | 0 | 0 | 0 | 0 | 0.00033 | 2.22e-15 | 4.20e-12 |
| 8 | SYT8 | synaptotagmin VIII | 100867 | 14 | 14 | 3 | 0 | 14 | 0 | 0 | 0 | 0 | 0 | 0.0034 | 2.44e-15 | 4.20e-12 |
| 9 | SARM1 | sterile alpha and TIR motif containing 1 | 138834 | 14 | 14 | 2 | 1 | 0 | 10 | 0 | 0 | 4 | 0 | 0.14 | 3.44e-15 | 4.20e-12 |
| 10 | CLDN23 | claudin 23 | 31563 | 13 | 13 | 1 | 0 | 0 | 0 | 13 | 0 | 0 | 0 | 0.0052 | 3.89e-15 | 4.20e-12 |
| 11 | OPRD1 | opioid receptor, delta 1 | 71003 | 26 | 26 | 1 | 1 | 0 | 0 | 26 | 0 | 0 | 0 | 0.000065 | 4.11e-15 | 4.20e-12 |
| 12 | GLTPD2 | glycolipid transfer protein domain containing 2 | 42681 | 19 | 19 | 1 | 2 | 0 | 19 | 0 | 0 | 0 | 0 | 0.017 | 4.66e-15 | 4.20e-12 |
| 13 | ASPDH | aspartate dehydrogenase domain containing | 75573 | 19 | 19 | 2 | 0 | 0 | 0 | 1 | 18 | 0 | 0 | 0.0084 | 5.22e-15 | 4.20e-12 |
| 14 | CTNNB1 | catenin (cadherin-associated protein), beta 1, 88kDa | 218493 | 14 | 14 | 9 | 0 | 0 | 0 | 4 | 6 | 4 | 0 | 0.063 | 5.22e-15 | 4.20e-12 |
| 15 | TRIOBP | TRIO and F-actin binding protein | 627845 | 25 | 24 | 5 | 0 | 0 | 0 | 3 | 21 | 1 | 0 | 0.0015 | 5.33e-15 | 4.20e-12 |
| 16 | THEM4 | thioesterase superfamily member 4 | 58444 | 14 | 14 | 1 | 0 | 0 | 0 | 0 | 14 | 0 | 0 | 0.032 | 5.44e-15 | 4.20e-12 |
| 17 | TMEM189 | transmembrane protein 189 | 64792 | 12 | 12 | 1 | 0 | 0 | 0 | 0 | 12 | 0 | 0 | 0.18 | 5.55e-15 | 4.20e-12 |
| 18 | C4orf32 | chromosome 4 open reading frame 32 | 22750 | 9 | 9 | 1 | 0 | 0 | 0 | 9 | 0 | 0 | 0 | 0.19 | 5.66e-15 | 4.20e-12 |
| 19 | ATXN1 | ataxin 1 | 203979 | 15 | 14 | 9 | 1 | 0 | 1 | 4 | 0 | 10 | 0 | 0.4 | 5.77e-15 | 4.20e-12 |
| 20 | TOR3A | torsin family 3, member A | 97918 | 25 | 25 | 1 | 0 | 0 | 0 | 0 | 25 | 0 | 0 | 0.03 | 6.11e-15 | 4.20e-12 |
| 21 | C2orf81 | chromosome 2 open reading frame 81 | 154302 | 15 | 14 | 3 | 0 | 0 | 0 | 0 | 15 | 0 | 0 | 0.029 | 6.11e-15 | 4.20e-12 |
| 22 | GARS | glycyl-tRNA synthetase | 186668 | 36 | 35 | 3 | 6 | 1 | 0 | 34 | 1 | 0 | 0 | 0.25 | 6.33e-15 | 4.20e-12 |
| 23 | TP53 | tumor protein p53 | 118459 | 18 | 17 | 18 | 1 | 2 | 0 | 4 | 1 | 10 | 1 | 0.14 | 6.33e-15 | 4.20e-12 |
| 24 | IRX3 | iroquois homeobox 3 | 76649 | 21 | 21 | 1 | 0 | 0 | 0 | 0 | 21 | 0 | 0 | 0.055 | 6.44e-15 | 4.20e-12 |
| 25 | USP42 | ubiquitin specific peptidase 42 | 233660 | 26 | 25 | 4 | 2 | 1 | 20 | 0 | 5 | 0 | 0 | 0.0058 | 6.55e-15 | 4.20e-12 |
| 26 | MAL2 | mal, T-cell differentiation protein 2 | 37533 | 24 | 23 | 2 | 1 | 0 | 0 | 1 | 0 | 23 | 0 | 0.95 | 6.77e-15 | 4.20e-12 |
| 27 | ZNF598 | zinc finger protein 598 | 185362 | 20 | 19 | 5 | 2 | 0 | 1 | 3 | 16 | 0 | 0 | 0.23 | 6.88e-15 | 4.20e-12 |
| 28 | SEMA5B | sema domain, seven thrombospondin repeats (type 1 and type 1-like), transmembrane domain (TM) and short cytoplasmic domain, (semaphorin) 5B | 278346 | 17 | 16 | 2 | 0 | 0 | 0 | 1 | 16 | 0 | 0 | 0.043 | 6.88e-15 | 4.20e-12 |
| 29 | ADAD2 | adenosine deaminase domain containing 2 | 154788 | 15 | 15 | 1 | 0 | 0 | 0 | 15 | 0 | 0 | 0 | 0.005 | 7.22e-15 | 4.20e-12 |
| 30 | TPO | thyroid peroxidase | 232451 | 22 | 21 | 3 | 0 | 1 | 0 | 21 | 0 | 0 | 0 | 0.001 | 7.55e-15 | 4.20e-12 |
| 31 | C19orf10 | chromosome 19 open reading frame 10 | 41209 | 10 | 10 | 1 | 0 | 0 | 10 | 0 | 0 | 0 | 0 | 0.018 | 7.66e-15 | 4.20e-12 |
| 32 | KCNK17 | potassium channel, subfamily K, member 17 | 89242 | 19 | 19 | 2 | 0 | 0 | 0 | 1 | 18 | 0 | 0 | 0.044 | 7.77e-15 | 4.20e-12 |
| 33 | PANK2 | pantothenate kinase 2 (Hallervorden-Spatz syndrome) | 123734 | 15 | 15 | 2 | 0 | 0 | 0 | 15 | 0 | 0 | 0 | 0.024 | 7.99e-15 | 4.20e-12 |
| 34 | RINL | Ras and Rab interactor-like | 104087 | 19 | 19 | 1 | 0 | 0 | 0 | 19 | 0 | 0 | 0 | 0.003 | 8.10e-15 | 4.20e-12 |
| 35 | RGS9BP | regulator of G protein signaling 9 binding protein | 19133 | 11 | 11 | 1 | 0 | 0 | 11 | 0 | 0 | 0 | 0 | 0.0058 | 8.33e-15 | 4.20e-12 |
In this analysis, COSMIC is used as a filter to increase power by restricting the territory of each gene. Cosmic version: v48.
Table 4. Get Full Table Significantly mutated genes (COSMIC territory only). To access the database please go to: COSMIC. Number of significant genes found: 4. Number of genes displayed: 10
| rank | gene | description | n | cos | n_cos | N_cos | cos_ev | p | q |
|---|---|---|---|---|---|---|---|---|---|
| 1 | CTNNB1 | catenin (cadherin-associated protein), beta 1, 88kDa | 14 | 138 | 14 | 12558 | 6397 | 3.4e-13 | 1.5e-09 |
| 2 | TP53 | tumor protein p53 | 18 | 356 | 17 | 32396 | 1628 | 8e-13 | 1.8e-09 |
| 3 | MEN1 | multiple endocrine neoplasia I | 8 | 208 | 5 | 18928 | 25 | 2.7e-08 | 0.000041 |
| 4 | KRTAP5-5 | keratin associated protein 5-5 | 7 | 1 | 2 | 91 | 0 | 7.5e-08 | 0.000085 |
| 5 | ABCA12 | ATP-binding cassette, sub-family A (ABC1), member 12 | 3 | 1 | 1 | 91 | 1 | 0.00039 | 0.22 |
| 6 | ANKRD30A | ankyrin repeat domain 30A | 7 | 1 | 1 | 91 | 1 | 0.00039 | 0.22 |
| 7 | CCND2 | cyclin D2 | 1 | 1 | 1 | 91 | 1 | 0.00039 | 0.22 |
| 8 | LACE1 | lactation elevated 1 | 1 | 1 | 1 | 91 | 1 | 0.00039 | 0.22 |
| 9 | GRM3 | glutamate receptor, metabotropic 3 | 4 | 2 | 1 | 182 | 1 | 0.00078 | 0.35 |
| 10 | IGFBP3 | insulin-like growth factor binding protein 3 | 1 | 2 | 1 | 182 | 1 | 0.00078 | 0.35 |
Note:
n - number of (nonsilent) mutations in this gene across the individual set.
cos = number of unique mutated sites in this gene in COSMIC
n_cos = overlap between n and cos.
N_cos = number of individuals times cos.
cos_ev = total evidence: number of reports in COSMIC for mutations seen in this gene.
p = p-value for seeing the observed amount of overlap in this gene)
q = q-value, False Discovery Rate (Benjamini-Hochberg procedure)
Table 5. Get Full Table A Ranked List of Significantly Mutated Genesets. (Source: MSigDB GSEA Cannonical Pathway Set).Number of significant genesets found: 19. Number of genesets displayed: 10
| rank | geneset | description | genes | N_genes | mut_tally | N | n | npat | nsite | nsil | n1 | n2 | n3 | n4 | n5 | n6 | p_ns_s | p | q |
|---|---|---|---|---|---|---|---|---|---|---|---|---|---|---|---|---|---|---|---|
| 1 | FOLATE_BIOSYNTHESIS | ALPI, ALPL, ALPP, ALPP, ALPPL2, ALPPL2, DHFR, FPGS, GCH1, GGH, SPR | 9 | ALPI(1), ALPP(1), ALPPL2(8), FPGS(14), SPR(1) | 931966 | 25 | 23 | 7 | 2 | 0 | 9 | 3 | 13 | 0 | 0 | 0.041 | 2e-13 | 1.3e-10 | |
| 2 | STILBENE_COUMARINE_AND_LIGNIN_BIOSYNTHESIS | EPX, GBA3, LPO, MPO, PRDX1, PRDX2, PRDX5, PRDX6, TPO, TYR | 10 | EPX(1), PRDX1(1), PRDX2(2), TPO(22) | 1351480 | 26 | 25 | 7 | 2 | 3 | 0 | 21 | 0 | 2 | 0 | 0.016 | 4.2e-09 | 1.3e-06 | |
| 3 | HSA00940_PHENYLPROPANOID_BIOSYNTHESIS | Genes involved in phenylpropanoid biosynthesis | EPX, GBA, GBA3, LPO, MPO, PRDX6, TPO | 7 | EPX(1), TPO(22) | 1167797 | 23 | 22 | 4 | 2 | 2 | 0 | 21 | 0 | 0 | 0 | 0.018 | 5.3e-08 | 0.000011 |
| 4 | SA_G1_AND_S_PHASES | Cdk2, 4, and 6 bind cyclin D in G1, while cdk2/cyclin E promotes the G1/S transition. | ARF1, ARF3, CCND1, CDK2, CDK4, CDKN1A, CDKN1B, CDKN2A, CFL1, E2F1, E2F2, MDM2, NXT1, PRB1, TP53 | 15 | ARF3(1), CDKN2A(2), MDM2(2), TP53(18) | 1136927 | 23 | 18 | 23 | 2 | 2 | 0 | 7 | 1 | 12 | 1 | 0.1 | 4.3e-07 | 0.000067 |
| 5 | METHANE_METABOLISM | ADH5, ATP6V0C, SHMT1, CAT, EPX, LPO, MPO, PRDX1, PRDX2, PRDX5, PRDX6, SHMT1, SHMT2, TPO | 13 | ATP6V0C(1), EPX(1), PRDX1(1), PRDX2(2), SHMT2(1), TPO(22) | 1646854 | 28 | 27 | 9 | 3 | 4 | 0 | 22 | 0 | 2 | 0 | 0.025 | 5.8e-07 | 0.000072 | |
| 6 | PMLPATHWAY | Ring-shaped PML nuclear bodies regulate transcription and are required co-activators in p53- and DAXX-mediated apoptosis. | CREBBP, DAXX, HRAS, PAX3, PML, PRAM-1, RARA, RB1, SIRT1, SP100, TNF, TNFRSF1A, TNFRSF1B, TNFRSF6, TNFSF6, TP53, UBL1 | 13 | CREBBP(1), DAXX(4), PML(2), RARA(1), RB1(2), SIRT1(1), TNFRSF1A(1), TP53(18) | 2581860 | 30 | 24 | 30 | 2 | 3 | 1 | 7 | 1 | 17 | 1 | 0.046 | 8.9e-07 | 0.000092 |
| 7 | RNAPATHWAY | dsRNA-activated protein kinase phosphorylates elF2a, which generally inhibits translation, and activates NF-kB to provoke inflammation. | CHUK, DNAJC3, EIF2S1, EIF2S2, MAP3K14, NFKB1, NFKBIA, PRKR, RELA, TP53 | 9 | NFKB1(1), TP53(18) | 1406891 | 19 | 17 | 19 | 1 | 2 | 0 | 5 | 1 | 10 | 1 | 0.12 | 3.1e-06 | 0.00027 |
| 8 | PLK3PATHWAY | Active Plk3 phosphorylates CDC25c, blocking the G2/M transition, and phosphorylates p53 to induce apoptosis. | ATM, ATR, CDC25C, CHEK1, CHEK2, CNK, TP53, YWHAH | 7 | ATM(5), ATR(3), CHEK2(2), TP53(18) | 2129466 | 28 | 24 | 28 | 4 | 3 | 0 | 6 | 3 | 15 | 1 | 0.48 | 4.1e-06 | 0.00031 |
| 9 | P53PATHWAY | p53 induces cell cycle arrest or apoptosis under conditions of DNA damage. | APAF1, ATM, BAX, BCL2, CCND1, CCNE1, CDK2, CDK4, CDKN1A, E2F1, GADD45A, MDM2, PCNA, RB1, TIMP3, TP53 | 16 | APAF1(1), ATM(5), MDM2(2), RB1(2), TIMP3(1), TP53(18) | 2444225 | 29 | 23 | 29 | 3 | 2 | 0 | 6 | 1 | 19 | 1 | 0.21 | 4.5e-06 | 0.00031 |
| 10 | GSPATHWAY | Activated G-protein coupled receptors stimulate cAMP production and thus activate protein kinase A, involved in a number of signal transduction pathways. | ADCY1, GNAS, GNB1, GNGT1, PRKACA, PRKAR1A | 6 | ADCY1(1), GNAS(5), GNB1(2), PRKACA(1), PRKAR1A(7) | 931484 | 16 | 15 | 15 | 2 | 1 | 0 | 3 | 2 | 10 | 0 | 0.51 | 0.000059 | 0.0036 |
Table 6. Get Full Table A Ranked List of Significantly Mutated Genesets (Excluding Significantly Mutated Genes). Number of significant genesets found: 0. Number of genesets displayed: 10
| rank | geneset | description | genes | N_genes | mut_tally | N | n | npat | nsite | nsil | n1 | n2 | n3 | n4 | n5 | n6 | p_ns_s | p | q |
|---|---|---|---|---|---|---|---|---|---|---|---|---|---|---|---|---|---|---|---|
| 1 | HSA00472_D_ARGININE_AND_D_ORNITHINE_METABOLISM | Genes involved in D-arginine and D-ornithine metabolism | DAO | 1 | DAO(2) | 98644 | 2 | 2 | 2 | 0 | 1 | 0 | 0 | 0 | 1 | 0 | 0.51 | 0.014 | 1 |
| 2 | BBCELLPATHWAY | Fas ligand expression by T cells induces apoptosis in Fas-expressing, inactive B cells. | CD28, CD4, HLA-DRA, HLA-DRB1, TNFRSF5, TNFRSF6, TNFSF5, TNFSF6 | 4 | HLA-DRB1(3) | 332581 | 3 | 3 | 3 | 1 | 0 | 0 | 2 | 1 | 0 | 0 | 0.74 | 0.065 | 1 |
| 3 | EOSINOPHILSPATHWAY | Recruitment of eosinophils in the inflammatory response observed in asthma occurs via the chemoattractant eotaxin binding to the CCR3 receptor. | CCL11, CCL5, CCR3, CSF2, HLA-DRA, HLA-DRB1, IL3, IL5 | 8 | CCL11(1), CCR3(1), HLA-DRB1(3), IL3(1) | 411853 | 6 | 5 | 6 | 2 | 0 | 0 | 4 | 2 | 0 | 0 | 0.68 | 0.088 | 1 |
| 4 | CAPROLACTAM_DEGRADATION | AKR1A1, ECHS1, EHHADH, HADHA, SDS | 5 | AKR1A1(1), ECHS1(2), EHHADH(1), HADHA(1), SDS(1) | 672997 | 6 | 5 | 6 | 1 | 1 | 0 | 2 | 1 | 2 | 0 | 0.54 | 0.095 | 1 | |
| 5 | ARGININECPATHWAY | Related catabolic pathways process arginine, histidine, glutamine, and proline through glutamate to alpha-ketoglutamate, which feeds into the citric acid cycle. | ALDH4A1, ARG1, GLS, GLUD1, OAT, PRODH | 6 | GLUD1(1), PRODH(4) | 817853 | 5 | 5 | 4 | 0 | 1 | 1 | 0 | 3 | 0 | 0 | 0.25 | 0.098 | 1 |
| 6 | CYSTEINE_METABOLISM | CARS, CTH, GOT1, GOT2, LDHA, LDHB, LDHC, MPST | 8 | CTH(1), GOT1(1), GOT2(2), LDHA(3) | 920795 | 7 | 7 | 7 | 2 | 3 | 0 | 2 | 1 | 1 | 0 | 0.65 | 0.11 | 1 | |
| 7 | HSA00401_NOVOBIOCIN_BIOSYNTHESIS | Genes involved in novobiocin biosynthesis | GOT1, GOT2, TAT | 3 | GOT1(1), GOT2(2) | 360688 | 3 | 3 | 3 | 0 | 2 | 0 | 1 | 0 | 0 | 0 | 0.4 | 0.12 | 1 |
| 8 | SULFUR_METABOLISM | BPNT1, PAPSS1, PAPSS2, SULT1A2, SULT1A3, SULT1A3, SULT1A4, SULT1E1, SULT2A1, SUOX | 7 | BPNT1(3), PAPSS2(1), SUOX(2) | 824400 | 6 | 5 | 6 | 1 | 0 | 0 | 3 | 0 | 2 | 1 | 0.78 | 0.13 | 1 | |
| 9 | UBIQUINONE_BIOSYNTHESIS | NDUFA1, NDUFA10, NDUFA11, NDUFA4, NDUFA5, NDUFA8, NDUFB2, NDUFB4, NDUFB5, NDUFB6, NDUFB7, NDUFS1, NDUFS2, NDUFV1, NDUFV2 | 15 | NDUFA1(1), NDUFA10(2), NDUFB5(2), NDUFB7(1), NDUFS2(1) | 975354 | 7 | 6 | 7 | 0 | 1 | 0 | 4 | 0 | 2 | 0 | 0.22 | 0.14 | 1 | |
| 10 | BLOOD_GROUP_GLYCOLIPID_BIOSYNTHESIS_LACTOSERIES | ABO, FUT1, FUT2, FUT3, FUT5, FUT6, SIAT6, ST3GAL3 | 7 | FUT3(3), FUT6(2) | 715421 | 5 | 5 | 5 | 1 | 2 | 0 | 2 | 1 | 0 | 0 | 0.44 | 0.16 | 1 |
In brief, we tabulate the number of mutations and the number of covered bases for each gene. The counts are broken down by mutation context category: four context categories that are discovered by MutSig, and one for indel and 'null' mutations, which include indels, nonsense mutations, splice-site mutations, and non-stop (read-through) mutations. For each gene, we calculate the probability of seeing the observed constellation of mutations, i.e. the product P1 x P2 x ... x Pm, or a more extreme one, given the background mutation rates calculated across the dataset. [1]
In addition to the links below, the full results of the analysis summarized in this report can also be downloaded programmatically using firehose_get, or interactively from either the Broad GDAC website or TCGA Data Coordination Center Portal.