This pipeline computes the correlation between significant copy number variation (cnv focal) genes and molecular subtypes.
Testing the association between copy number variation 57 focal events and 8 molecular subtypes across 206 patients, 38 significant findings detected with P value < 0.05 and Q value < 0.25.
-
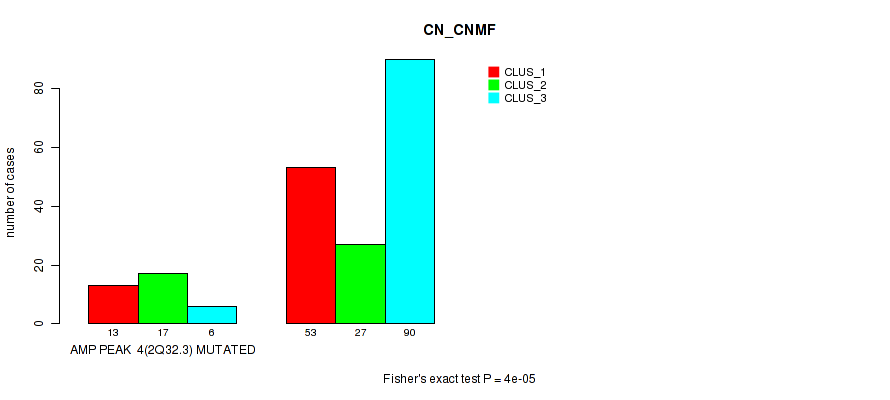
amp_2q32.3 cnv correlated to 'CN_CNMF'.
-
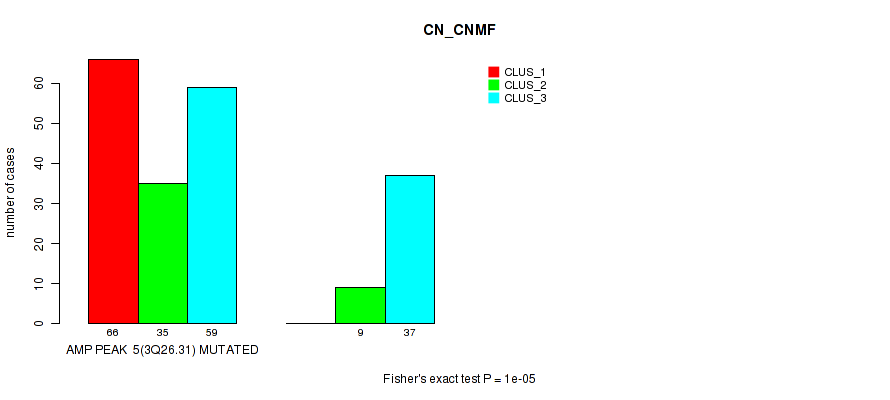
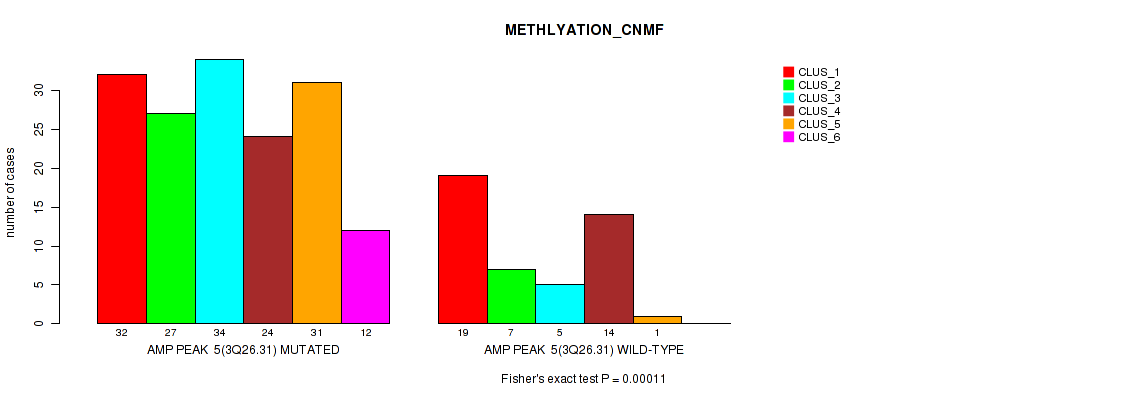
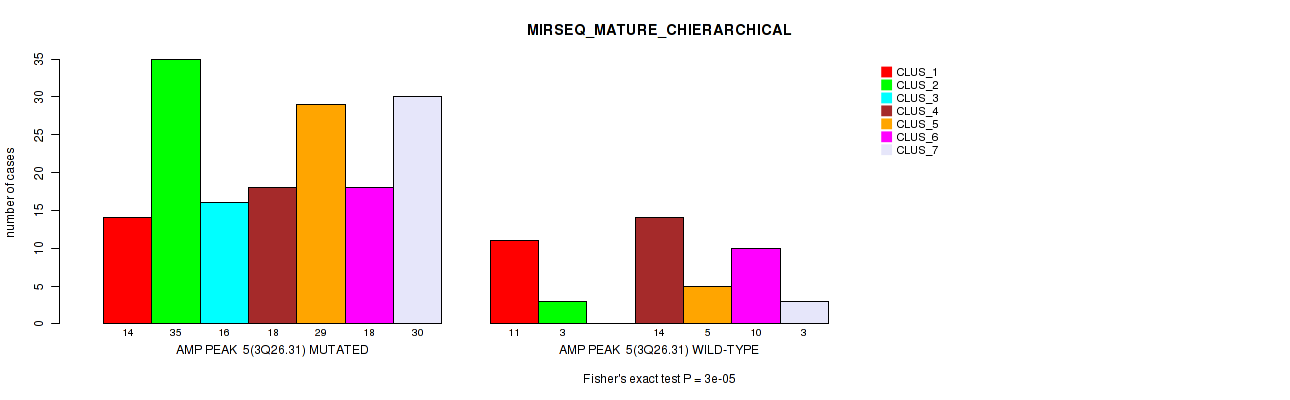
amp_3q26.31 cnv correlated to 'CN_CNMF', 'METHLYATION_CNMF', 'MRNASEQ_CHIERARCHICAL', and 'MIRSEQ_MATURE_CHIERARCHICAL'.
-
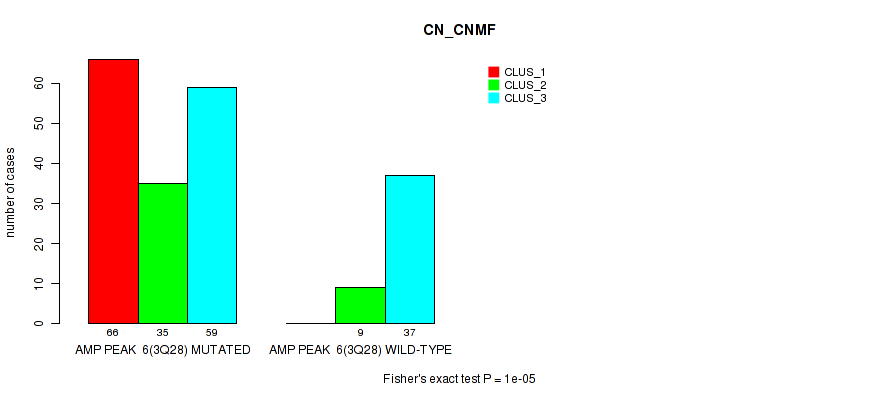
amp_3q28 cnv correlated to 'CN_CNMF', 'METHLYATION_CNMF', 'MRNASEQ_CHIERARCHICAL', 'MIRSEQ_CHIERARCHICAL', and 'MIRSEQ_MATURE_CHIERARCHICAL'.
-
amp_5p15.33 cnv correlated to 'CN_CNMF'.
-
amp_7p11.2 cnv correlated to 'CN_CNMF'.
-
amp_11q13.3 cnv correlated to 'MRNASEQ_CHIERARCHICAL'.
-
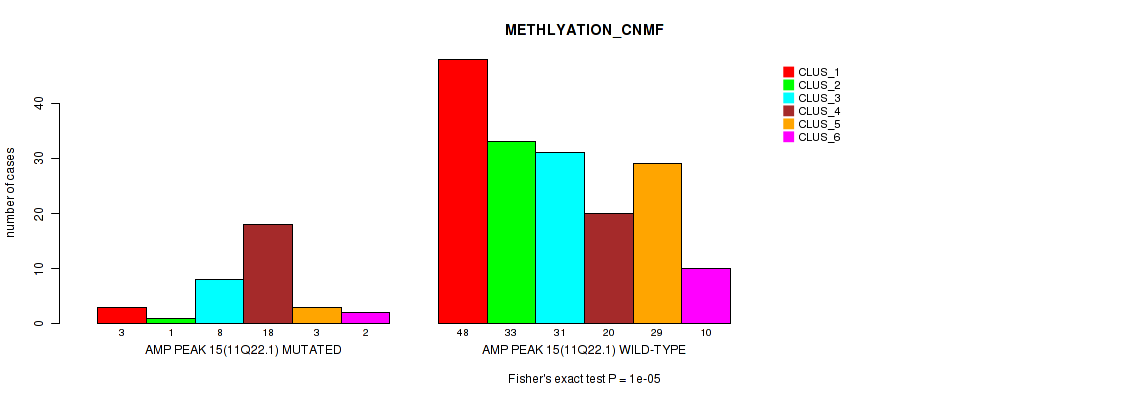
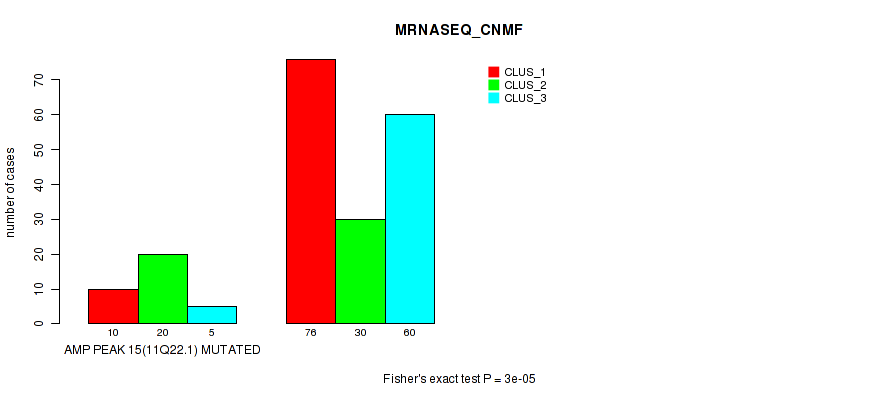
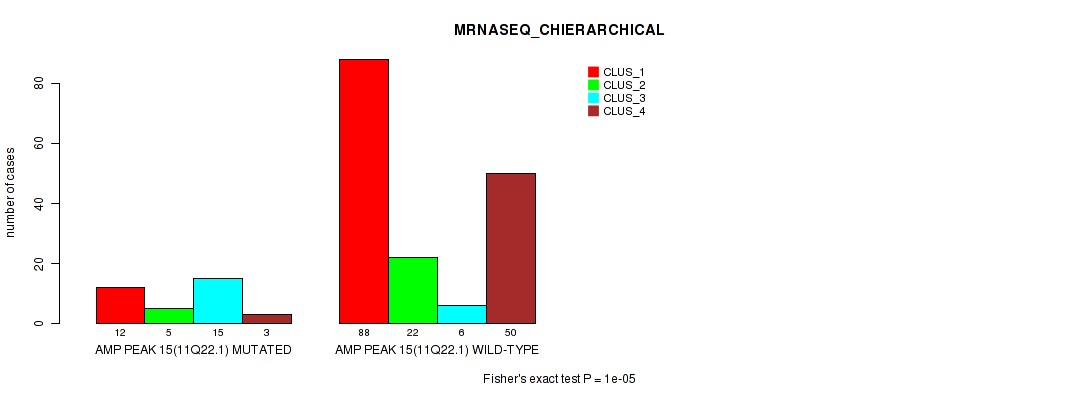
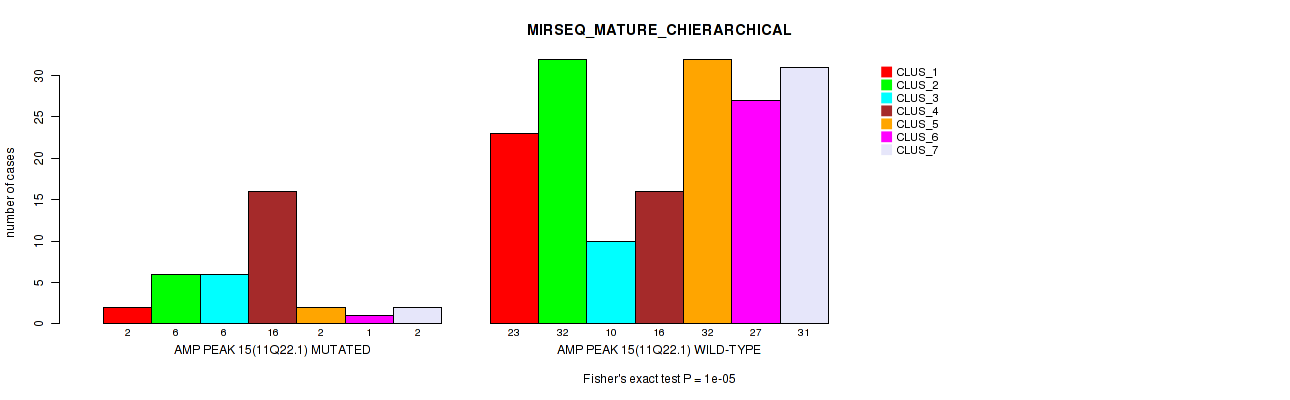
amp_11q22.1 cnv correlated to 'CN_CNMF', 'METHLYATION_CNMF', 'MRNASEQ_CNMF', 'MRNASEQ_CHIERARCHICAL', and 'MIRSEQ_MATURE_CHIERARCHICAL'.
-
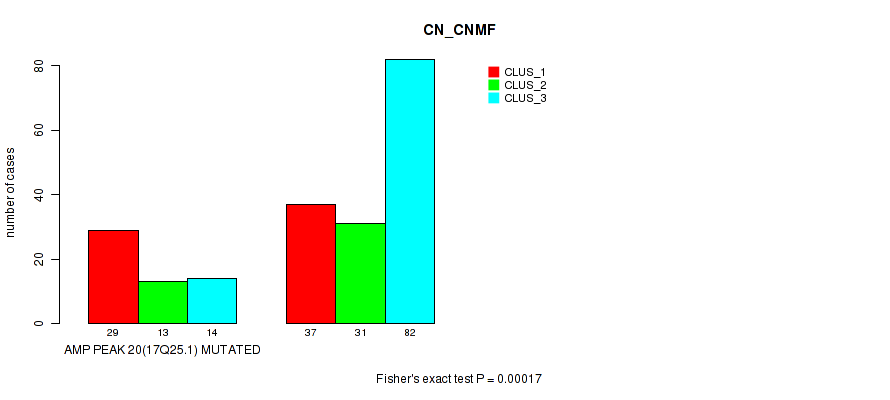
amp_17q25.1 cnv correlated to 'CN_CNMF'.
-
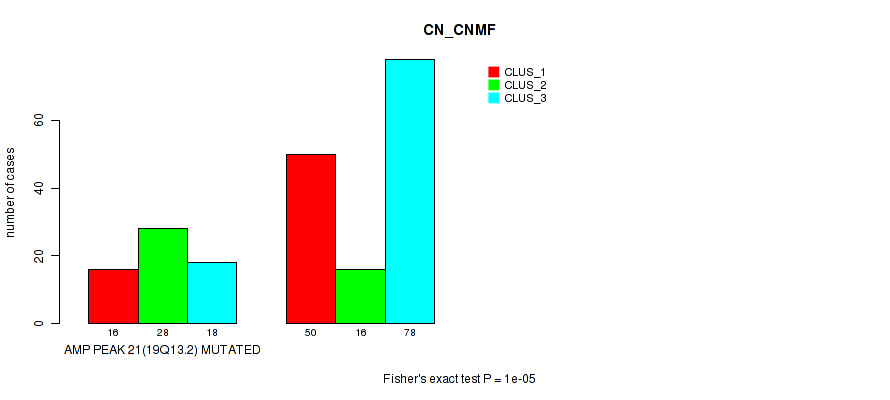
amp_19q13.2 cnv correlated to 'CN_CNMF'.
-
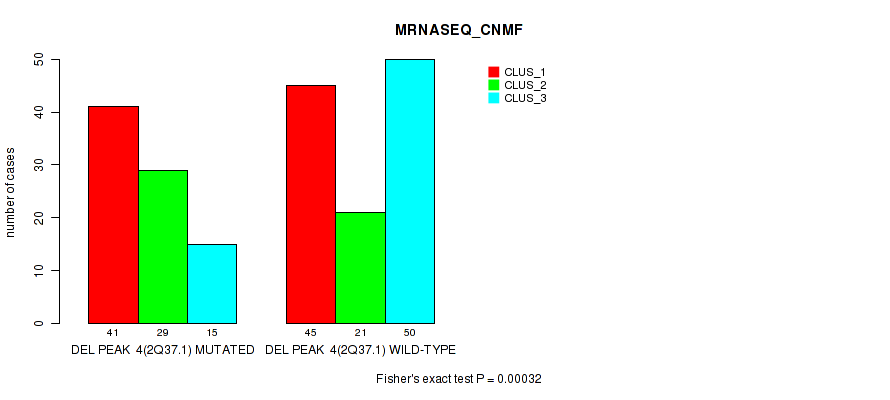
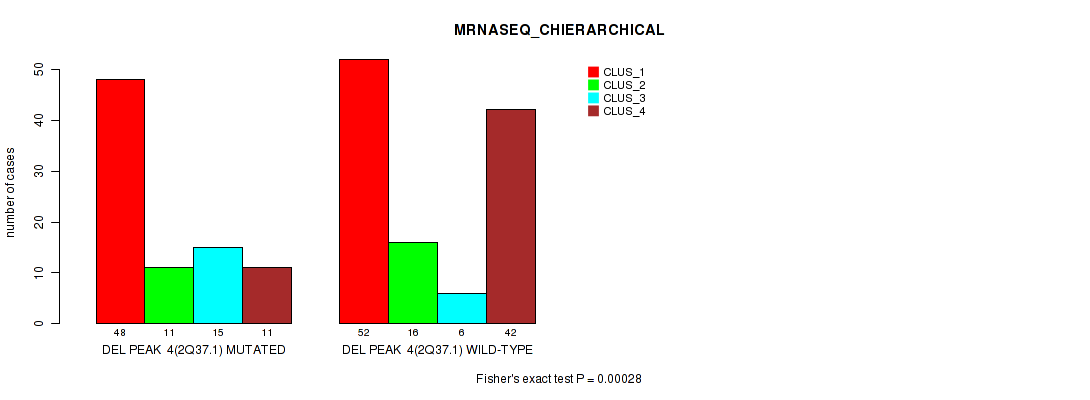
del_2q37.1 cnv correlated to 'MRNASEQ_CNMF' and 'MRNASEQ_CHIERARCHICAL'.
-
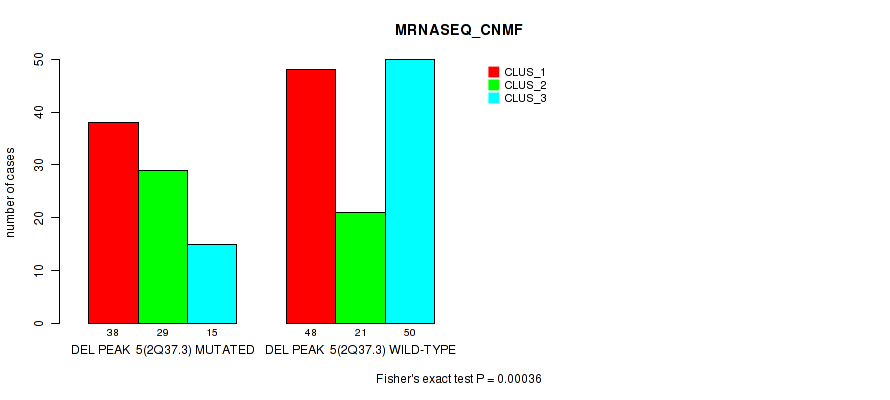
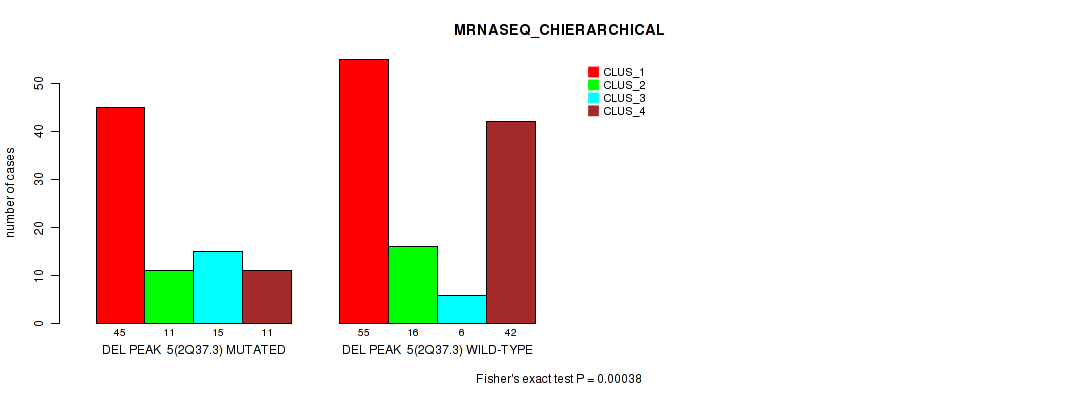
del_2q37.3 cnv correlated to 'MRNASEQ_CNMF' and 'MRNASEQ_CHIERARCHICAL'.
-
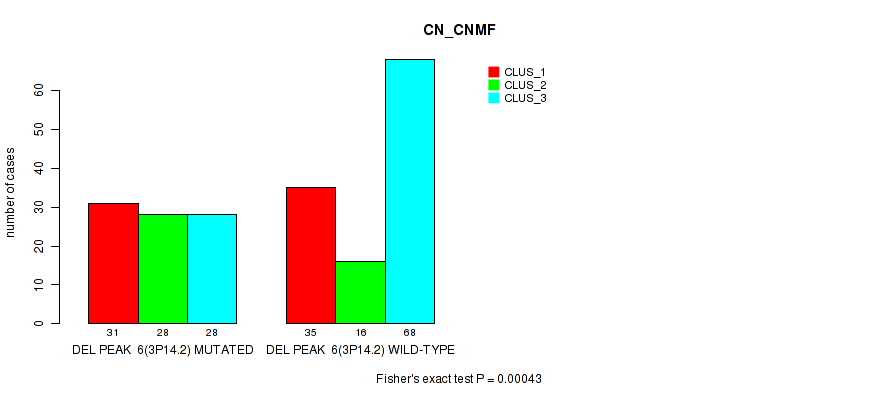
del_3p14.2 cnv correlated to 'CN_CNMF'.
-
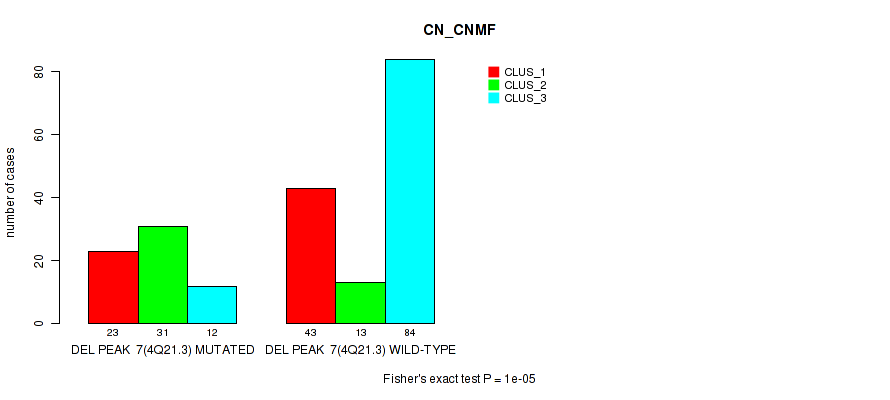
del_4q21.3 cnv correlated to 'CN_CNMF'.
-
del_4q22.1 cnv correlated to 'CN_CNMF'.
-
del_4q35.2 cnv correlated to 'CN_CNMF'.
-
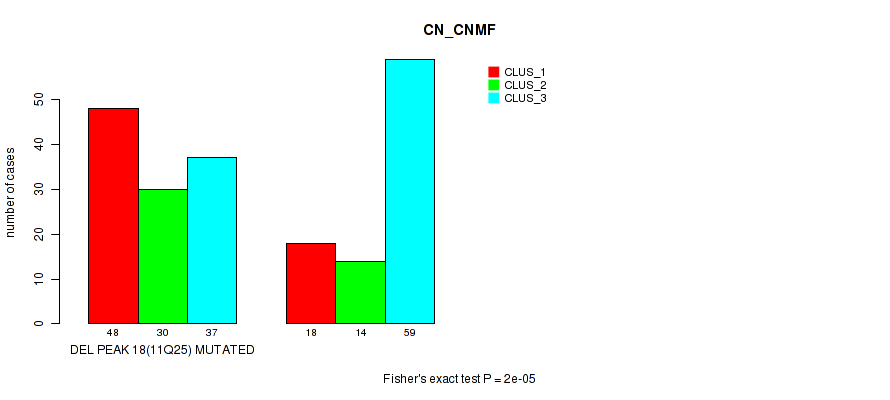
del_11q25 cnv correlated to 'CN_CNMF'.
-
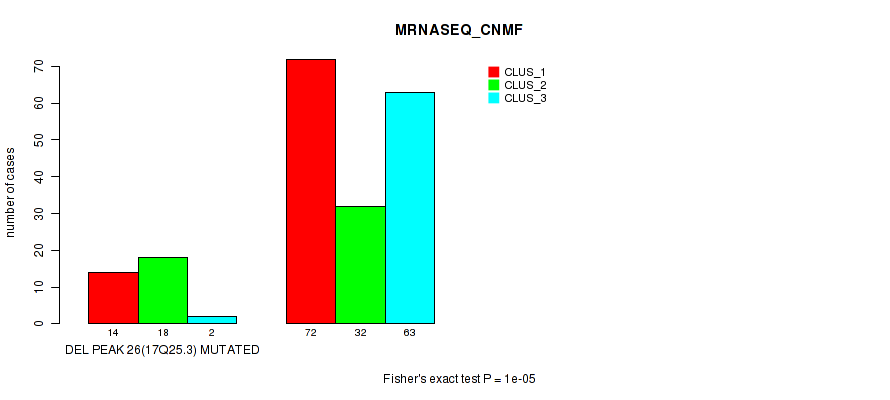
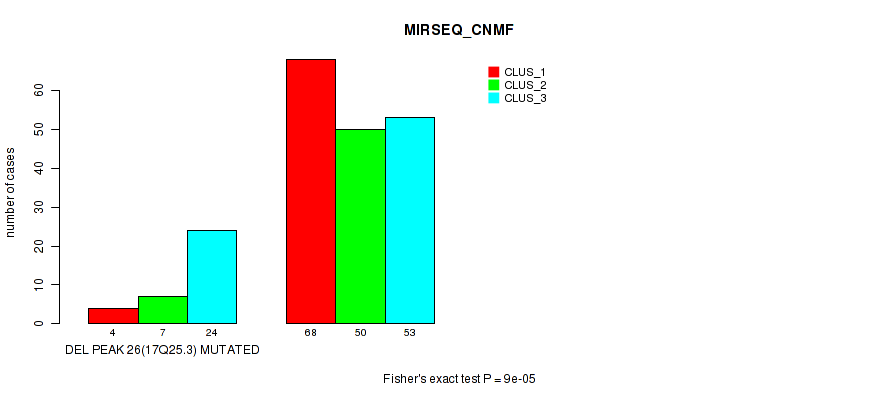
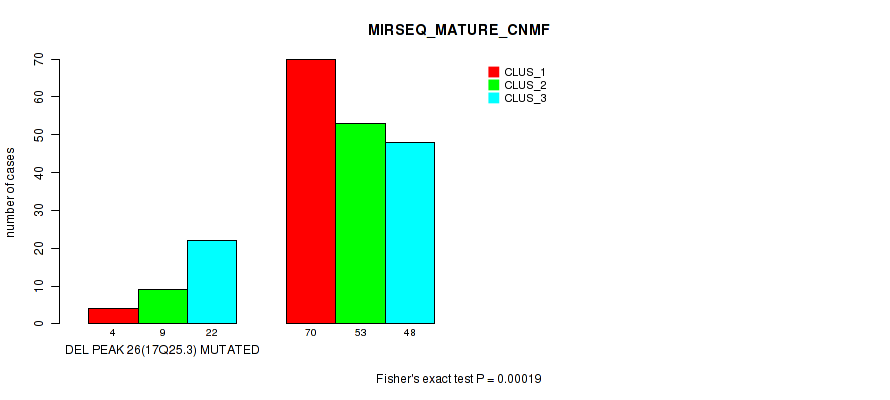
del_17q25.3 cnv correlated to 'MRNASEQ_CNMF', 'MIRSEQ_CNMF', and 'MIRSEQ_MATURE_CNMF'.
-
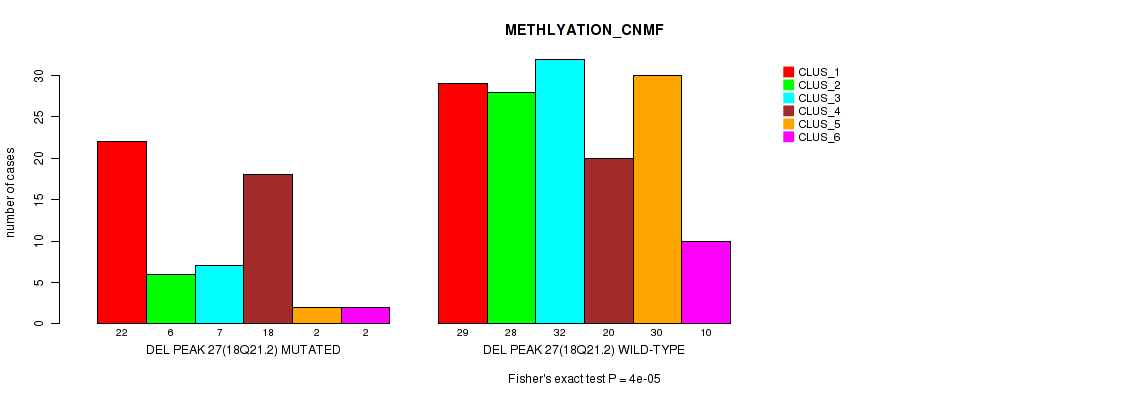
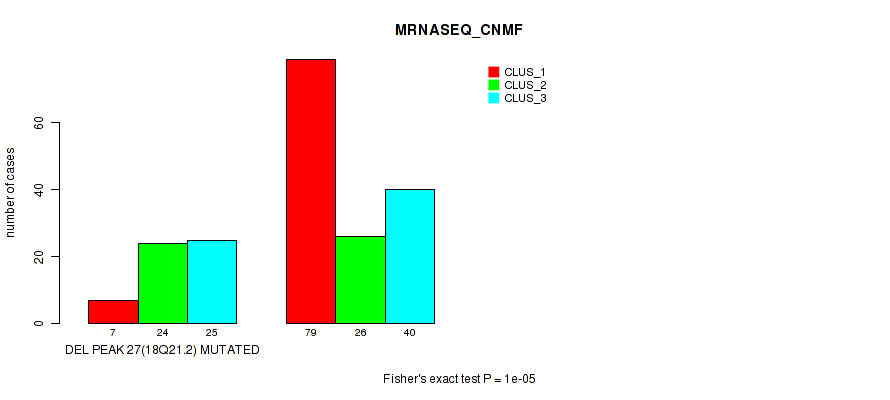
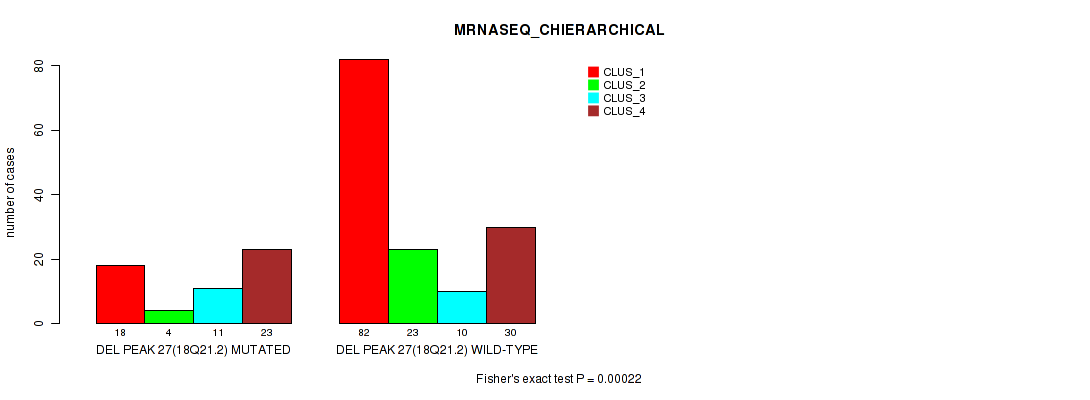
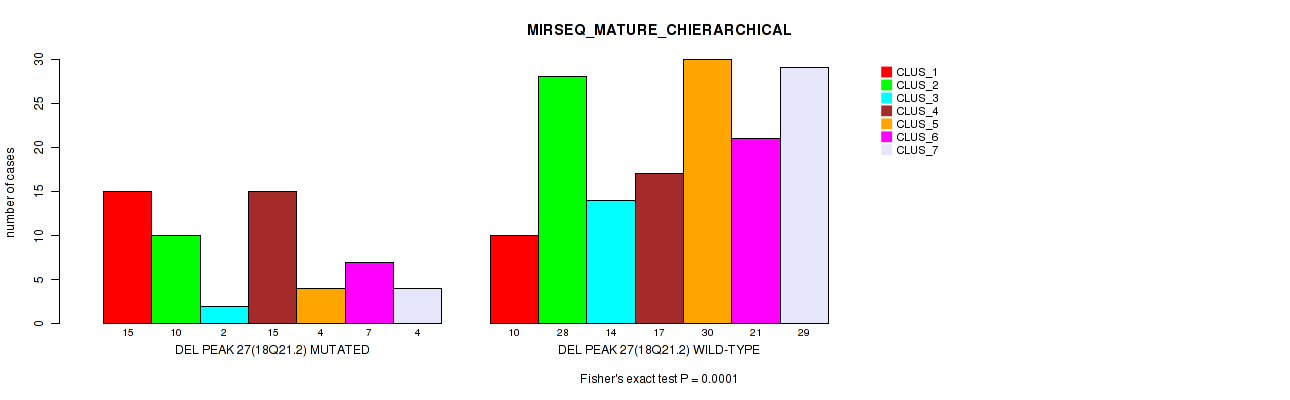
del_18q21.2 cnv correlated to 'METHLYATION_CNMF', 'MRNASEQ_CNMF', 'MRNASEQ_CHIERARCHICAL', and 'MIRSEQ_MATURE_CHIERARCHICAL'.
-
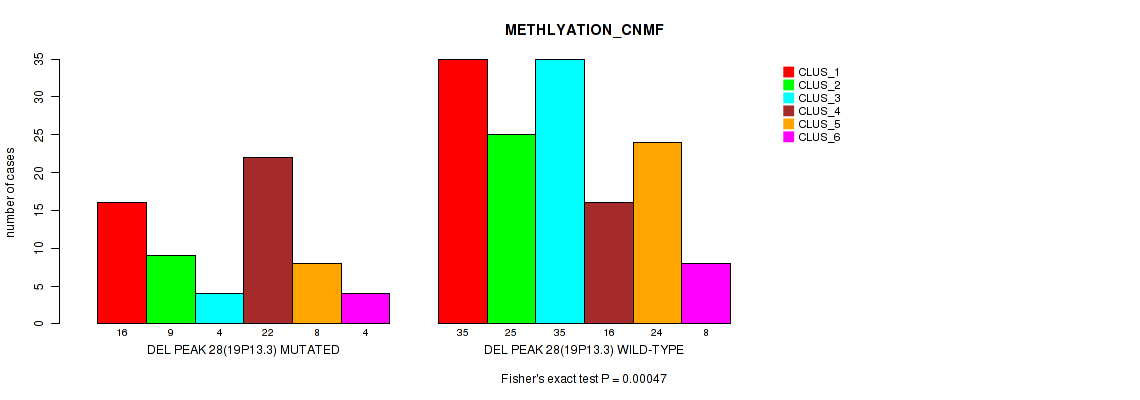
del_19p13.3 cnv correlated to 'METHLYATION_CNMF'.
-
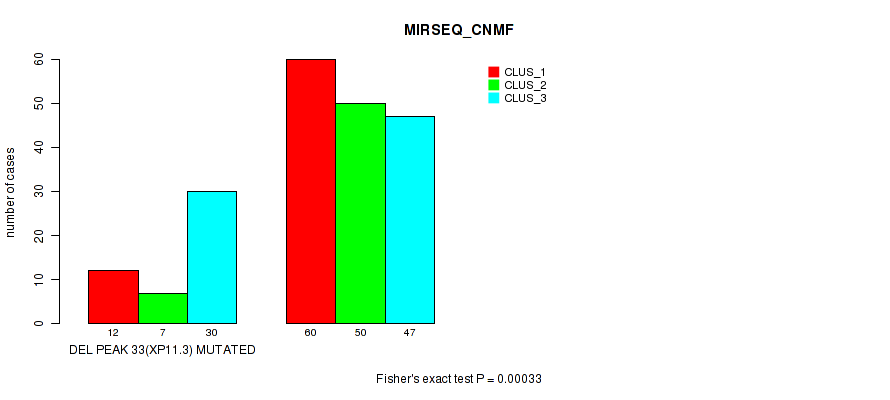
del_xp11.3 cnv correlated to 'MIRSEQ_CNMF'.
Table 1. Get Full Table Overview of the association between significant copy number variation of 57 focal events and 8 molecular subtypes. Shown in the table are P values (Q values). Thresholded by P value < 0.05 and Q value < 0.25, 38 significant findings detected.
|
Clinical Features |
CN CNMF |
METHLYATION CNMF |
MRNASEQ CNMF |
MRNASEQ CHIERARCHICAL |
MIRSEQ CNMF |
MIRSEQ CHIERARCHICAL |
MIRSEQ MATURE CNMF |
MIRSEQ MATURE CHIERARCHICAL |
||
| nCNV (%) | nWild-Type | Fisher's exact test | Fisher's exact test | Fisher's exact test | Fisher's exact test | Fisher's exact test | Fisher's exact test | Fisher's exact test | Fisher's exact test | |
| amp 3q28 | 160 (78%) | 46 |
1e-05 (0.00456) |
4e-05 (0.0175) |
0.00195 (0.772) |
0.00059 (0.247) |
0.0261 (1.00) |
0.00041 (0.173) |
0.00984 (1.00) |
3e-05 (0.0132) |
| amp 11q22 1 | 35 (17%) | 171 |
2e-05 (0.00888) |
1e-05 (0.00456) |
3e-05 (0.0132) |
1e-05 (0.00456) |
0.0145 (1.00) |
0.0586 (1.00) |
0.00066 (0.276) |
1e-05 (0.00456) |
| amp 3q26 31 | 160 (78%) | 46 |
1e-05 (0.00456) |
0.00011 (0.0475) |
0.00247 (0.971) |
0.00035 (0.149) |
0.0332 (1.00) |
0.00079 (0.327) |
0.0113 (1.00) |
3e-05 (0.0132) |
| del 18q21 2 | 57 (28%) | 149 |
0.00388 (1.00) |
4e-05 (0.0175) |
1e-05 (0.00456) |
0.00022 (0.0944) |
0.0587 (1.00) |
0.00315 (1.00) |
0.0162 (1.00) |
0.0001 (0.0433) |
| del 17q25 3 | 35 (17%) | 171 |
0.141 (1.00) |
0.00743 (1.00) |
1e-05 (0.00456) |
0.00089 (0.367) |
9e-05 (0.0391) |
0.00407 (1.00) |
0.00019 (0.0817) |
0.0254 (1.00) |
| del 2q37 1 | 87 (42%) | 119 |
0.00507 (1.00) |
0.00921 (1.00) |
0.00032 (0.137) |
0.00028 (0.12) |
0.0118 (1.00) |
0.00345 (1.00) |
0.00154 (0.627) |
0.00526 (1.00) |
| del 2q37 3 | 84 (41%) | 122 |
0.00169 (0.678) |
0.0143 (1.00) |
0.00036 (0.153) |
0.00038 (0.161) |
0.0149 (1.00) |
0.00304 (1.00) |
0.00249 (0.976) |
0.0037 (1.00) |
| amp 2q32 3 | 36 (17%) | 170 |
4e-05 (0.0175) |
0.00716 (1.00) |
0.00166 (0.667) |
0.0129 (1.00) |
0.116 (1.00) |
0.106 (1.00) |
0.315 (1.00) |
0.262 (1.00) |
| amp 5p15 33 | 88 (43%) | 118 |
1e-05 (0.00456) |
0.0575 (1.00) |
0.0248 (1.00) |
0.104 (1.00) |
0.032 (1.00) |
0.003 (1.00) |
0.00448 (1.00) |
0.312 (1.00) |
| amp 7p11 2 | 34 (17%) | 172 |
2e-05 (0.00888) |
0.0266 (1.00) |
0.00282 (1.00) |
0.0338 (1.00) |
0.0074 (1.00) |
0.0833 (1.00) |
0.00534 (1.00) |
0.413 (1.00) |
| amp 11q13 3 | 24 (12%) | 182 |
0.0119 (1.00) |
0.0306 (1.00) |
0.00451 (1.00) |
3e-05 (0.0132) |
0.114 (1.00) |
0.253 (1.00) |
0.172 (1.00) |
0.00373 (1.00) |
| amp 17q25 1 | 56 (27%) | 150 |
0.00017 (0.0733) |
0.0772 (1.00) |
0.101 (1.00) |
0.101 (1.00) |
0.0323 (1.00) |
0.252 (1.00) |
0.0574 (1.00) |
0.737 (1.00) |
| amp 19q13 2 | 62 (30%) | 144 |
1e-05 (0.00456) |
0.0476 (1.00) |
0.192 (1.00) |
0.17 (1.00) |
0.282 (1.00) |
0.306 (1.00) |
0.449 (1.00) |
0.565 (1.00) |
| del 3p14 2 | 87 (42%) | 119 |
0.00043 (0.181) |
0.00079 (0.327) |
0.028 (1.00) |
0.00125 (0.511) |
0.00826 (1.00) |
0.00185 (0.734) |
0.0248 (1.00) |
0.00226 (0.893) |
| del 4q21 3 | 66 (32%) | 140 |
1e-05 (0.00456) |
0.427 (1.00) |
0.291 (1.00) |
0.00547 (1.00) |
0.419 (1.00) |
0.113 (1.00) |
0.452 (1.00) |
0.145 (1.00) |
| del 4q22 1 | 63 (31%) | 143 |
1e-05 (0.00456) |
0.559 (1.00) |
0.15 (1.00) |
0.00437 (1.00) |
0.385 (1.00) |
0.151 (1.00) |
0.845 (1.00) |
0.0304 (1.00) |
| del 4q35 2 | 76 (37%) | 130 |
1e-05 (0.00456) |
0.365 (1.00) |
0.0475 (1.00) |
0.0018 (0.718) |
0.346 (1.00) |
0.226 (1.00) |
0.788 (1.00) |
0.0223 (1.00) |
| del 11q25 | 115 (56%) | 91 |
2e-05 (0.00888) |
0.0625 (1.00) |
0.0726 (1.00) |
0.0426 (1.00) |
0.234 (1.00) |
0.0301 (1.00) |
0.49 (1.00) |
0.00363 (1.00) |
| del 19p13 3 | 63 (31%) | 143 |
0.00068 (0.284) |
0.00047 (0.197) |
0.00118 (0.485) |
0.00122 (0.5) |
0.0699 (1.00) |
0.0308 (1.00) |
0.267 (1.00) |
0.0018 (0.718) |
| del xp11 3 | 49 (24%) | 157 |
0.00338 (1.00) |
0.00524 (1.00) |
0.0407 (1.00) |
0.0477 (1.00) |
0.00033 (0.141) |
0.0291 (1.00) |
0.00069 (0.287) |
0.018 (1.00) |
| amp 1p31 3 | 67 (33%) | 139 |
0.0909 (1.00) |
0.523 (1.00) |
0.232 (1.00) |
0.0999 (1.00) |
0.607 (1.00) |
0.147 (1.00) |
0.982 (1.00) |
0.046 (1.00) |
| amp 1q21 3 | 108 (52%) | 98 |
0.00134 (0.547) |
0.289 (1.00) |
0.191 (1.00) |
0.358 (1.00) |
0.922 (1.00) |
0.546 (1.00) |
0.851 (1.00) |
0.0825 (1.00) |
| amp 2p24 3 | 54 (26%) | 152 |
0.0303 (1.00) |
0.0321 (1.00) |
0.199 (1.00) |
0.14 (1.00) |
0.28 (1.00) |
0.0136 (1.00) |
0.357 (1.00) |
0.0193 (1.00) |
| amp 4q12 | 14 (7%) | 192 |
0.935 (1.00) |
0.0481 (1.00) |
0.774 (1.00) |
0.323 (1.00) |
0.343 (1.00) |
0.223 (1.00) |
0.303 (1.00) |
0.535 (1.00) |
| amp 6p21 33 | 56 (27%) | 150 |
0.0252 (1.00) |
0.0113 (1.00) |
0.00351 (1.00) |
0.0201 (1.00) |
0.354 (1.00) |
0.128 (1.00) |
0.682 (1.00) |
0.0405 (1.00) |
| amp 8q24 21 | 84 (41%) | 122 |
0.386 (1.00) |
0.388 (1.00) |
0.603 (1.00) |
0.272 (1.00) |
0.0172 (1.00) |
0.832 (1.00) |
0.172 (1.00) |
0.15 (1.00) |
| amp 9p24 1 | 43 (21%) | 163 |
0.0252 (1.00) |
0.623 (1.00) |
0.777 (1.00) |
0.261 (1.00) |
0.932 (1.00) |
0.463 (1.00) |
0.976 (1.00) |
0.826 (1.00) |
| amp 11p13 | 18 (9%) | 188 |
0.118 (1.00) |
0.861 (1.00) |
0.7 (1.00) |
0.251 (1.00) |
0.453 (1.00) |
0.738 (1.00) |
0.475 (1.00) |
0.446 (1.00) |
| amp 13q22 1 | 45 (22%) | 161 |
0.0371 (1.00) |
0.0134 (1.00) |
0.953 (1.00) |
0.994 (1.00) |
0.222 (1.00) |
0.225 (1.00) |
0.23 (1.00) |
0.106 (1.00) |
| amp 15q26 1 | 50 (24%) | 156 |
0.83 (1.00) |
0.417 (1.00) |
0.832 (1.00) |
0.784 (1.00) |
0.415 (1.00) |
1 (1.00) |
0.692 (1.00) |
0.811 (1.00) |
| amp 16p13 13 | 43 (21%) | 163 |
0.297 (1.00) |
0.451 (1.00) |
0.68 (1.00) |
0.289 (1.00) |
0.377 (1.00) |
0.211 (1.00) |
0.257 (1.00) |
0.364 (1.00) |
| amp 17q12 | 38 (18%) | 168 |
0.0424 (1.00) |
0.0162 (1.00) |
0.0118 (1.00) |
0.0459 (1.00) |
0.108 (1.00) |
0.0257 (1.00) |
0.288 (1.00) |
0.291 (1.00) |
| amp 20q11 21 | 92 (45%) | 114 |
0.00387 (1.00) |
0.0548 (1.00) |
0.249 (1.00) |
0.0803 (1.00) |
0.28 (1.00) |
0.011 (1.00) |
0.125 (1.00) |
0.373 (1.00) |
| amp xq28 | 50 (24%) | 156 |
0.934 (1.00) |
0.436 (1.00) |
0.311 (1.00) |
0.685 (1.00) |
0.00825 (1.00) |
0.126 (1.00) |
0.00938 (1.00) |
0.696 (1.00) |
| del 1p36 31 | 26 (13%) | 180 |
0.0279 (1.00) |
0.145 (1.00) |
0.00616 (1.00) |
0.00298 (1.00) |
0.434 (1.00) |
0.00173 (0.692) |
0.0395 (1.00) |
0.0129 (1.00) |
| del 1p13 2 | 22 (11%) | 184 |
0.0663 (1.00) |
0.018 (1.00) |
0.00269 (1.00) |
0.254 (1.00) |
0.141 (1.00) |
0.221 (1.00) |
0.0319 (1.00) |
0.115 (1.00) |
| del 2q22 1 | 41 (20%) | 165 |
0.261 (1.00) |
0.942 (1.00) |
0.766 (1.00) |
0.601 (1.00) |
0.905 (1.00) |
0.478 (1.00) |
0.484 (1.00) |
0.873 (1.00) |
| del 5q22 3 | 52 (25%) | 154 |
0.0044 (1.00) |
0.678 (1.00) |
0.449 (1.00) |
0.375 (1.00) |
0.256 (1.00) |
0.27 (1.00) |
0.164 (1.00) |
0.00349 (1.00) |
| del 5q35 2 | 53 (26%) | 153 |
0.00426 (1.00) |
0.967 (1.00) |
0.567 (1.00) |
0.914 (1.00) |
0.0632 (1.00) |
0.499 (1.00) |
0.0308 (1.00) |
0.0183 (1.00) |
| del 6p24 2 | 30 (15%) | 176 |
0.967 (1.00) |
0.225 (1.00) |
0.0808 (1.00) |
0.685 (1.00) |
0.428 (1.00) |
0.24 (1.00) |
0.772 (1.00) |
0.809 (1.00) |
| del 6q26 | 70 (34%) | 136 |
0.00271 (1.00) |
0.288 (1.00) |
0.344 (1.00) |
0.511 (1.00) |
0.399 (1.00) |
0.619 (1.00) |
0.293 (1.00) |
0.484 (1.00) |
| del 7q34 | 45 (22%) | 161 |
0.00439 (1.00) |
0.379 (1.00) |
0.432 (1.00) |
0.653 (1.00) |
0.348 (1.00) |
0.565 (1.00) |
0.442 (1.00) |
0.176 (1.00) |
| del 8p23 3 | 73 (35%) | 133 |
0.00156 (0.632) |
0.0723 (1.00) |
0.0238 (1.00) |
0.634 (1.00) |
0.602 (1.00) |
0.824 (1.00) |
0.755 (1.00) |
0.593 (1.00) |
| del 10q23 31 | 60 (29%) | 146 |
0.00259 (1.00) |
0.469 (1.00) |
0.682 (1.00) |
0.633 (1.00) |
0.98 (1.00) |
0.806 (1.00) |
1 (1.00) |
0.955 (1.00) |
| del 11p15 1 | 68 (33%) | 138 |
0.103 (1.00) |
0.0534 (1.00) |
0.0912 (1.00) |
0.0316 (1.00) |
0.0721 (1.00) |
0.0711 (1.00) |
0.257 (1.00) |
0.0975 (1.00) |
| del 13q12 11 | 73 (35%) | 133 |
0.0421 (1.00) |
0.0245 (1.00) |
0.00071 (0.295) |
0.0102 (1.00) |
0.0511 (1.00) |
0.00295 (1.00) |
0.0774 (1.00) |
0.0611 (1.00) |
| del 13q14 2 | 81 (39%) | 125 |
0.0276 (1.00) |
0.0106 (1.00) |
0.00229 (0.902) |
0.0128 (1.00) |
0.0385 (1.00) |
0.00429 (1.00) |
0.1 (1.00) |
0.0601 (1.00) |
| del 14q32 31 | 32 (16%) | 174 |
0.00717 (1.00) |
0.417 (1.00) |
0.00494 (1.00) |
0.00155 (0.629) |
0.138 (1.00) |
0.511 (1.00) |
0.028 (1.00) |
0.302 (1.00) |
| del 15q21 1 | 40 (19%) | 166 |
0.0186 (1.00) |
0.0926 (1.00) |
0.0293 (1.00) |
0.146 (1.00) |
0.107 (1.00) |
0.144 (1.00) |
0.236 (1.00) |
0.526 (1.00) |
| del 16q12 1 | 41 (20%) | 165 |
0.382 (1.00) |
0.0498 (1.00) |
0.158 (1.00) |
0.372 (1.00) |
0.168 (1.00) |
0.0191 (1.00) |
0.06 (1.00) |
0.0188 (1.00) |
| del 16q23 1 | 41 (20%) | 165 |
0.401 (1.00) |
0.00768 (1.00) |
0.00634 (1.00) |
0.0423 (1.00) |
0.239 (1.00) |
0.00156 (0.632) |
0.0363 (1.00) |
0.00569 (1.00) |
| del 17p12 | 68 (33%) | 138 |
0.00165 (0.665) |
0.346 (1.00) |
0.203 (1.00) |
0.0455 (1.00) |
0.063 (1.00) |
0.2 (1.00) |
0.121 (1.00) |
0.255 (1.00) |
| del 19q13 33 | 25 (12%) | 181 |
0.164 (1.00) |
0.295 (1.00) |
0.266 (1.00) |
0.512 (1.00) |
0.258 (1.00) |
0.634 (1.00) |
0.442 (1.00) |
0.65 (1.00) |
| del 20p12 1 | 27 (13%) | 179 |
0.965 (1.00) |
0.247 (1.00) |
0.615 (1.00) |
1 (1.00) |
0.316 (1.00) |
0.652 (1.00) |
0.417 (1.00) |
0.0713 (1.00) |
| del 21q11 2 | 40 (19%) | 166 |
0.00545 (1.00) |
0.171 (1.00) |
0.297 (1.00) |
0.00924 (1.00) |
0.882 (1.00) |
0.711 (1.00) |
0.635 (1.00) |
0.157 (1.00) |
| del 22q13 32 | 57 (28%) | 149 |
0.122 (1.00) |
0.268 (1.00) |
0.401 (1.00) |
0.29 (1.00) |
0.852 (1.00) |
0.677 (1.00) |
0.887 (1.00) |
0.618 (1.00) |
| del xq21 33 | 43 (21%) | 163 |
0.231 (1.00) |
0.014 (1.00) |
0.161 (1.00) |
0.0529 (1.00) |
0.0931 (1.00) |
0.101 (1.00) |
0.241 (1.00) |
0.00847 (1.00) |
P value = 4e-05 (Fisher's exact test), Q value = 0.017
Table S1. Gene #4: 'amp_2q32.3' versus Molecular Subtype #1: 'CN_CNMF'
| nPatients | CLUS_1 | CLUS_2 | CLUS_3 |
|---|---|---|---|
| ALL | 66 | 44 | 96 |
| AMP PEAK 4(2Q32.3) MUTATED | 13 | 17 | 6 |
| AMP PEAK 4(2Q32.3) WILD-TYPE | 53 | 27 | 90 |
Figure S1. Get High-res Image Gene #4: 'amp_2q32.3' versus Molecular Subtype #1: 'CN_CNMF'
P value = 1e-05 (Fisher's exact test), Q value = 0.0046
Table S2. Gene #5: 'amp_3q26.31' versus Molecular Subtype #1: 'CN_CNMF'
| nPatients | CLUS_1 | CLUS_2 | CLUS_3 |
|---|---|---|---|
| ALL | 66 | 44 | 96 |
| AMP PEAK 5(3Q26.31) MUTATED | 66 | 35 | 59 |
| AMP PEAK 5(3Q26.31) WILD-TYPE | 0 | 9 | 37 |
Figure S2. Get High-res Image Gene #5: 'amp_3q26.31' versus Molecular Subtype #1: 'CN_CNMF'
P value = 0.00011 (Fisher's exact test), Q value = 0.048
Table S3. Gene #5: 'amp_3q26.31' versus Molecular Subtype #2: 'METHLYATION_CNMF'
| nPatients | CLUS_1 | CLUS_2 | CLUS_3 | CLUS_4 | CLUS_5 | CLUS_6 |
|---|---|---|---|---|---|---|
| ALL | 51 | 34 | 39 | 38 | 32 | 12 |
| AMP PEAK 5(3Q26.31) MUTATED | 32 | 27 | 34 | 24 | 31 | 12 |
| AMP PEAK 5(3Q26.31) WILD-TYPE | 19 | 7 | 5 | 14 | 1 | 0 |
Figure S3. Get High-res Image Gene #5: 'amp_3q26.31' versus Molecular Subtype #2: 'METHLYATION_CNMF'
P value = 0.00035 (Fisher's exact test), Q value = 0.15
Table S4. Gene #5: 'amp_3q26.31' versus Molecular Subtype #4: 'MRNASEQ_CHIERARCHICAL'
| nPatients | CLUS_1 | CLUS_2 | CLUS_3 | CLUS_4 |
|---|---|---|---|---|
| ALL | 100 | 27 | 21 | 53 |
| AMP PEAK 5(3Q26.31) MUTATED | 86 | 25 | 12 | 34 |
| AMP PEAK 5(3Q26.31) WILD-TYPE | 14 | 2 | 9 | 19 |
Figure S4. Get High-res Image Gene #5: 'amp_3q26.31' versus Molecular Subtype #4: 'MRNASEQ_CHIERARCHICAL'

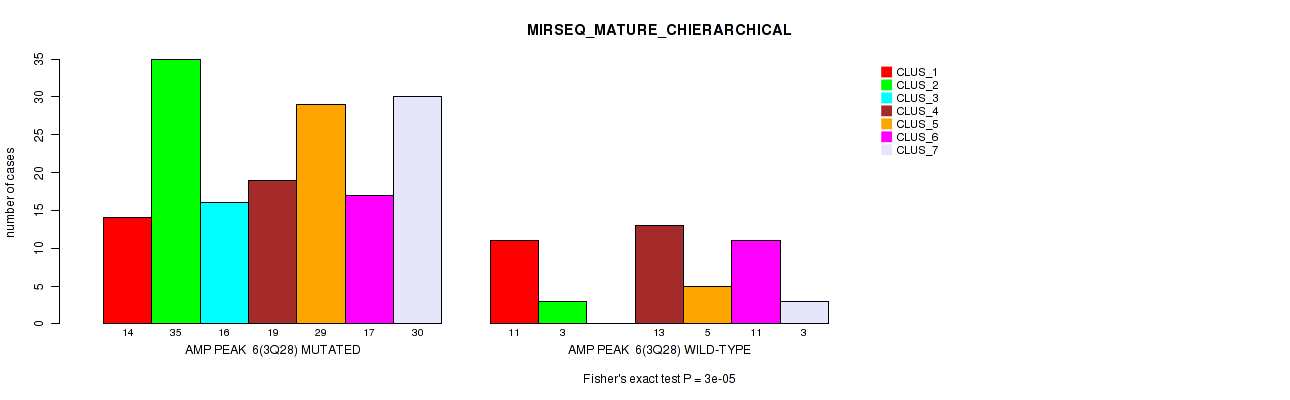
P value = 3e-05 (Fisher's exact test), Q value = 0.013
Table S5. Gene #5: 'amp_3q26.31' versus Molecular Subtype #8: 'MIRSEQ_MATURE_CHIERARCHICAL'
| nPatients | CLUS_1 | CLUS_2 | CLUS_3 | CLUS_4 | CLUS_5 | CLUS_6 | CLUS_7 |
|---|---|---|---|---|---|---|---|
| ALL | 25 | 38 | 16 | 32 | 34 | 28 | 33 |
| AMP PEAK 5(3Q26.31) MUTATED | 14 | 35 | 16 | 18 | 29 | 18 | 30 |
| AMP PEAK 5(3Q26.31) WILD-TYPE | 11 | 3 | 0 | 14 | 5 | 10 | 3 |
Figure S5. Get High-res Image Gene #5: 'amp_3q26.31' versus Molecular Subtype #8: 'MIRSEQ_MATURE_CHIERARCHICAL'
P value = 1e-05 (Fisher's exact test), Q value = 0.0046
Table S6. Gene #6: 'amp_3q28' versus Molecular Subtype #1: 'CN_CNMF'
| nPatients | CLUS_1 | CLUS_2 | CLUS_3 |
|---|---|---|---|
| ALL | 66 | 44 | 96 |
| AMP PEAK 6(3Q28) MUTATED | 66 | 35 | 59 |
| AMP PEAK 6(3Q28) WILD-TYPE | 0 | 9 | 37 |
Figure S6. Get High-res Image Gene #6: 'amp_3q28' versus Molecular Subtype #1: 'CN_CNMF'
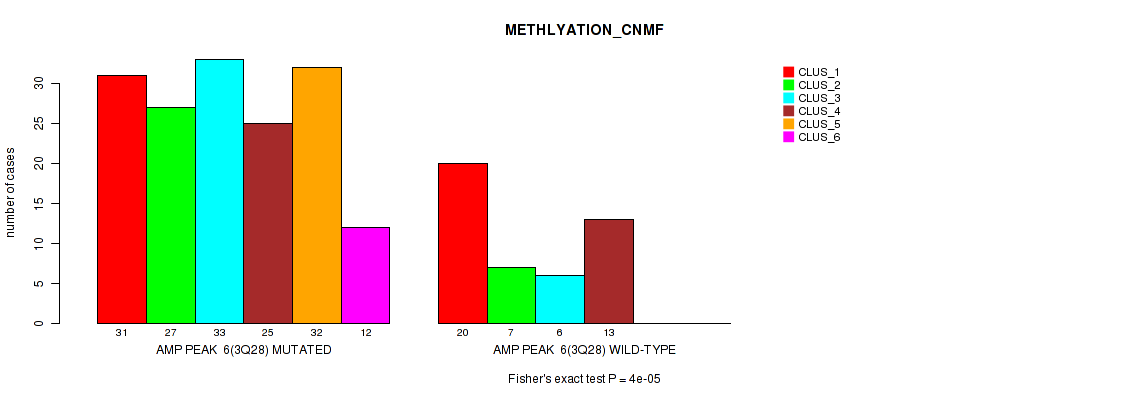
P value = 4e-05 (Fisher's exact test), Q value = 0.017
Table S7. Gene #6: 'amp_3q28' versus Molecular Subtype #2: 'METHLYATION_CNMF'
| nPatients | CLUS_1 | CLUS_2 | CLUS_3 | CLUS_4 | CLUS_5 | CLUS_6 |
|---|---|---|---|---|---|---|
| ALL | 51 | 34 | 39 | 38 | 32 | 12 |
| AMP PEAK 6(3Q28) MUTATED | 31 | 27 | 33 | 25 | 32 | 12 |
| AMP PEAK 6(3Q28) WILD-TYPE | 20 | 7 | 6 | 13 | 0 | 0 |
Figure S7. Get High-res Image Gene #6: 'amp_3q28' versus Molecular Subtype #2: 'METHLYATION_CNMF'
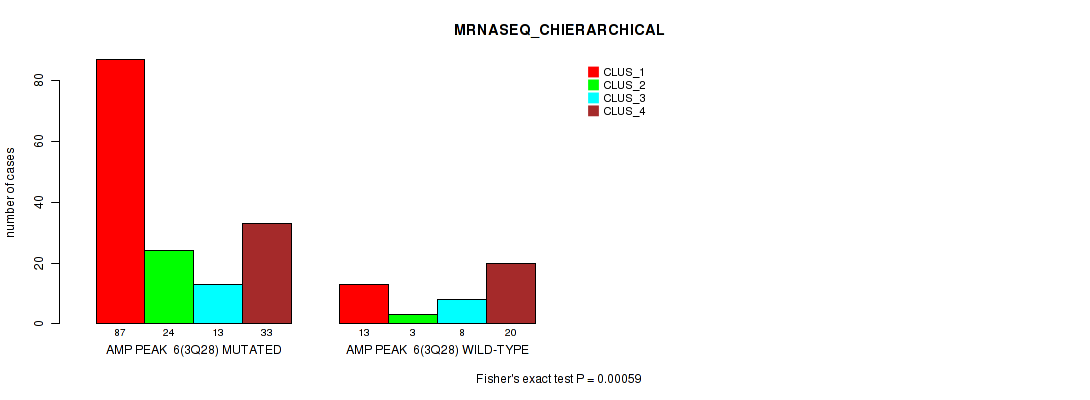
P value = 0.00059 (Fisher's exact test), Q value = 0.25
Table S8. Gene #6: 'amp_3q28' versus Molecular Subtype #4: 'MRNASEQ_CHIERARCHICAL'
| nPatients | CLUS_1 | CLUS_2 | CLUS_3 | CLUS_4 |
|---|---|---|---|---|
| ALL | 100 | 27 | 21 | 53 |
| AMP PEAK 6(3Q28) MUTATED | 87 | 24 | 13 | 33 |
| AMP PEAK 6(3Q28) WILD-TYPE | 13 | 3 | 8 | 20 |
Figure S8. Get High-res Image Gene #6: 'amp_3q28' versus Molecular Subtype #4: 'MRNASEQ_CHIERARCHICAL'
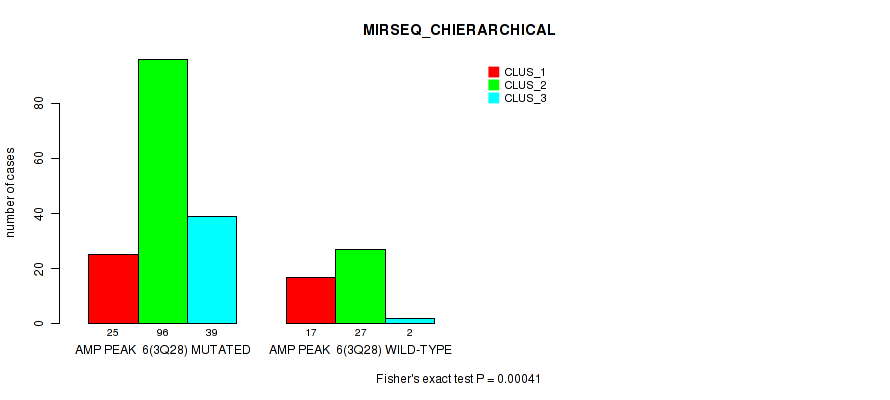
P value = 0.00041 (Fisher's exact test), Q value = 0.17
Table S9. Gene #6: 'amp_3q28' versus Molecular Subtype #6: 'MIRSEQ_CHIERARCHICAL'
| nPatients | CLUS_1 | CLUS_2 | CLUS_3 |
|---|---|---|---|
| ALL | 42 | 123 | 41 |
| AMP PEAK 6(3Q28) MUTATED | 25 | 96 | 39 |
| AMP PEAK 6(3Q28) WILD-TYPE | 17 | 27 | 2 |
Figure S9. Get High-res Image Gene #6: 'amp_3q28' versus Molecular Subtype #6: 'MIRSEQ_CHIERARCHICAL'
P value = 3e-05 (Fisher's exact test), Q value = 0.013
Table S10. Gene #6: 'amp_3q28' versus Molecular Subtype #8: 'MIRSEQ_MATURE_CHIERARCHICAL'
| nPatients | CLUS_1 | CLUS_2 | CLUS_3 | CLUS_4 | CLUS_5 | CLUS_6 | CLUS_7 |
|---|---|---|---|---|---|---|---|
| ALL | 25 | 38 | 16 | 32 | 34 | 28 | 33 |
| AMP PEAK 6(3Q28) MUTATED | 14 | 35 | 16 | 19 | 29 | 17 | 30 |
| AMP PEAK 6(3Q28) WILD-TYPE | 11 | 3 | 0 | 13 | 5 | 11 | 3 |
Figure S10. Get High-res Image Gene #6: 'amp_3q28' versus Molecular Subtype #8: 'MIRSEQ_MATURE_CHIERARCHICAL'
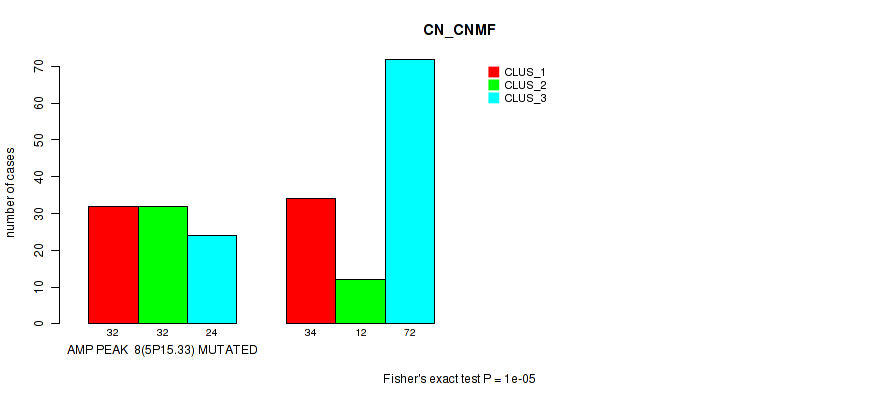
P value = 1e-05 (Fisher's exact test), Q value = 0.0046
Table S11. Gene #8: 'amp_5p15.33' versus Molecular Subtype #1: 'CN_CNMF'
| nPatients | CLUS_1 | CLUS_2 | CLUS_3 |
|---|---|---|---|
| ALL | 66 | 44 | 96 |
| AMP PEAK 8(5P15.33) MUTATED | 32 | 32 | 24 |
| AMP PEAK 8(5P15.33) WILD-TYPE | 34 | 12 | 72 |
Figure S11. Get High-res Image Gene #8: 'amp_5p15.33' versus Molecular Subtype #1: 'CN_CNMF'
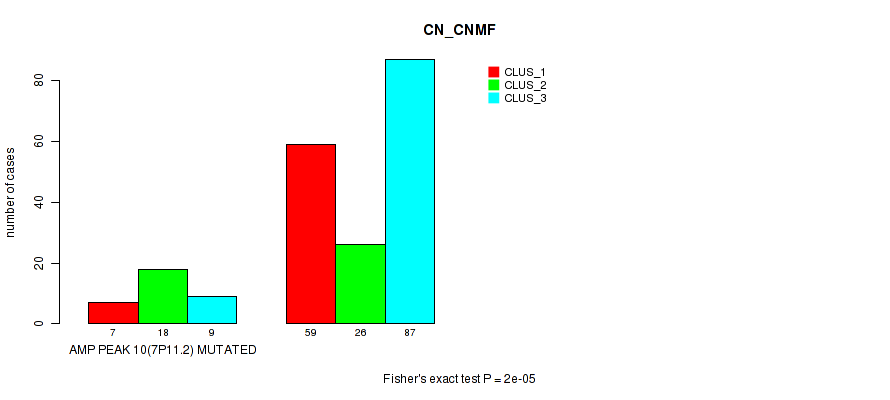
P value = 2e-05 (Fisher's exact test), Q value = 0.0089
Table S12. Gene #10: 'amp_7p11.2' versus Molecular Subtype #1: 'CN_CNMF'
| nPatients | CLUS_1 | CLUS_2 | CLUS_3 |
|---|---|---|---|
| ALL | 66 | 44 | 96 |
| AMP PEAK 10(7P11.2) MUTATED | 7 | 18 | 9 |
| AMP PEAK 10(7P11.2) WILD-TYPE | 59 | 26 | 87 |
Figure S12. Get High-res Image Gene #10: 'amp_7p11.2' versus Molecular Subtype #1: 'CN_CNMF'
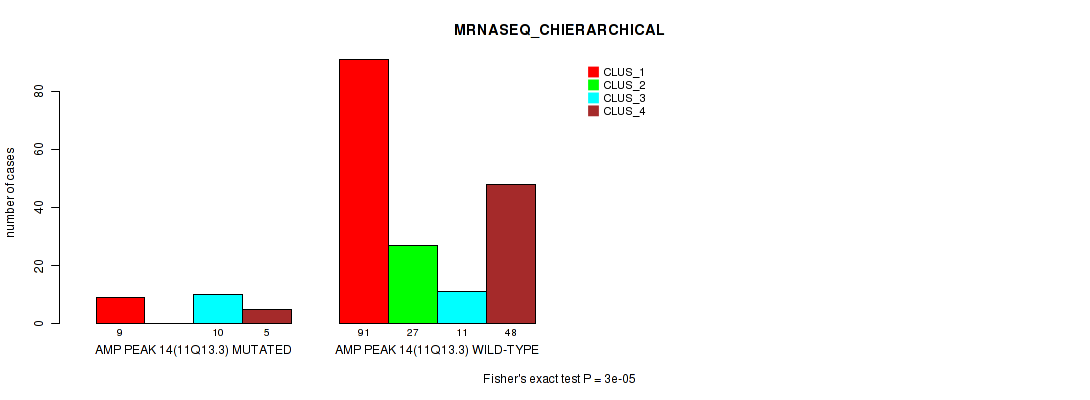
P value = 3e-05 (Fisher's exact test), Q value = 0.013
Table S13. Gene #14: 'amp_11q13.3' versus Molecular Subtype #4: 'MRNASEQ_CHIERARCHICAL'
| nPatients | CLUS_1 | CLUS_2 | CLUS_3 | CLUS_4 |
|---|---|---|---|---|
| ALL | 100 | 27 | 21 | 53 |
| AMP PEAK 14(11Q13.3) MUTATED | 9 | 0 | 10 | 5 |
| AMP PEAK 14(11Q13.3) WILD-TYPE | 91 | 27 | 11 | 48 |
Figure S13. Get High-res Image Gene #14: 'amp_11q13.3' versus Molecular Subtype #4: 'MRNASEQ_CHIERARCHICAL'
P value = 2e-05 (Fisher's exact test), Q value = 0.0089
Table S14. Gene #15: 'amp_11q22.1' versus Molecular Subtype #1: 'CN_CNMF'
| nPatients | CLUS_1 | CLUS_2 | CLUS_3 |
|---|---|---|---|
| ALL | 66 | 44 | 96 |
| AMP PEAK 15(11Q22.1) MUTATED | 5 | 19 | 11 |
| AMP PEAK 15(11Q22.1) WILD-TYPE | 61 | 25 | 85 |
Figure S14. Get High-res Image Gene #15: 'amp_11q22.1' versus Molecular Subtype #1: 'CN_CNMF'

P value = 1e-05 (Fisher's exact test), Q value = 0.0046
Table S15. Gene #15: 'amp_11q22.1' versus Molecular Subtype #2: 'METHLYATION_CNMF'
| nPatients | CLUS_1 | CLUS_2 | CLUS_3 | CLUS_4 | CLUS_5 | CLUS_6 |
|---|---|---|---|---|---|---|
| ALL | 51 | 34 | 39 | 38 | 32 | 12 |
| AMP PEAK 15(11Q22.1) MUTATED | 3 | 1 | 8 | 18 | 3 | 2 |
| AMP PEAK 15(11Q22.1) WILD-TYPE | 48 | 33 | 31 | 20 | 29 | 10 |
Figure S15. Get High-res Image Gene #15: 'amp_11q22.1' versus Molecular Subtype #2: 'METHLYATION_CNMF'
P value = 3e-05 (Fisher's exact test), Q value = 0.013
Table S16. Gene #15: 'amp_11q22.1' versus Molecular Subtype #3: 'MRNASEQ_CNMF'
| nPatients | CLUS_1 | CLUS_2 | CLUS_3 |
|---|---|---|---|
| ALL | 86 | 50 | 65 |
| AMP PEAK 15(11Q22.1) MUTATED | 10 | 20 | 5 |
| AMP PEAK 15(11Q22.1) WILD-TYPE | 76 | 30 | 60 |
Figure S16. Get High-res Image Gene #15: 'amp_11q22.1' versus Molecular Subtype #3: 'MRNASEQ_CNMF'
P value = 1e-05 (Fisher's exact test), Q value = 0.0046
Table S17. Gene #15: 'amp_11q22.1' versus Molecular Subtype #4: 'MRNASEQ_CHIERARCHICAL'
| nPatients | CLUS_1 | CLUS_2 | CLUS_3 | CLUS_4 |
|---|---|---|---|---|
| ALL | 100 | 27 | 21 | 53 |
| AMP PEAK 15(11Q22.1) MUTATED | 12 | 5 | 15 | 3 |
| AMP PEAK 15(11Q22.1) WILD-TYPE | 88 | 22 | 6 | 50 |
Figure S17. Get High-res Image Gene #15: 'amp_11q22.1' versus Molecular Subtype #4: 'MRNASEQ_CHIERARCHICAL'
P value = 1e-05 (Fisher's exact test), Q value = 0.0046
Table S18. Gene #15: 'amp_11q22.1' versus Molecular Subtype #8: 'MIRSEQ_MATURE_CHIERARCHICAL'
| nPatients | CLUS_1 | CLUS_2 | CLUS_3 | CLUS_4 | CLUS_5 | CLUS_6 | CLUS_7 |
|---|---|---|---|---|---|---|---|
| ALL | 25 | 38 | 16 | 32 | 34 | 28 | 33 |
| AMP PEAK 15(11Q22.1) MUTATED | 2 | 6 | 6 | 16 | 2 | 1 | 2 |
| AMP PEAK 15(11Q22.1) WILD-TYPE | 23 | 32 | 10 | 16 | 32 | 27 | 31 |
Figure S18. Get High-res Image Gene #15: 'amp_11q22.1' versus Molecular Subtype #8: 'MIRSEQ_MATURE_CHIERARCHICAL'
P value = 0.00017 (Fisher's exact test), Q value = 0.073
Table S19. Gene #20: 'amp_17q25.1' versus Molecular Subtype #1: 'CN_CNMF'
| nPatients | CLUS_1 | CLUS_2 | CLUS_3 |
|---|---|---|---|
| ALL | 66 | 44 | 96 |
| AMP PEAK 20(17Q25.1) MUTATED | 29 | 13 | 14 |
| AMP PEAK 20(17Q25.1) WILD-TYPE | 37 | 31 | 82 |
Figure S19. Get High-res Image Gene #20: 'amp_17q25.1' versus Molecular Subtype #1: 'CN_CNMF'
P value = 1e-05 (Fisher's exact test), Q value = 0.0046
Table S20. Gene #21: 'amp_19q13.2' versus Molecular Subtype #1: 'CN_CNMF'
| nPatients | CLUS_1 | CLUS_2 | CLUS_3 |
|---|---|---|---|
| ALL | 66 | 44 | 96 |
| AMP PEAK 21(19Q13.2) MUTATED | 16 | 28 | 18 |
| AMP PEAK 21(19Q13.2) WILD-TYPE | 50 | 16 | 78 |
Figure S20. Get High-res Image Gene #21: 'amp_19q13.2' versus Molecular Subtype #1: 'CN_CNMF'
P value = 0.00032 (Fisher's exact test), Q value = 0.14
Table S21. Gene #27: 'del_2q37.1' versus Molecular Subtype #3: 'MRNASEQ_CNMF'
| nPatients | CLUS_1 | CLUS_2 | CLUS_3 |
|---|---|---|---|
| ALL | 86 | 50 | 65 |
| DEL PEAK 4(2Q37.1) MUTATED | 41 | 29 | 15 |
| DEL PEAK 4(2Q37.1) WILD-TYPE | 45 | 21 | 50 |
Figure S21. Get High-res Image Gene #27: 'del_2q37.1' versus Molecular Subtype #3: 'MRNASEQ_CNMF'
P value = 0.00028 (Fisher's exact test), Q value = 0.12
Table S22. Gene #27: 'del_2q37.1' versus Molecular Subtype #4: 'MRNASEQ_CHIERARCHICAL'
| nPatients | CLUS_1 | CLUS_2 | CLUS_3 | CLUS_4 |
|---|---|---|---|---|
| ALL | 100 | 27 | 21 | 53 |
| DEL PEAK 4(2Q37.1) MUTATED | 48 | 11 | 15 | 11 |
| DEL PEAK 4(2Q37.1) WILD-TYPE | 52 | 16 | 6 | 42 |
Figure S22. Get High-res Image Gene #27: 'del_2q37.1' versus Molecular Subtype #4: 'MRNASEQ_CHIERARCHICAL'
P value = 0.00036 (Fisher's exact test), Q value = 0.15
Table S23. Gene #28: 'del_2q37.3' versus Molecular Subtype #3: 'MRNASEQ_CNMF'
| nPatients | CLUS_1 | CLUS_2 | CLUS_3 |
|---|---|---|---|
| ALL | 86 | 50 | 65 |
| DEL PEAK 5(2Q37.3) MUTATED | 38 | 29 | 15 |
| DEL PEAK 5(2Q37.3) WILD-TYPE | 48 | 21 | 50 |
Figure S23. Get High-res Image Gene #28: 'del_2q37.3' versus Molecular Subtype #3: 'MRNASEQ_CNMF'
P value = 0.00038 (Fisher's exact test), Q value = 0.16
Table S24. Gene #28: 'del_2q37.3' versus Molecular Subtype #4: 'MRNASEQ_CHIERARCHICAL'
| nPatients | CLUS_1 | CLUS_2 | CLUS_3 | CLUS_4 |
|---|---|---|---|---|
| ALL | 100 | 27 | 21 | 53 |
| DEL PEAK 5(2Q37.3) MUTATED | 45 | 11 | 15 | 11 |
| DEL PEAK 5(2Q37.3) WILD-TYPE | 55 | 16 | 6 | 42 |
Figure S24. Get High-res Image Gene #28: 'del_2q37.3' versus Molecular Subtype #4: 'MRNASEQ_CHIERARCHICAL'
P value = 0.00043 (Fisher's exact test), Q value = 0.18
Table S25. Gene #29: 'del_3p14.2' versus Molecular Subtype #1: 'CN_CNMF'
| nPatients | CLUS_1 | CLUS_2 | CLUS_3 |
|---|---|---|---|
| ALL | 66 | 44 | 96 |
| DEL PEAK 6(3P14.2) MUTATED | 31 | 28 | 28 |
| DEL PEAK 6(3P14.2) WILD-TYPE | 35 | 16 | 68 |
Figure S25. Get High-res Image Gene #29: 'del_3p14.2' versus Molecular Subtype #1: 'CN_CNMF'
P value = 1e-05 (Fisher's exact test), Q value = 0.0046
Table S26. Gene #30: 'del_4q21.3' versus Molecular Subtype #1: 'CN_CNMF'
| nPatients | CLUS_1 | CLUS_2 | CLUS_3 |
|---|---|---|---|
| ALL | 66 | 44 | 96 |
| DEL PEAK 7(4Q21.3) MUTATED | 23 | 31 | 12 |
| DEL PEAK 7(4Q21.3) WILD-TYPE | 43 | 13 | 84 |
Figure S26. Get High-res Image Gene #30: 'del_4q21.3' versus Molecular Subtype #1: 'CN_CNMF'
P value = 1e-05 (Fisher's exact test), Q value = 0.0046
Table S27. Gene #31: 'del_4q22.1' versus Molecular Subtype #1: 'CN_CNMF'
| nPatients | CLUS_1 | CLUS_2 | CLUS_3 |
|---|---|---|---|
| ALL | 66 | 44 | 96 |
| DEL PEAK 8(4Q22.1) MUTATED | 21 | 33 | 9 |
| DEL PEAK 8(4Q22.1) WILD-TYPE | 45 | 11 | 87 |
Figure S27. Get High-res Image Gene #31: 'del_4q22.1' versus Molecular Subtype #1: 'CN_CNMF'
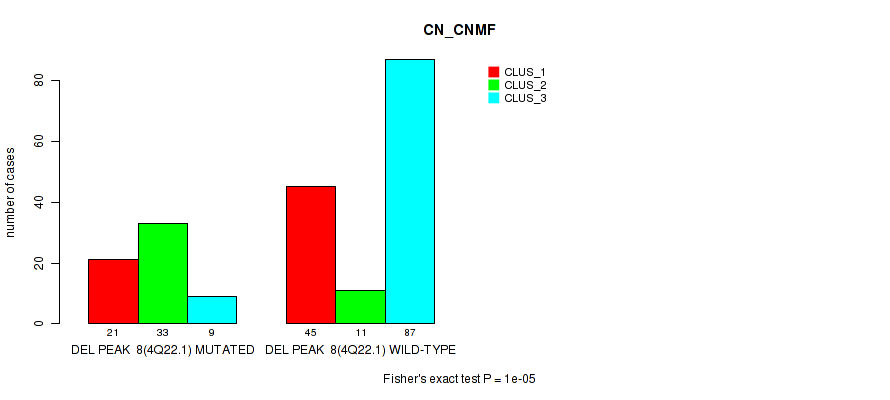
P value = 1e-05 (Fisher's exact test), Q value = 0.0046
Table S28. Gene #32: 'del_4q35.2' versus Molecular Subtype #1: 'CN_CNMF'
| nPatients | CLUS_1 | CLUS_2 | CLUS_3 |
|---|---|---|---|
| ALL | 66 | 44 | 96 |
| DEL PEAK 9(4Q35.2) MUTATED | 24 | 35 | 17 |
| DEL PEAK 9(4Q35.2) WILD-TYPE | 42 | 9 | 79 |
Figure S28. Get High-res Image Gene #32: 'del_4q35.2' versus Molecular Subtype #1: 'CN_CNMF'
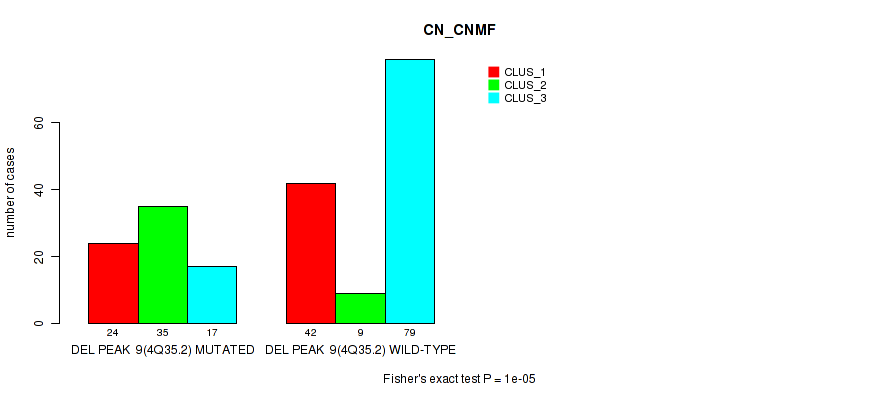
P value = 2e-05 (Fisher's exact test), Q value = 0.0089
Table S29. Gene #41: 'del_11q25' versus Molecular Subtype #1: 'CN_CNMF'
| nPatients | CLUS_1 | CLUS_2 | CLUS_3 |
|---|---|---|---|
| ALL | 66 | 44 | 96 |
| DEL PEAK 18(11Q25) MUTATED | 48 | 30 | 37 |
| DEL PEAK 18(11Q25) WILD-TYPE | 18 | 14 | 59 |
Figure S29. Get High-res Image Gene #41: 'del_11q25' versus Molecular Subtype #1: 'CN_CNMF'
P value = 1e-05 (Fisher's exact test), Q value = 0.0046
Table S30. Gene #49: 'del_17q25.3' versus Molecular Subtype #3: 'MRNASEQ_CNMF'
| nPatients | CLUS_1 | CLUS_2 | CLUS_3 |
|---|---|---|---|
| ALL | 86 | 50 | 65 |
| DEL PEAK 26(17Q25.3) MUTATED | 14 | 18 | 2 |
| DEL PEAK 26(17Q25.3) WILD-TYPE | 72 | 32 | 63 |
Figure S30. Get High-res Image Gene #49: 'del_17q25.3' versus Molecular Subtype #3: 'MRNASEQ_CNMF'
P value = 9e-05 (Fisher's exact test), Q value = 0.039
Table S31. Gene #49: 'del_17q25.3' versus Molecular Subtype #5: 'MIRSEQ_CNMF'
| nPatients | CLUS_1 | CLUS_2 | CLUS_3 |
|---|---|---|---|
| ALL | 72 | 57 | 77 |
| DEL PEAK 26(17Q25.3) MUTATED | 4 | 7 | 24 |
| DEL PEAK 26(17Q25.3) WILD-TYPE | 68 | 50 | 53 |
Figure S31. Get High-res Image Gene #49: 'del_17q25.3' versus Molecular Subtype #5: 'MIRSEQ_CNMF'
P value = 0.00019 (Fisher's exact test), Q value = 0.082
Table S32. Gene #49: 'del_17q25.3' versus Molecular Subtype #7: 'MIRSEQ_MATURE_CNMF'
| nPatients | CLUS_1 | CLUS_2 | CLUS_3 |
|---|---|---|---|
| ALL | 74 | 62 | 70 |
| DEL PEAK 26(17Q25.3) MUTATED | 4 | 9 | 22 |
| DEL PEAK 26(17Q25.3) WILD-TYPE | 70 | 53 | 48 |
Figure S32. Get High-res Image Gene #49: 'del_17q25.3' versus Molecular Subtype #7: 'MIRSEQ_MATURE_CNMF'
P value = 4e-05 (Fisher's exact test), Q value = 0.017
Table S33. Gene #50: 'del_18q21.2' versus Molecular Subtype #2: 'METHLYATION_CNMF'
| nPatients | CLUS_1 | CLUS_2 | CLUS_3 | CLUS_4 | CLUS_5 | CLUS_6 |
|---|---|---|---|---|---|---|
| ALL | 51 | 34 | 39 | 38 | 32 | 12 |
| DEL PEAK 27(18Q21.2) MUTATED | 22 | 6 | 7 | 18 | 2 | 2 |
| DEL PEAK 27(18Q21.2) WILD-TYPE | 29 | 28 | 32 | 20 | 30 | 10 |
Figure S33. Get High-res Image Gene #50: 'del_18q21.2' versus Molecular Subtype #2: 'METHLYATION_CNMF'
P value = 1e-05 (Fisher's exact test), Q value = 0.0046
Table S34. Gene #50: 'del_18q21.2' versus Molecular Subtype #3: 'MRNASEQ_CNMF'
| nPatients | CLUS_1 | CLUS_2 | CLUS_3 |
|---|---|---|---|
| ALL | 86 | 50 | 65 |
| DEL PEAK 27(18Q21.2) MUTATED | 7 | 24 | 25 |
| DEL PEAK 27(18Q21.2) WILD-TYPE | 79 | 26 | 40 |
Figure S34. Get High-res Image Gene #50: 'del_18q21.2' versus Molecular Subtype #3: 'MRNASEQ_CNMF'
P value = 0.00022 (Fisher's exact test), Q value = 0.094
Table S35. Gene #50: 'del_18q21.2' versus Molecular Subtype #4: 'MRNASEQ_CHIERARCHICAL'
| nPatients | CLUS_1 | CLUS_2 | CLUS_3 | CLUS_4 |
|---|---|---|---|---|
| ALL | 100 | 27 | 21 | 53 |
| DEL PEAK 27(18Q21.2) MUTATED | 18 | 4 | 11 | 23 |
| DEL PEAK 27(18Q21.2) WILD-TYPE | 82 | 23 | 10 | 30 |
Figure S35. Get High-res Image Gene #50: 'del_18q21.2' versus Molecular Subtype #4: 'MRNASEQ_CHIERARCHICAL'
P value = 1e-04 (Fisher's exact test), Q value = 0.043
Table S36. Gene #50: 'del_18q21.2' versus Molecular Subtype #8: 'MIRSEQ_MATURE_CHIERARCHICAL'
| nPatients | CLUS_1 | CLUS_2 | CLUS_3 | CLUS_4 | CLUS_5 | CLUS_6 | CLUS_7 |
|---|---|---|---|---|---|---|---|
| ALL | 25 | 38 | 16 | 32 | 34 | 28 | 33 |
| DEL PEAK 27(18Q21.2) MUTATED | 15 | 10 | 2 | 15 | 4 | 7 | 4 |
| DEL PEAK 27(18Q21.2) WILD-TYPE | 10 | 28 | 14 | 17 | 30 | 21 | 29 |
Figure S36. Get High-res Image Gene #50: 'del_18q21.2' versus Molecular Subtype #8: 'MIRSEQ_MATURE_CHIERARCHICAL'
P value = 0.00047 (Fisher's exact test), Q value = 0.2
Table S37. Gene #51: 'del_19p13.3' versus Molecular Subtype #2: 'METHLYATION_CNMF'
| nPatients | CLUS_1 | CLUS_2 | CLUS_3 | CLUS_4 | CLUS_5 | CLUS_6 |
|---|---|---|---|---|---|---|
| ALL | 51 | 34 | 39 | 38 | 32 | 12 |
| DEL PEAK 28(19P13.3) MUTATED | 16 | 9 | 4 | 22 | 8 | 4 |
| DEL PEAK 28(19P13.3) WILD-TYPE | 35 | 25 | 35 | 16 | 24 | 8 |
Figure S37. Get High-res Image Gene #51: 'del_19p13.3' versus Molecular Subtype #2: 'METHLYATION_CNMF'
P value = 0.00033 (Fisher's exact test), Q value = 0.14
Table S38. Gene #56: 'del_xp11.3' versus Molecular Subtype #5: 'MIRSEQ_CNMF'
| nPatients | CLUS_1 | CLUS_2 | CLUS_3 |
|---|---|---|---|
| ALL | 72 | 57 | 77 |
| DEL PEAK 33(XP11.3) MUTATED | 12 | 7 | 30 |
| DEL PEAK 33(XP11.3) WILD-TYPE | 60 | 50 | 47 |
Figure S38. Get High-res Image Gene #56: 'del_xp11.3' versus Molecular Subtype #5: 'MIRSEQ_CNMF'
-
Copy number data file = transformed.cor.cli.txt
-
Molecular subtype file = CESC-TP.transferedmergedcluster.txt
-
Number of patients = 206
-
Number of significantly focal cnvs = 57
-
Number of molecular subtypes = 8
-
Exclude genes that fewer than K tumors have alterations, K = 3
For binary or multi-class clinical features (nominal or ordinal), two-tailed Fisher's exact tests (Fisher 1922) were used to estimate the P values using the 'fisher.test' function in R
For multiple hypothesis correction, Q value is the False Discovery Rate (FDR) analogue of the P value (Benjamini and Hochberg 1995), defined as the minimum FDR at which the test may be called significant. We used the 'Benjamini and Hochberg' method of 'p.adjust' function in R to convert P values into Q values.
In addition to the links below, the full results of the analysis summarized in this report can also be downloaded programmatically using firehose_get, or interactively from either the Broad GDAC website or TCGA Data Coordination Center Portal.