This pipeline computes the correlation between significant copy number variation (cnv focal) genes and selected clinical features.
Testing the association between copy number variation 24 focal events and 4 clinical features across 25 patients, one significant finding detected with Q value < 0.25.
-
del_17q24.1 cnv correlated to 'Time to Death'.
Table 1. Get Full Table Overview of the association between significant copy number variation of 24 focal events and 4 clinical features. Shown in the table are P values (Q values). Thresholded by Q value < 0.25, one significant finding detected.
|
Clinical Features |
Time to Death |
AGE | GENDER | RACE | ||
| nCNV (%) | nWild-Type | logrank test | Wilcoxon-test | Fisher's exact test | Fisher's exact test | |
| del 17q24 1 | 3 (12%) | 22 |
3.74e-05 (0.00359) |
1 (1.00) |
1 (1.00) |
1 (1.00) |
| amp 1q31 1 | 9 (36%) | 16 |
0.222 (1.00) |
0.281 (1.00) |
0.434 (1.00) |
0.793 (1.00) |
| amp 2p15 | 7 (28%) | 18 |
0.0511 (1.00) |
0.785 (1.00) |
1 (1.00) |
0.562 (1.00) |
| amp 3q27 3 | 6 (24%) | 19 |
0.389 (1.00) |
0.655 (1.00) |
0.661 (1.00) |
0.387 (1.00) |
| amp 8q24 12 | 6 (24%) | 19 |
0.477 (1.00) |
0.191 (1.00) |
0.661 (1.00) |
0.0682 (1.00) |
| amp 12q13 12 | 4 (16%) | 21 |
0.655 (1.00) |
0.207 (1.00) |
0.604 (1.00) |
0.389 (1.00) |
| amp 16p11 2 | 5 (20%) | 20 |
0.469 (1.00) |
0.324 (1.00) |
1 (1.00) |
1 (1.00) |
| amp xq27 3 | 5 (20%) | 20 |
0.655 (1.00) |
0.946 (1.00) |
1 (1.00) |
0.00858 (0.815) |
| del 1p22 1 | 3 (12%) | 22 |
0.522 (1.00) |
0.933 (1.00) |
0.565 (1.00) |
1 (1.00) |
| del 1p13 1 | 6 (24%) | 19 |
0.799 (1.00) |
0.483 (1.00) |
0.35 (1.00) |
0.745 (1.00) |
| del 1q43 | 6 (24%) | 19 |
0.569 (1.00) |
0.355 (1.00) |
0.18 (1.00) |
0.0663 (1.00) |
| del 2q23 1 | 5 (20%) | 20 |
0.609 (1.00) |
0.563 (1.00) |
0.0464 (1.00) |
0.0591 (1.00) |
| del 6q14 1 | 7 (28%) | 18 |
0.27 (1.00) |
0.976 (1.00) |
1 (1.00) |
1 (1.00) |
| del 6q23 3 | 5 (20%) | 20 |
0.79 (1.00) |
0.376 (1.00) |
0.623 (1.00) |
0.0981 (1.00) |
| del 8p23 1 | 3 (12%) | 22 |
0.808 (1.00) |
0.315 (1.00) |
0.23 (1.00) |
0.111 (1.00) |
| del 8q12 1 | 3 (12%) | 22 |
0.668 (1.00) |
0.111 (1.00) |
1 (1.00) |
0.605 (1.00) |
| del 9p21 3 | 7 (28%) | 18 |
0.27 (1.00) |
0.544 (1.00) |
1 (1.00) |
0.565 (1.00) |
| del 10q23 31 | 4 (16%) | 21 |
0.201 (1.00) |
0.22 (1.00) |
0.604 (1.00) |
0.677 (1.00) |
| del 13q14 2 | 3 (12%) | 22 |
0.0253 (1.00) |
0.558 (1.00) |
0.23 (1.00) |
1 (1.00) |
| del 13q33 3 | 4 (16%) | 21 |
0.389 (1.00) |
0.766 (1.00) |
0.105 (1.00) |
1 (1.00) |
| del 15q15 1 | 8 (32%) | 17 |
0.799 (1.00) |
0.884 (1.00) |
0.234 (1.00) |
1 (1.00) |
| del 15q21 1 | 8 (32%) | 17 |
0.799 (1.00) |
0.884 (1.00) |
0.234 (1.00) |
1 (1.00) |
| del 16p13 13 | 4 (16%) | 21 |
0.724 (1.00) |
0.552 (1.00) |
0.105 (1.00) |
0.389 (1.00) |
| del 16q23 1 | 5 (20%) | 20 |
0.724 (1.00) |
0.475 (1.00) |
0.341 (1.00) |
0.151 (1.00) |
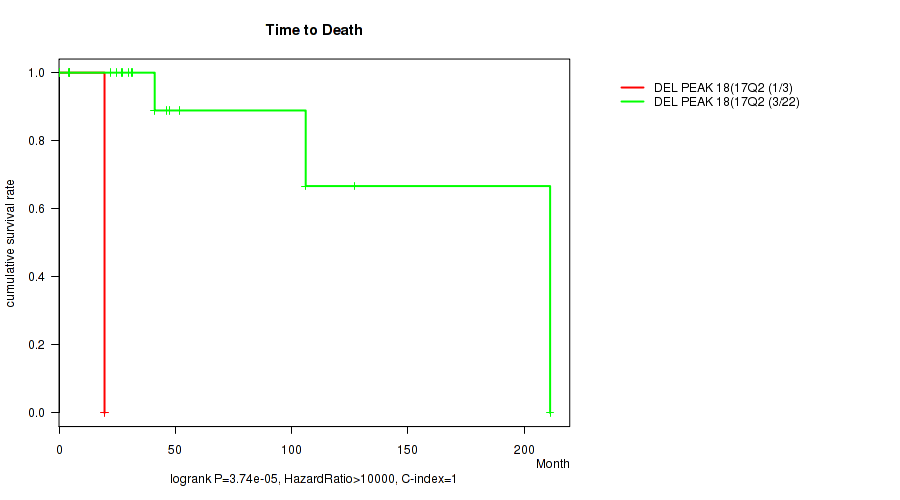
P value = 3.74e-05 (logrank test), Q value = 0.0036
Table S1. Gene #24: 'del_17q24.1' versus Clinical Feature #1: 'Time to Death'
| nPatients | nDeath | Duration Range (Median), Month | |
|---|---|---|---|
| ALL | 25 | 4 | 0.2 - 211.2 (29.9) |
| DEL PEAK 18(17Q24.1) MUTATED | 3 | 1 | 4.6 - 19.6 (15.0) |
| DEL PEAK 18(17Q24.1) WILD-TYPE | 22 | 3 | 0.2 - 211.2 (31.4) |
Figure S1. Get High-res Image Gene #24: 'del_17q24.1' versus Clinical Feature #1: 'Time to Death'
-
Copy number data file = transformed.cor.cli.txt
-
Clinical data file = DLBC-TP.merged_data.txt
-
Number of patients = 25
-
Number of significantly focal cnvs = 24
-
Number of selected clinical features = 4
-
Exclude genes that fewer than K tumors have mutations, K = 3
For survival clinical features, the Kaplan-Meier survival curves of tumors with and without gene mutations were plotted and the statistical significance P values were estimated by logrank test (Bland and Altman 2004) using the 'survdiff' function in R
For binary or multi-class clinical features (nominal or ordinal), two-tailed Fisher's exact tests (Fisher 1922) were used to estimate the P values using the 'fisher.test' function in R
For multiple hypothesis correction, Q value is the False Discovery Rate (FDR) analogue of the P value (Benjamini and Hochberg 1995), defined as the minimum FDR at which the test may be called significant. We used the 'Benjamini and Hochberg' method of 'p.adjust' function in R to convert P values into Q values.
In addition to the links below, the full results of the analysis summarized in this report can also be downloaded programmatically using firehose_get, or interactively from either the Broad GDAC website or TCGA Data Coordination Center Portal.