This pipeline computes the correlation between significant copy number variation (cnv focal) genes and molecular subtypes.
Testing the association between copy number variation 24 focal events and 7 molecular subtypes across 28 patients, one significant finding detected with P value < 0.05 and Q value < 0.25.
-
amp_2p15 cnv correlated to 'METHLYATION_CNMF'.
Table 1. Get Full Table Overview of the association between significant copy number variation of 24 focal events and 7 molecular subtypes. Shown in the table are P values (Q values). Thresholded by P value < 0.05 and Q value < 0.25, one significant finding detected.
|
Clinical Features |
METHLYATION CNMF |
MRNASEQ CNMF |
MRNASEQ CHIERARCHICAL |
MIRSEQ CNMF |
MIRSEQ CHIERARCHICAL |
MIRSEQ MATURE CNMF |
MIRSEQ MATURE CHIERARCHICAL |
||
| nCNV (%) | nWild-Type | Fisher's exact test | Fisher's exact test | Fisher's exact test | Fisher's exact test | Fisher's exact test | Fisher's exact test | Fisher's exact test | |
| amp 2p15 | 8 (29%) | 20 |
0.000414 (0.0696) |
0.686 (1.00) |
0.75 (1.00) |
1 (1.00) |
0.106 (1.00) |
0.434 (1.00) |
0.231 (1.00) |
| amp 1q31 1 | 9 (32%) | 19 |
0.435 (1.00) |
0.228 (1.00) |
0.0768 (1.00) |
0.0461 (1.00) |
0.636 (1.00) |
0.871 (1.00) |
0.327 (1.00) |
| amp 3q27 3 | 7 (25%) | 21 |
1 (1.00) |
0.396 (1.00) |
0.718 (1.00) |
0.385 (1.00) |
0.112 (1.00) |
0.419 (1.00) |
0.0164 (1.00) |
| amp 8q24 12 | 6 (21%) | 22 |
0.372 (1.00) |
1 (1.00) |
0.424 (1.00) |
1 (1.00) |
0.258 (1.00) |
0.292 (1.00) |
0.576 (1.00) |
| amp 12q13 12 | 5 (18%) | 23 |
0.153 (1.00) |
1 (1.00) |
0.122 (1.00) |
0.326 (1.00) |
0.453 (1.00) |
1 (1.00) |
1 (1.00) |
| amp 16p11 2 | 6 (21%) | 22 |
0.0691 (1.00) |
0.173 (1.00) |
0.34 (1.00) |
0.648 (1.00) |
0.79 (1.00) |
0.843 (1.00) |
0.871 (1.00) |
| amp xq27 3 | 6 (21%) | 22 |
0.0691 (1.00) |
0.655 (1.00) |
0.705 (1.00) |
0.648 (1.00) |
0.889 (1.00) |
0.844 (1.00) |
0.994 (1.00) |
| del 1p22 1 | 4 (14%) | 24 |
0.6 (1.00) |
1 (1.00) |
0.81 (1.00) |
0.326 (1.00) |
1 (1.00) |
1 (1.00) |
0.853 (1.00) |
| del 1p13 1 | 7 (25%) | 21 |
0.396 (1.00) |
0.67 (1.00) |
0.277 (1.00) |
0.0329 (1.00) |
0.504 (1.00) |
0.418 (1.00) |
0.504 (1.00) |
| del 1q43 | 7 (25%) | 21 |
0.198 (1.00) |
1 (1.00) |
1 (1.00) |
1 (1.00) |
0.898 (1.00) |
1 (1.00) |
0.98 (1.00) |
| del 2q23 1 | 6 (21%) | 22 |
1 (1.00) |
1 (1.00) |
0.518 (1.00) |
0.648 (1.00) |
1 (1.00) |
1 (1.00) |
0.711 (1.00) |
| del 6q14 1 | 9 (32%) | 19 |
0.689 (1.00) |
0.435 (1.00) |
0.329 (1.00) |
0.103 (1.00) |
0.176 (1.00) |
0.872 (1.00) |
0.544 (1.00) |
| del 6q23 3 | 7 (25%) | 21 |
0.198 (1.00) |
0.0836 (1.00) |
0.0225 (1.00) |
0.385 (1.00) |
0.114 (1.00) |
1 (1.00) |
0.627 (1.00) |
| del 8p23 1 | 4 (14%) | 24 |
1 (1.00) |
0.311 (1.00) |
0.354 (1.00) |
0.326 (1.00) |
0.513 (1.00) |
1 (1.00) |
0.0658 (1.00) |
| del 8q12 1 | 4 (14%) | 24 |
1 (1.00) |
0.311 (1.00) |
0.354 (1.00) |
0.326 (1.00) |
1 (1.00) |
1 (1.00) |
0.856 (1.00) |
| del 9p21 3 | 9 (32%) | 19 |
0.0418 (1.00) |
0.114 (1.00) |
0.33 (1.00) |
0.42 (1.00) |
0.00932 (1.00) |
0.282 (1.00) |
0.0197 (1.00) |
| del 10q23 31 | 5 (18%) | 23 |
1 (1.00) |
0.639 (1.00) |
0.0398 (1.00) |
0.648 (1.00) |
0.958 (1.00) |
1 (1.00) |
0.358 (1.00) |
| del 13q14 2 | 3 (11%) | 25 |
0.583 (1.00) |
1 (1.00) |
0.761 (1.00) |
1 (1.00) |
0.487 (1.00) |
0.751 (1.00) |
0.182 (1.00) |
| del 13q33 3 | 4 (14%) | 24 |
1 (1.00) |
0.102 (1.00) |
0.28 (1.00) |
0.222 (1.00) |
0.12 (1.00) |
0.75 (1.00) |
0.0309 (1.00) |
| del 15q15 1 | 8 (29%) | 20 |
0.221 (1.00) |
1 (1.00) |
0.647 (1.00) |
0.678 (1.00) |
0.229 (1.00) |
1 (1.00) |
0.0195 (1.00) |
| del 15q21 1 | 9 (32%) | 19 |
0.435 (1.00) |
1 (1.00) |
0.659 (1.00) |
1 (1.00) |
0.561 (1.00) |
1 (1.00) |
0.0777 (1.00) |
| del 16p13 13 | 4 (14%) | 24 |
0.311 (1.00) |
0.311 (1.00) |
0.808 (1.00) |
0.326 (1.00) |
0.161 (1.00) |
0.279 (1.00) |
0.287 (1.00) |
| del 16q23 1 | 5 (18%) | 23 |
1 (1.00) |
0.639 (1.00) |
0.45 (1.00) |
0.648 (1.00) |
0.567 (1.00) |
1 (1.00) |
0.611 (1.00) |
| del 17q24 1 | 4 (14%) | 24 |
0.0349 (1.00) |
1 (1.00) |
0.044 (1.00) |
1 (1.00) |
0.546 (1.00) |
0.499 (1.00) |
0.285 (1.00) |
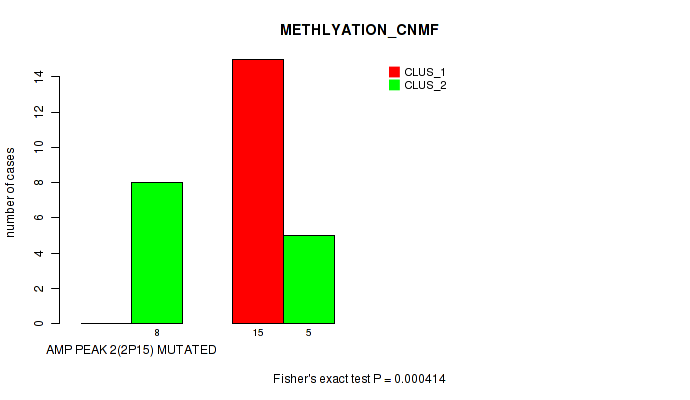
P value = 0.000414 (Fisher's exact test), Q value = 0.07
Table S1. Gene #2: 'amp_2p15' versus Molecular Subtype #1: 'METHLYATION_CNMF'
| nPatients | CLUS_1 | CLUS_2 |
|---|---|---|
| ALL | 15 | 13 |
| AMP PEAK 2(2P15) MUTATED | 0 | 8 |
| AMP PEAK 2(2P15) WILD-TYPE | 15 | 5 |
Figure S1. Get High-res Image Gene #2: 'amp_2p15' versus Molecular Subtype #1: 'METHLYATION_CNMF'
-
Copy number data file = transformed.cor.cli.txt
-
Molecular subtype file = DLBC-TP.transferedmergedcluster.txt
-
Number of patients = 28
-
Number of significantly focal cnvs = 24
-
Number of molecular subtypes = 7
-
Exclude genes that fewer than K tumors have alterations, K = 3
For binary or multi-class clinical features (nominal or ordinal), two-tailed Fisher's exact tests (Fisher 1922) were used to estimate the P values using the 'fisher.test' function in R
For multiple hypothesis correction, Q value is the False Discovery Rate (FDR) analogue of the P value (Benjamini and Hochberg 1995), defined as the minimum FDR at which the test may be called significant. We used the 'Benjamini and Hochberg' method of 'p.adjust' function in R to convert P values into Q values.
In addition to the links below, the full results of the analysis summarized in this report can also be downloaded programmatically using firehose_get, or interactively from either the Broad GDAC website or TCGA Data Coordination Center Portal.