This pipeline computes the correlation between significant arm-level copy number variations (cnvs) and molecular subtypes.
Testing the association between copy number variation 80 arm-level events and 8 molecular subtypes across 126 patients, 22 significant findings detected with P value < 0.05 and Q value < 0.25.
-
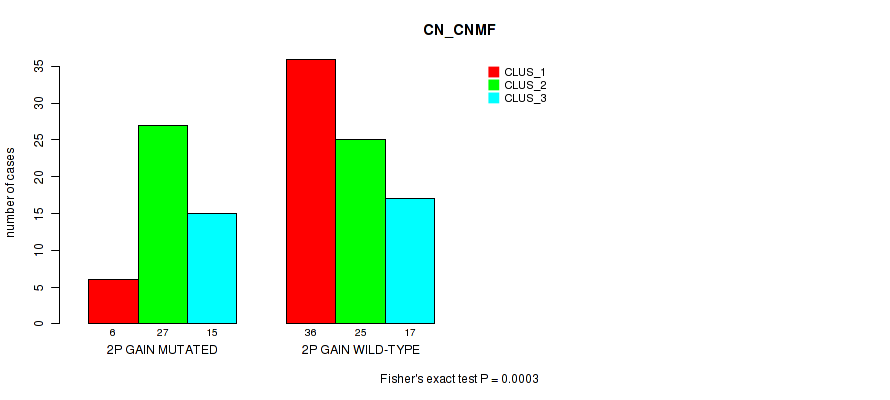
2p gain cnv correlated to 'CN_CNMF'.
-
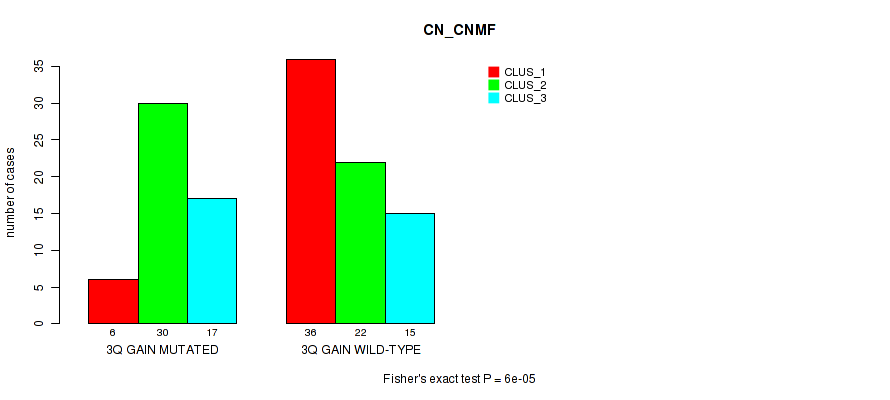
3q gain cnv correlated to 'CN_CNMF'.
-
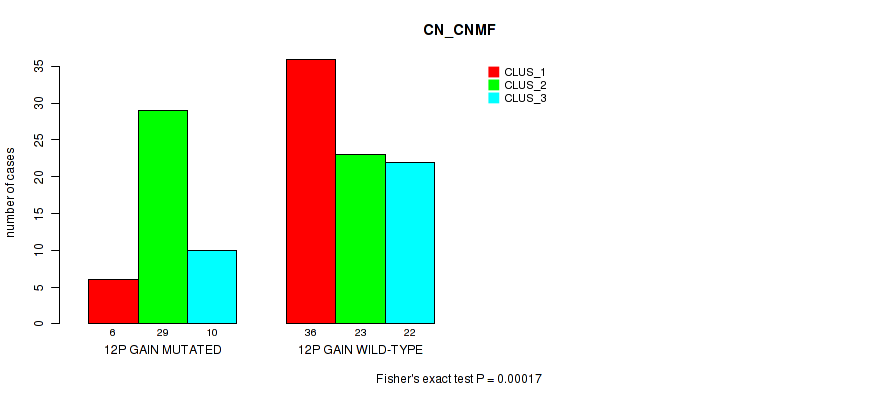
12p gain cnv correlated to 'CN_CNMF'.
-
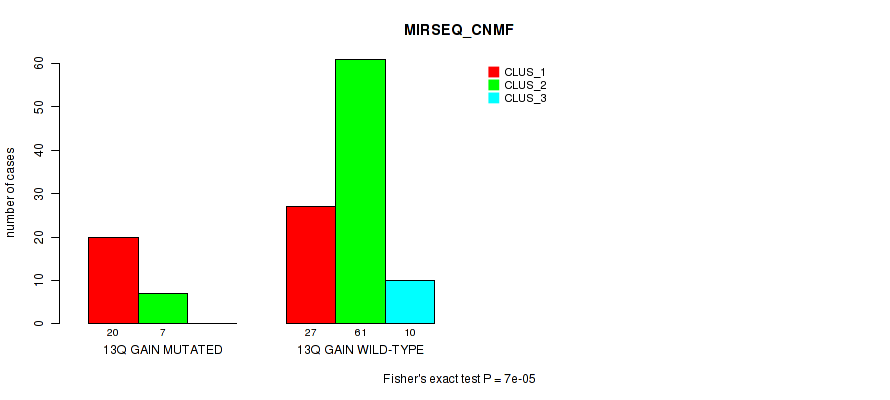
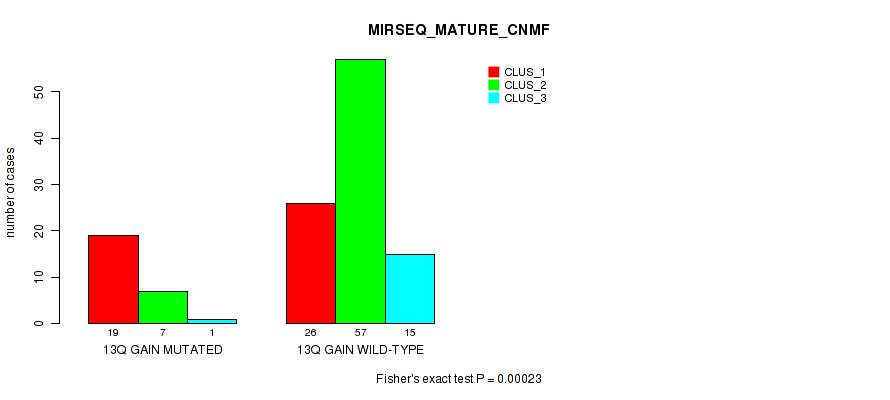
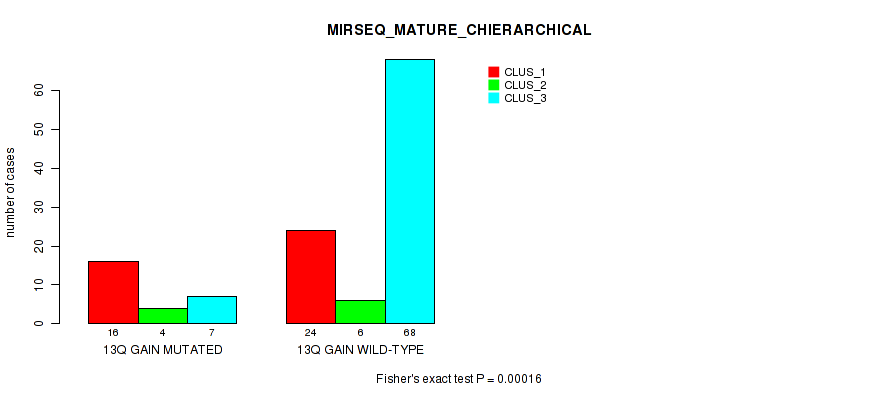
13q gain cnv correlated to 'MIRSEQ_CNMF', 'MIRSEQ_MATURE_CNMF', and 'MIRSEQ_MATURE_CHIERARCHICAL'.
-
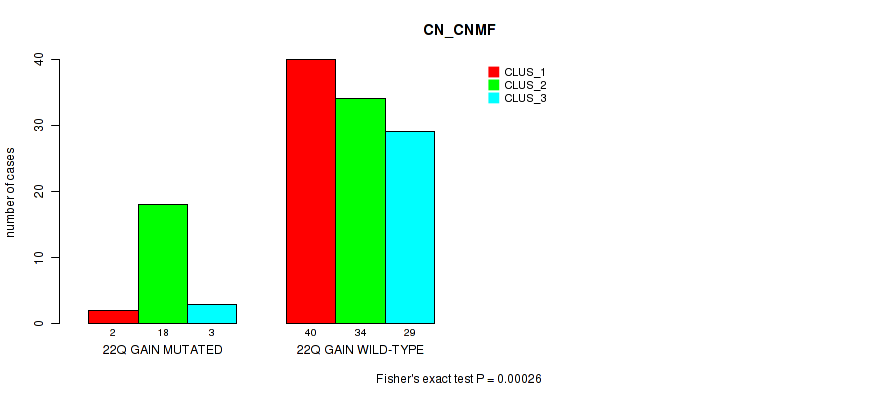
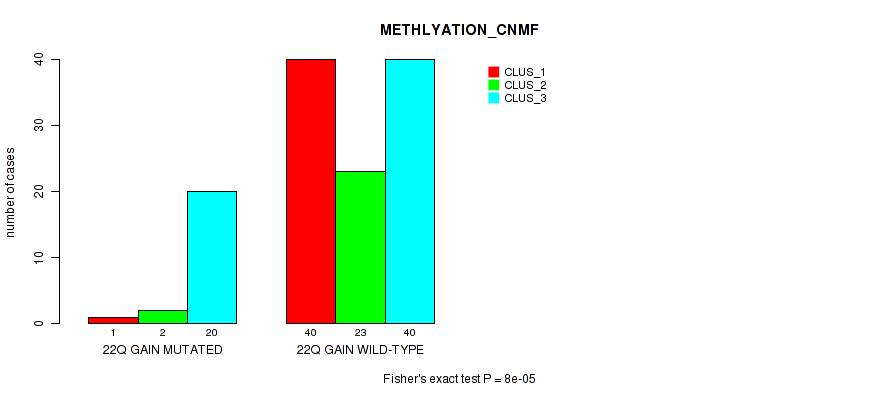
22q gain cnv correlated to 'CN_CNMF', 'METHLYATION_CNMF', 'MIRSEQ_CNMF', 'MIRSEQ_CHIERARCHICAL', 'MIRSEQ_MATURE_CNMF', and 'MIRSEQ_MATURE_CHIERARCHICAL'.
-
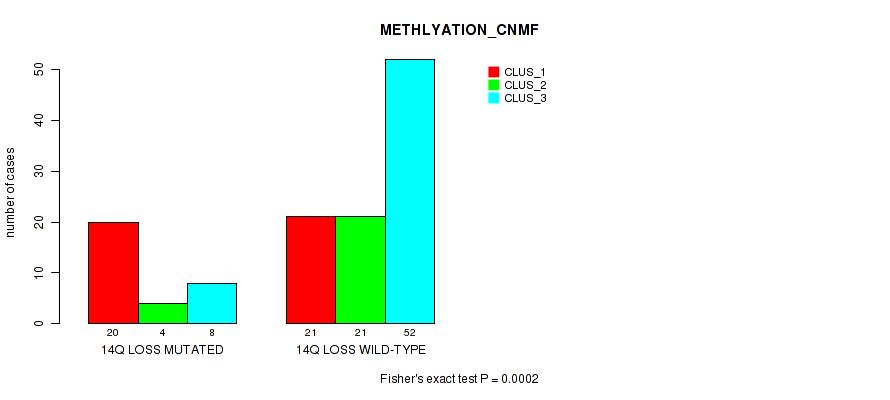
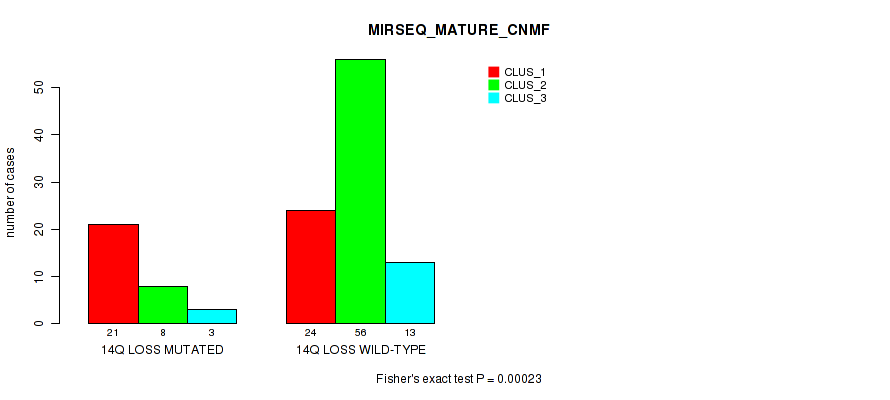
14q loss cnv correlated to 'METHLYATION_CNMF', 'MIRSEQ_MATURE_CNMF', and 'MIRSEQ_MATURE_CHIERARCHICAL'.
-
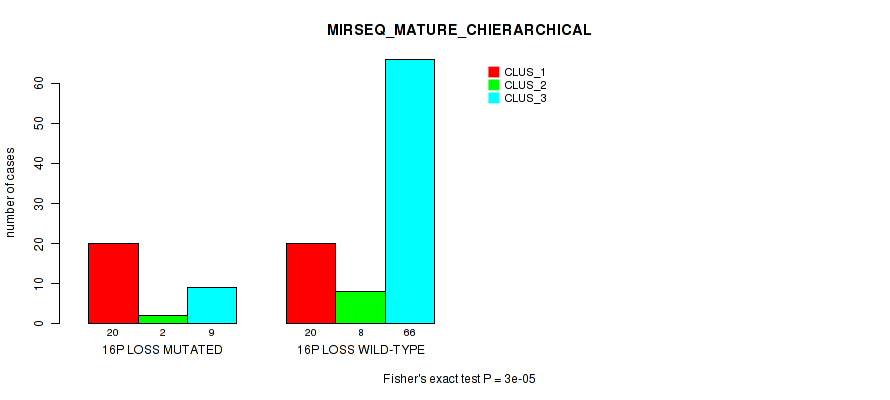
16p loss cnv correlated to 'MIRSEQ_MATURE_CNMF' and 'MIRSEQ_MATURE_CHIERARCHICAL'.
-
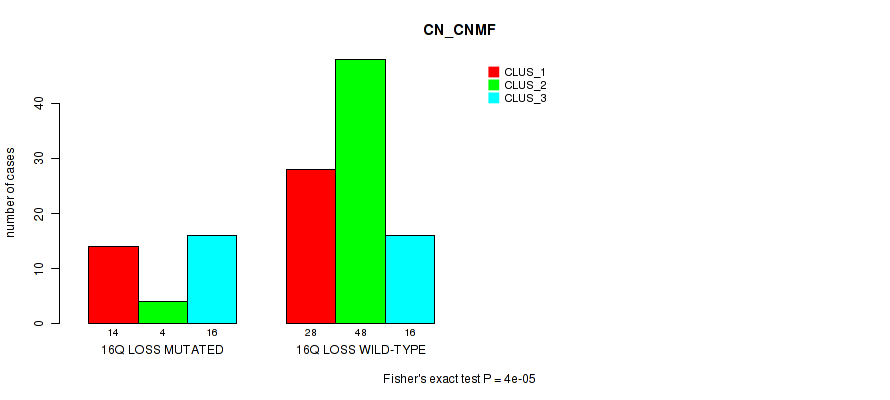
16q loss cnv correlated to 'CN_CNMF', 'MIRSEQ_CNMF', 'MIRSEQ_CHIERARCHICAL', 'MIRSEQ_MATURE_CNMF', and 'MIRSEQ_MATURE_CHIERARCHICAL'.
Table 1. Get Full Table Overview of the association between significant copy number variation of 80 arm-level events and 8 molecular subtypes. Shown in the table are P values (Q values). Thresholded by P value < 0.05 and Q value < 0.25, 22 significant findings detected.
|
Clinical Features |
CN CNMF |
METHLYATION CNMF |
MRNASEQ CNMF |
MRNASEQ CHIERARCHICAL |
MIRSEQ CNMF |
MIRSEQ CHIERARCHICAL |
MIRSEQ MATURE CNMF |
MIRSEQ MATURE CHIERARCHICAL |
||
| nCNV (%) | nWild-Type | Fisher's exact test | Fisher's exact test | Fisher's exact test | Fisher's exact test | Fisher's exact test | Fisher's exact test | Fisher's exact test | Fisher's exact test | |
| 22q gain | 23 (18%) | 103 |
0.00026 (0.161) |
8e-05 (0.0503) |
0.00081 (0.492) |
0.00047 (0.29) |
0.00021 (0.131) |
6e-05 (0.038) |
0.00015 (0.0942) |
0.00034 (0.21) |
| 16q loss | 34 (27%) | 92 |
4e-05 (0.0254) |
0.00094 (0.566) |
0.0401 (1.00) |
0.251 (1.00) |
4e-05 (0.0254) |
7e-05 (0.0442) |
2e-05 (0.0127) |
1e-05 (0.00638) |
| 13q gain | 27 (21%) | 99 |
0.00453 (1.00) |
0.00086 (0.52) |
0.0106 (1.00) |
0.0191 (1.00) |
7e-05 (0.0442) |
0.00079 (0.482) |
0.00023 (0.143) |
0.00016 (0.1) |
| 14q loss | 32 (25%) | 94 |
0.0032 (1.00) |
0.0002 (0.125) |
0.0723 (1.00) |
0.0619 (1.00) |
0.0008 (0.487) |
0.0005 (0.307) |
0.00023 (0.143) |
0.00029 (0.18) |
| 16p loss | 32 (25%) | 94 |
0.00156 (0.925) |
0.00094 (0.566) |
0.173 (1.00) |
0.192 (1.00) |
0.0006 (0.368) |
0.00089 (0.538) |
0.00016 (0.1) |
3e-05 (0.0191) |
| 2p gain | 48 (38%) | 78 |
0.0003 (0.185) |
0.196 (1.00) |
0.378 (1.00) |
0.764 (1.00) |
0.0169 (1.00) |
0.484 (1.00) |
0.00754 (1.00) |
0.158 (1.00) |
| 3q gain | 53 (42%) | 73 |
6e-05 (0.038) |
0.00362 (1.00) |
0.0594 (1.00) |
0.0217 (1.00) |
0.125 (1.00) |
0.0908 (1.00) |
0.16 (1.00) |
0.0353 (1.00) |
| 12p gain | 45 (36%) | 81 |
0.00017 (0.106) |
0.0105 (1.00) |
0.024 (1.00) |
0.00658 (1.00) |
0.0227 (1.00) |
0.00654 (1.00) |
0.0231 (1.00) |
0.0101 (1.00) |
| 1p gain | 23 (18%) | 103 |
0.164 (1.00) |
0.307 (1.00) |
0.306 (1.00) |
0.615 (1.00) |
0.377 (1.00) |
0.62 (1.00) |
0.11 (1.00) |
0.879 (1.00) |
| 1q gain | 40 (32%) | 86 |
0.0925 (1.00) |
0.341 (1.00) |
0.0435 (1.00) |
0.0171 (1.00) |
0.0666 (1.00) |
0.0921 (1.00) |
0.00942 (1.00) |
0.141 (1.00) |
| 2q gain | 35 (28%) | 91 |
0.0408 (1.00) |
0.136 (1.00) |
0.432 (1.00) |
0.253 (1.00) |
0.104 (1.00) |
0.649 (1.00) |
0.366 (1.00) |
0.74 (1.00) |
| 3p gain | 19 (15%) | 107 |
0.152 (1.00) |
0.222 (1.00) |
0.423 (1.00) |
0.327 (1.00) |
1 (1.00) |
0.484 (1.00) |
0.729 (1.00) |
1 (1.00) |
| 4p gain | 13 (10%) | 113 |
0.807 (1.00) |
0.932 (1.00) |
0.932 (1.00) |
0.823 (1.00) |
1 (1.00) |
0.607 (1.00) |
1 (1.00) |
0.656 (1.00) |
| 4q gain | 11 (9%) | 115 |
0.343 (1.00) |
0.454 (1.00) |
0.42 (1.00) |
0.231 (1.00) |
0.625 (1.00) |
0.703 (1.00) |
0.822 (1.00) |
0.699 (1.00) |
| 5p gain | 53 (42%) | 73 |
0.0275 (1.00) |
0.379 (1.00) |
0.505 (1.00) |
0.672 (1.00) |
0.315 (1.00) |
0.254 (1.00) |
0.216 (1.00) |
0.318 (1.00) |
| 5q gain | 16 (13%) | 110 |
0.747 (1.00) |
0.938 (1.00) |
0.829 (1.00) |
0.957 (1.00) |
0.308 (1.00) |
0.85 (1.00) |
0.413 (1.00) |
0.495 (1.00) |
| 6p gain | 24 (19%) | 102 |
0.525 (1.00) |
0.798 (1.00) |
0.0141 (1.00) |
0.309 (1.00) |
0.686 (1.00) |
0.128 (1.00) |
0.591 (1.00) |
0.525 (1.00) |
| 6q gain | 20 (16%) | 106 |
0.288 (1.00) |
0.695 (1.00) |
0.00703 (1.00) |
0.278 (1.00) |
0.752 (1.00) |
0.589 (1.00) |
0.697 (1.00) |
0.745 (1.00) |
| 7p gain | 72 (57%) | 54 |
0.0411 (1.00) |
0.21 (1.00) |
0.00112 (0.672) |
0.0618 (1.00) |
0.0266 (1.00) |
0.243 (1.00) |
0.106 (1.00) |
0.0388 (1.00) |
| 7q gain | 58 (46%) | 68 |
0.259 (1.00) |
0.0861 (1.00) |
0.202 (1.00) |
0.689 (1.00) |
0.345 (1.00) |
0.927 (1.00) |
0.4 (1.00) |
0.571 (1.00) |
| 8p gain | 46 (37%) | 80 |
0.0818 (1.00) |
0.578 (1.00) |
0.656 (1.00) |
0.441 (1.00) |
0.609 (1.00) |
0.474 (1.00) |
0.593 (1.00) |
0.0177 (1.00) |
| 8q gain | 67 (53%) | 59 |
0.0268 (1.00) |
0.751 (1.00) |
1 (1.00) |
0.566 (1.00) |
0.704 (1.00) |
0.533 (1.00) |
0.798 (1.00) |
0.362 (1.00) |
| 9p gain | 11 (9%) | 115 |
0.668 (1.00) |
0.774 (1.00) |
0.0858 (1.00) |
0.0907 (1.00) |
0.891 (1.00) |
0.664 (1.00) |
1 (1.00) |
1 (1.00) |
| 9q gain | 25 (20%) | 101 |
0.634 (1.00) |
0.615 (1.00) |
0.364 (1.00) |
0.424 (1.00) |
0.782 (1.00) |
0.293 (1.00) |
0.9 (1.00) |
0.194 (1.00) |
| 10p gain | 24 (19%) | 102 |
0.527 (1.00) |
0.0188 (1.00) |
0.517 (1.00) |
0.881 (1.00) |
0.09 (1.00) |
0.51 (1.00) |
0.0235 (1.00) |
0.256 (1.00) |
| 10q gain | 17 (13%) | 109 |
0.242 (1.00) |
0.112 (1.00) |
0.78 (1.00) |
0.342 (1.00) |
0.236 (1.00) |
0.548 (1.00) |
0.11 (1.00) |
0.295 (1.00) |
| 11p gain | 27 (21%) | 99 |
0.79 (1.00) |
0.846 (1.00) |
0.0337 (1.00) |
0.102 (1.00) |
0.384 (1.00) |
0.327 (1.00) |
0.432 (1.00) |
0.399 (1.00) |
| 11q gain | 24 (19%) | 102 |
0.249 (1.00) |
0.15 (1.00) |
0.0577 (1.00) |
0.0773 (1.00) |
0.0147 (1.00) |
0.105 (1.00) |
0.0407 (1.00) |
0.0328 (1.00) |
| 12q gain | 26 (21%) | 100 |
0.0195 (1.00) |
0.0479 (1.00) |
0.53 (1.00) |
0.0701 (1.00) |
0.369 (1.00) |
0.332 (1.00) |
0.313 (1.00) |
0.437 (1.00) |
| 14q gain | 31 (25%) | 95 |
0.118 (1.00) |
0.177 (1.00) |
0.249 (1.00) |
0.065 (1.00) |
0.061 (1.00) |
0.0593 (1.00) |
0.0622 (1.00) |
0.111 (1.00) |
| 15q gain | 24 (19%) | 102 |
0.627 (1.00) |
0.0391 (1.00) |
0.476 (1.00) |
0.657 (1.00) |
0.0732 (1.00) |
0.213 (1.00) |
0.147 (1.00) |
0.0415 (1.00) |
| 16p gain | 29 (23%) | 97 |
0.00425 (1.00) |
0.0368 (1.00) |
0.0206 (1.00) |
0.128 (1.00) |
0.0191 (1.00) |
0.0219 (1.00) |
0.0121 (1.00) |
0.00644 (1.00) |
| 16q gain | 24 (19%) | 102 |
0.00069 (0.422) |
0.0111 (1.00) |
0.00127 (0.759) |
0.0134 (1.00) |
0.00983 (1.00) |
0.00219 (1.00) |
0.00322 (1.00) |
0.00135 (0.806) |
| 17p gain | 23 (18%) | 103 |
0.0138 (1.00) |
0.0345 (1.00) |
0.467 (1.00) |
0.438 (1.00) |
0.668 (1.00) |
0.862 (1.00) |
0.385 (1.00) |
0.706 (1.00) |
| 17q gain | 30 (24%) | 96 |
0.00369 (1.00) |
0.266 (1.00) |
0.493 (1.00) |
0.623 (1.00) |
0.618 (1.00) |
0.99 (1.00) |
0.636 (1.00) |
0.603 (1.00) |
| 18p gain | 34 (27%) | 92 |
0.00745 (1.00) |
0.697 (1.00) |
0.428 (1.00) |
0.517 (1.00) |
0.366 (1.00) |
0.941 (1.00) |
0.661 (1.00) |
0.906 (1.00) |
| 18q gain | 16 (13%) | 110 |
0.0111 (1.00) |
0.124 (1.00) |
0.779 (1.00) |
0.622 (1.00) |
0.344 (1.00) |
0.436 (1.00) |
0.481 (1.00) |
0.201 (1.00) |
| 19p gain | 15 (12%) | 111 |
0.474 (1.00) |
0.625 (1.00) |
0.929 (1.00) |
1 (1.00) |
0.753 (1.00) |
0.916 (1.00) |
0.925 (1.00) |
0.905 (1.00) |
| 19q gain | 20 (16%) | 106 |
0.0352 (1.00) |
0.213 (1.00) |
0.181 (1.00) |
0.141 (1.00) |
0.0605 (1.00) |
0.167 (1.00) |
0.159 (1.00) |
0.0595 (1.00) |
| 20p gain | 64 (51%) | 62 |
0.0343 (1.00) |
0.153 (1.00) |
0.516 (1.00) |
0.289 (1.00) |
0.321 (1.00) |
0.726 (1.00) |
0.0392 (1.00) |
0.142 (1.00) |
| 20q gain | 69 (55%) | 57 |
0.0314 (1.00) |
0.0148 (1.00) |
0.104 (1.00) |
0.0785 (1.00) |
0.0078 (1.00) |
0.0253 (1.00) |
0.00085 (0.516) |
0.00118 (0.707) |
| 21q gain | 11 (9%) | 115 |
0.482 (1.00) |
0.292 (1.00) |
0.601 (1.00) |
0.557 (1.00) |
0.435 (1.00) |
0.454 (1.00) |
0.53 (1.00) |
0.231 (1.00) |
| xq gain | 30 (24%) | 96 |
0.0592 (1.00) |
0.0737 (1.00) |
0.436 (1.00) |
0.198 (1.00) |
0.0329 (1.00) |
0.066 (1.00) |
0.0456 (1.00) |
0.0569 (1.00) |
| 1p loss | 25 (20%) | 101 |
0.0875 (1.00) |
0.113 (1.00) |
0.371 (1.00) |
0.3 (1.00) |
0.315 (1.00) |
0.0996 (1.00) |
0.122 (1.00) |
0.362 (1.00) |
| 1q loss | 17 (13%) | 109 |
0.0415 (1.00) |
0.111 (1.00) |
0.258 (1.00) |
0.27 (1.00) |
0.102 (1.00) |
0.255 (1.00) |
0.0649 (1.00) |
0.132 (1.00) |
| 2p loss | 6 (5%) | 120 |
0.76 (1.00) |
0.146 (1.00) |
0.331 (1.00) |
0.177 (1.00) |
0.501 (1.00) |
0.798 (1.00) |
||
| 2q loss | 14 (11%) | 112 |
0.877 (1.00) |
0.237 (1.00) |
0.0162 (1.00) |
0.0492 (1.00) |
0.294 (1.00) |
0.158 (1.00) |
0.482 (1.00) |
0.313 (1.00) |
| 3p loss | 67 (53%) | 59 |
0.0102 (1.00) |
0.00841 (1.00) |
0.523 (1.00) |
0.413 (1.00) |
0.00246 (1.00) |
0.00228 (1.00) |
0.00173 (1.00) |
0.00148 (0.882) |
| 3q loss | 19 (15%) | 107 |
0.134 (1.00) |
0.434 (1.00) |
0.119 (1.00) |
0.292 (1.00) |
0.583 (1.00) |
0.573 (1.00) |
0.338 (1.00) |
0.539 (1.00) |
| 4p loss | 71 (56%) | 55 |
0.00508 (1.00) |
0.255 (1.00) |
0.141 (1.00) |
0.393 (1.00) |
0.00229 (1.00) |
0.263 (1.00) |
0.00824 (1.00) |
0.0478 (1.00) |
| 4q loss | 61 (48%) | 65 |
0.0405 (1.00) |
0.735 (1.00) |
0.0913 (1.00) |
0.728 (1.00) |
0.338 (1.00) |
0.819 (1.00) |
0.265 (1.00) |
0.164 (1.00) |
| 5p loss | 31 (25%) | 95 |
0.0948 (1.00) |
0.00552 (1.00) |
0.138 (1.00) |
0.124 (1.00) |
0.00777 (1.00) |
0.0113 (1.00) |
0.00155 (0.921) |
0.0127 (1.00) |
| 5q loss | 53 (42%) | 73 |
0.366 (1.00) |
0.016 (1.00) |
0.475 (1.00) |
0.917 (1.00) |
0.0549 (1.00) |
0.0602 (1.00) |
0.048 (1.00) |
0.0814 (1.00) |
| 6p loss | 29 (23%) | 97 |
0.034 (1.00) |
0.401 (1.00) |
0.171 (1.00) |
0.359 (1.00) |
0.251 (1.00) |
0.116 (1.00) |
0.433 (1.00) |
0.286 (1.00) |
| 6q loss | 29 (23%) | 97 |
0.265 (1.00) |
0.701 (1.00) |
0.24 (1.00) |
0.333 (1.00) |
0.374 (1.00) |
0.503 (1.00) |
0.73 (1.00) |
0.54 (1.00) |
| 7p loss | 9 (7%) | 117 |
0.618 (1.00) |
0.206 (1.00) |
0.321 (1.00) |
0.292 (1.00) |
0.116 (1.00) |
0.0706 (1.00) |
0.0831 (1.00) |
0.0668 (1.00) |
| 7q loss | 12 (10%) | 114 |
0.209 (1.00) |
0.193 (1.00) |
0.48 (1.00) |
0.598 (1.00) |
0.4 (1.00) |
0.59 (1.00) |
0.634 (1.00) |
0.496 (1.00) |
| 8p loss | 40 (32%) | 86 |
0.243 (1.00) |
0.236 (1.00) |
0.322 (1.00) |
0.176 (1.00) |
0.174 (1.00) |
0.652 (1.00) |
0.349 (1.00) |
0.524 (1.00) |
| 8q loss | 13 (10%) | 113 |
0.241 (1.00) |
0.595 (1.00) |
1 (1.00) |
1 (1.00) |
0.741 (1.00) |
0.301 (1.00) |
1 (1.00) |
0.657 (1.00) |
| 9p loss | 70 (56%) | 56 |
0.483 (1.00) |
0.75 (1.00) |
0.304 (1.00) |
0.588 (1.00) |
0.0599 (1.00) |
0.208 (1.00) |
0.294 (1.00) |
0.922 (1.00) |
| 9q loss | 45 (36%) | 81 |
0.082 (1.00) |
0.215 (1.00) |
0.824 (1.00) |
0.571 (1.00) |
0.271 (1.00) |
0.133 (1.00) |
0.203 (1.00) |
0.318 (1.00) |
| 10p loss | 35 (28%) | 91 |
0.0379 (1.00) |
0.0513 (1.00) |
0.567 (1.00) |
0.0927 (1.00) |
0.157 (1.00) |
0.143 (1.00) |
0.0373 (1.00) |
0.059 (1.00) |
| 10q loss | 37 (29%) | 89 |
0.0114 (1.00) |
0.0109 (1.00) |
0.372 (1.00) |
0.254 (1.00) |
0.0424 (1.00) |
0.0155 (1.00) |
0.0263 (1.00) |
0.0691 (1.00) |
| 11p loss | 38 (30%) | 88 |
0.245 (1.00) |
0.493 (1.00) |
0.184 (1.00) |
0.541 (1.00) |
1 (1.00) |
0.368 (1.00) |
0.768 (1.00) |
0.868 (1.00) |
| 11q loss | 43 (34%) | 83 |
0.00172 (1.00) |
0.385 (1.00) |
0.698 (1.00) |
0.222 (1.00) |
0.148 (1.00) |
0.255 (1.00) |
0.198 (1.00) |
0.157 (1.00) |
| 12p loss | 19 (15%) | 107 |
0.0173 (1.00) |
0.00457 (1.00) |
0.0232 (1.00) |
0.0101 (1.00) |
0.00272 (1.00) |
0.0121 (1.00) |
0.00966 (1.00) |
0.0022 (1.00) |
| 12q loss | 18 (14%) | 108 |
0.323 (1.00) |
0.0415 (1.00) |
0.0284 (1.00) |
0.0225 (1.00) |
0.0231 (1.00) |
0.101 (1.00) |
0.0613 (1.00) |
0.0132 (1.00) |
| 13q loss | 52 (41%) | 74 |
0.0202 (1.00) |
0.0736 (1.00) |
0.126 (1.00) |
0.196 (1.00) |
0.0173 (1.00) |
0.11 (1.00) |
0.0756 (1.00) |
0.108 (1.00) |
| 15q loss | 33 (26%) | 93 |
0.787 (1.00) |
0.344 (1.00) |
0.244 (1.00) |
0.466 (1.00) |
0.639 (1.00) |
0.336 (1.00) |
0.419 (1.00) |
0.0556 (1.00) |
| 17p loss | 47 (37%) | 79 |
0.101 (1.00) |
0.00075 (0.458) |
0.0735 (1.00) |
0.111 (1.00) |
0.00085 (0.516) |
0.00152 (0.904) |
0.00862 (1.00) |
0.00089 (0.538) |
| 17q loss | 17 (13%) | 109 |
0.673 (1.00) |
0.624 (1.00) |
0.221 (1.00) |
0.135 (1.00) |
0.565 (1.00) |
0.873 (1.00) |
0.251 (1.00) |
0.919 (1.00) |
| 18p loss | 44 (35%) | 82 |
0.301 (1.00) |
0.0101 (1.00) |
0.403 (1.00) |
0.433 (1.00) |
0.0269 (1.00) |
0.0611 (1.00) |
0.0335 (1.00) |
0.0207 (1.00) |
| 18q loss | 66 (52%) | 60 |
0.69 (1.00) |
0.221 (1.00) |
0.628 (1.00) |
0.788 (1.00) |
0.286 (1.00) |
0.17 (1.00) |
0.233 (1.00) |
0.165 (1.00) |
| 19p loss | 43 (34%) | 83 |
0.0139 (1.00) |
0.0955 (1.00) |
0.413 (1.00) |
0.692 (1.00) |
0.12 (1.00) |
0.0904 (1.00) |
0.0657 (1.00) |
0.0365 (1.00) |
| 19q loss | 35 (28%) | 91 |
0.0006 (0.368) |
0.0164 (1.00) |
0.631 (1.00) |
0.499 (1.00) |
0.0608 (1.00) |
0.0524 (1.00) |
0.0623 (1.00) |
0.0213 (1.00) |
| 20p loss | 17 (13%) | 109 |
0.322 (1.00) |
0.888 (1.00) |
0.823 (1.00) |
0.39 (1.00) |
0.921 (1.00) |
0.322 (1.00) |
1 (1.00) |
0.268 (1.00) |
| 20q loss | 7 (6%) | 119 |
0.888 (1.00) |
0.773 (1.00) |
0.841 (1.00) |
0.853 (1.00) |
0.692 (1.00) |
0.397 (1.00) |
0.874 (1.00) |
0.18 (1.00) |
| 21q loss | 73 (58%) | 53 |
0.3 (1.00) |
0.0169 (1.00) |
0.0143 (1.00) |
0.0259 (1.00) |
0.0202 (1.00) |
0.0403 (1.00) |
0.0206 (1.00) |
0.0234 (1.00) |
| 22q loss | 45 (36%) | 81 |
0.0966 (1.00) |
0.00292 (1.00) |
0.129 (1.00) |
0.419 (1.00) |
0.0117 (1.00) |
0.144 (1.00) |
0.00476 (1.00) |
0.01 (1.00) |
| xq loss | 26 (21%) | 100 |
0.0263 (1.00) |
0.0103 (1.00) |
0.154 (1.00) |
0.182 (1.00) |
0.0826 (1.00) |
0.0114 (1.00) |
0.0831 (1.00) |
0.0168 (1.00) |
P value = 3e-04 (Fisher's exact test), Q value = 0.19
Table S1. Gene #3: '2p gain' versus Molecular Subtype #1: 'CN_CNMF'
| nPatients | CLUS_1 | CLUS_2 | CLUS_3 |
|---|---|---|---|
| ALL | 42 | 52 | 32 |
| 2P GAIN MUTATED | 6 | 27 | 15 |
| 2P GAIN WILD-TYPE | 36 | 25 | 17 |
Figure S1. Get High-res Image Gene #3: '2p gain' versus Molecular Subtype #1: 'CN_CNMF'
P value = 6e-05 (Fisher's exact test), Q value = 0.038
Table S2. Gene #6: '3q gain' versus Molecular Subtype #1: 'CN_CNMF'
| nPatients | CLUS_1 | CLUS_2 | CLUS_3 |
|---|---|---|---|
| ALL | 42 | 52 | 32 |
| 3Q GAIN MUTATED | 6 | 30 | 17 |
| 3Q GAIN WILD-TYPE | 36 | 22 | 15 |
Figure S2. Get High-res Image Gene #6: '3q gain' versus Molecular Subtype #1: 'CN_CNMF'
P value = 0.00017 (Fisher's exact test), Q value = 0.11
Table S3. Gene #23: '12p gain' versus Molecular Subtype #1: 'CN_CNMF'
| nPatients | CLUS_1 | CLUS_2 | CLUS_3 |
|---|---|---|---|
| ALL | 42 | 52 | 32 |
| 12P GAIN MUTATED | 6 | 29 | 10 |
| 12P GAIN WILD-TYPE | 36 | 23 | 22 |
Figure S3. Get High-res Image Gene #23: '12p gain' versus Molecular Subtype #1: 'CN_CNMF'
P value = 7e-05 (Fisher's exact test), Q value = 0.044
Table S4. Gene #25: '13q gain' versus Molecular Subtype #5: 'MIRSEQ_CNMF'
| nPatients | CLUS_1 | CLUS_2 | CLUS_3 |
|---|---|---|---|
| ALL | 47 | 68 | 10 |
| 13Q GAIN MUTATED | 20 | 7 | 0 |
| 13Q GAIN WILD-TYPE | 27 | 61 | 10 |
Figure S4. Get High-res Image Gene #25: '13q gain' versus Molecular Subtype #5: 'MIRSEQ_CNMF'
P value = 0.00023 (Fisher's exact test), Q value = 0.14
Table S5. Gene #25: '13q gain' versus Molecular Subtype #7: 'MIRSEQ_MATURE_CNMF'
| nPatients | CLUS_1 | CLUS_2 | CLUS_3 |
|---|---|---|---|
| ALL | 45 | 64 | 16 |
| 13Q GAIN MUTATED | 19 | 7 | 1 |
| 13Q GAIN WILD-TYPE | 26 | 57 | 15 |
Figure S5. Get High-res Image Gene #25: '13q gain' versus Molecular Subtype #7: 'MIRSEQ_MATURE_CNMF'
P value = 0.00016 (Fisher's exact test), Q value = 0.1
Table S6. Gene #25: '13q gain' versus Molecular Subtype #8: 'MIRSEQ_MATURE_CHIERARCHICAL'
| nPatients | CLUS_1 | CLUS_2 | CLUS_3 |
|---|---|---|---|
| ALL | 40 | 10 | 75 |
| 13Q GAIN MUTATED | 16 | 4 | 7 |
| 13Q GAIN WILD-TYPE | 24 | 6 | 68 |
Figure S6. Get High-res Image Gene #25: '13q gain' versus Molecular Subtype #8: 'MIRSEQ_MATURE_CHIERARCHICAL'
P value = 0.00026 (Fisher's exact test), Q value = 0.16
Table S7. Gene #39: '22q gain' versus Molecular Subtype #1: 'CN_CNMF'
| nPatients | CLUS_1 | CLUS_2 | CLUS_3 |
|---|---|---|---|
| ALL | 42 | 52 | 32 |
| 22Q GAIN MUTATED | 2 | 18 | 3 |
| 22Q GAIN WILD-TYPE | 40 | 34 | 29 |
Figure S7. Get High-res Image Gene #39: '22q gain' versus Molecular Subtype #1: 'CN_CNMF'
P value = 8e-05 (Fisher's exact test), Q value = 0.05
Table S8. Gene #39: '22q gain' versus Molecular Subtype #2: 'METHLYATION_CNMF'
| nPatients | CLUS_1 | CLUS_2 | CLUS_3 |
|---|---|---|---|
| ALL | 41 | 25 | 60 |
| 22Q GAIN MUTATED | 1 | 2 | 20 |
| 22Q GAIN WILD-TYPE | 40 | 23 | 40 |
Figure S8. Get High-res Image Gene #39: '22q gain' versus Molecular Subtype #2: 'METHLYATION_CNMF'
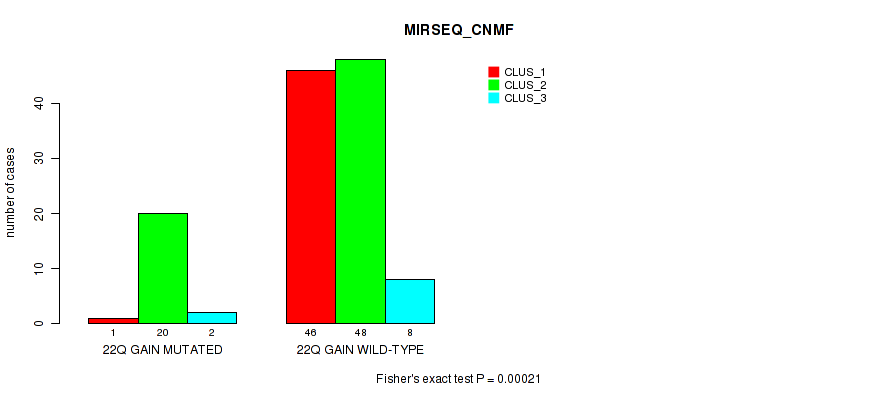
P value = 0.00021 (Fisher's exact test), Q value = 0.13
Table S9. Gene #39: '22q gain' versus Molecular Subtype #5: 'MIRSEQ_CNMF'
| nPatients | CLUS_1 | CLUS_2 | CLUS_3 |
|---|---|---|---|
| ALL | 47 | 68 | 10 |
| 22Q GAIN MUTATED | 1 | 20 | 2 |
| 22Q GAIN WILD-TYPE | 46 | 48 | 8 |
Figure S9. Get High-res Image Gene #39: '22q gain' versus Molecular Subtype #5: 'MIRSEQ_CNMF'
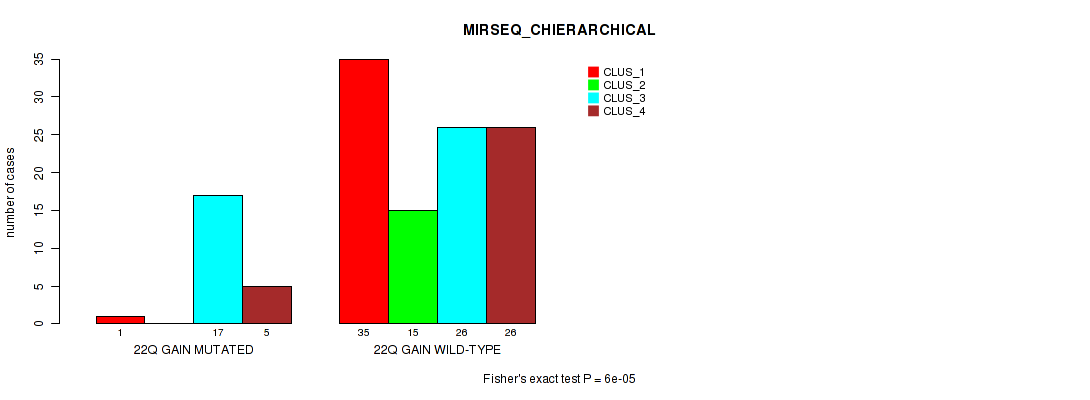
P value = 6e-05 (Fisher's exact test), Q value = 0.038
Table S10. Gene #39: '22q gain' versus Molecular Subtype #6: 'MIRSEQ_CHIERARCHICAL'
| nPatients | CLUS_1 | CLUS_2 | CLUS_3 | CLUS_4 |
|---|---|---|---|---|
| ALL | 36 | 15 | 43 | 31 |
| 22Q GAIN MUTATED | 1 | 0 | 17 | 5 |
| 22Q GAIN WILD-TYPE | 35 | 15 | 26 | 26 |
Figure S10. Get High-res Image Gene #39: '22q gain' versus Molecular Subtype #6: 'MIRSEQ_CHIERARCHICAL'
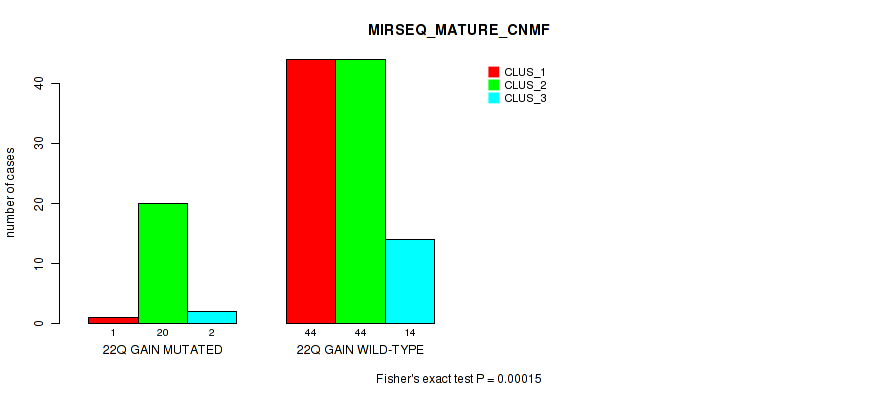
P value = 0.00015 (Fisher's exact test), Q value = 0.094
Table S11. Gene #39: '22q gain' versus Molecular Subtype #7: 'MIRSEQ_MATURE_CNMF'
| nPatients | CLUS_1 | CLUS_2 | CLUS_3 |
|---|---|---|---|
| ALL | 45 | 64 | 16 |
| 22Q GAIN MUTATED | 1 | 20 | 2 |
| 22Q GAIN WILD-TYPE | 44 | 44 | 14 |
Figure S11. Get High-res Image Gene #39: '22q gain' versus Molecular Subtype #7: 'MIRSEQ_MATURE_CNMF'
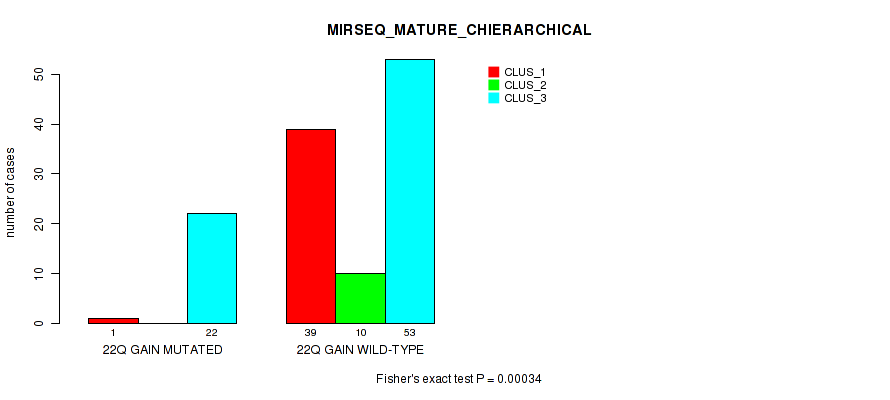
P value = 0.00034 (Fisher's exact test), Q value = 0.21
Table S12. Gene #39: '22q gain' versus Molecular Subtype #8: 'MIRSEQ_MATURE_CHIERARCHICAL'
| nPatients | CLUS_1 | CLUS_2 | CLUS_3 |
|---|---|---|---|
| ALL | 40 | 10 | 75 |
| 22Q GAIN MUTATED | 1 | 0 | 22 |
| 22Q GAIN WILD-TYPE | 39 | 10 | 53 |
Figure S12. Get High-res Image Gene #39: '22q gain' versus Molecular Subtype #8: 'MIRSEQ_MATURE_CHIERARCHICAL'
P value = 2e-04 (Fisher's exact test), Q value = 0.12
Table S13. Gene #66: '14q loss' versus Molecular Subtype #2: 'METHLYATION_CNMF'
| nPatients | CLUS_1 | CLUS_2 | CLUS_3 |
|---|---|---|---|
| ALL | 41 | 25 | 60 |
| 14Q LOSS MUTATED | 20 | 4 | 8 |
| 14Q LOSS WILD-TYPE | 21 | 21 | 52 |
Figure S13. Get High-res Image Gene #66: '14q loss' versus Molecular Subtype #2: 'METHLYATION_CNMF'
P value = 0.00023 (Fisher's exact test), Q value = 0.14
Table S14. Gene #66: '14q loss' versus Molecular Subtype #7: 'MIRSEQ_MATURE_CNMF'
| nPatients | CLUS_1 | CLUS_2 | CLUS_3 |
|---|---|---|---|
| ALL | 45 | 64 | 16 |
| 14Q LOSS MUTATED | 21 | 8 | 3 |
| 14Q LOSS WILD-TYPE | 24 | 56 | 13 |
Figure S14. Get High-res Image Gene #66: '14q loss' versus Molecular Subtype #7: 'MIRSEQ_MATURE_CNMF'
P value = 0.00029 (Fisher's exact test), Q value = 0.18
Table S15. Gene #66: '14q loss' versus Molecular Subtype #8: 'MIRSEQ_MATURE_CHIERARCHICAL'
| nPatients | CLUS_1 | CLUS_2 | CLUS_3 |
|---|---|---|---|
| ALL | 40 | 10 | 75 |
| 14Q LOSS MUTATED | 20 | 1 | 11 |
| 14Q LOSS WILD-TYPE | 20 | 9 | 64 |
Figure S15. Get High-res Image Gene #66: '14q loss' versus Molecular Subtype #8: 'MIRSEQ_MATURE_CHIERARCHICAL'

P value = 0.00016 (Fisher's exact test), Q value = 0.1
Table S16. Gene #68: '16p loss' versus Molecular Subtype #7: 'MIRSEQ_MATURE_CNMF'
| nPatients | CLUS_1 | CLUS_2 | CLUS_3 |
|---|---|---|---|
| ALL | 45 | 64 | 16 |
| 16P LOSS MUTATED | 21 | 7 | 3 |
| 16P LOSS WILD-TYPE | 24 | 57 | 13 |
Figure S16. Get High-res Image Gene #68: '16p loss' versus Molecular Subtype #7: 'MIRSEQ_MATURE_CNMF'

P value = 3e-05 (Fisher's exact test), Q value = 0.019
Table S17. Gene #68: '16p loss' versus Molecular Subtype #8: 'MIRSEQ_MATURE_CHIERARCHICAL'
| nPatients | CLUS_1 | CLUS_2 | CLUS_3 |
|---|---|---|---|
| ALL | 40 | 10 | 75 |
| 16P LOSS MUTATED | 20 | 2 | 9 |
| 16P LOSS WILD-TYPE | 20 | 8 | 66 |
Figure S17. Get High-res Image Gene #68: '16p loss' versus Molecular Subtype #8: 'MIRSEQ_MATURE_CHIERARCHICAL'
P value = 4e-05 (Fisher's exact test), Q value = 0.025
Table S18. Gene #69: '16q loss' versus Molecular Subtype #1: 'CN_CNMF'
| nPatients | CLUS_1 | CLUS_2 | CLUS_3 |
|---|---|---|---|
| ALL | 42 | 52 | 32 |
| 16Q LOSS MUTATED | 14 | 4 | 16 |
| 16Q LOSS WILD-TYPE | 28 | 48 | 16 |
Figure S18. Get High-res Image Gene #69: '16q loss' versus Molecular Subtype #1: 'CN_CNMF'
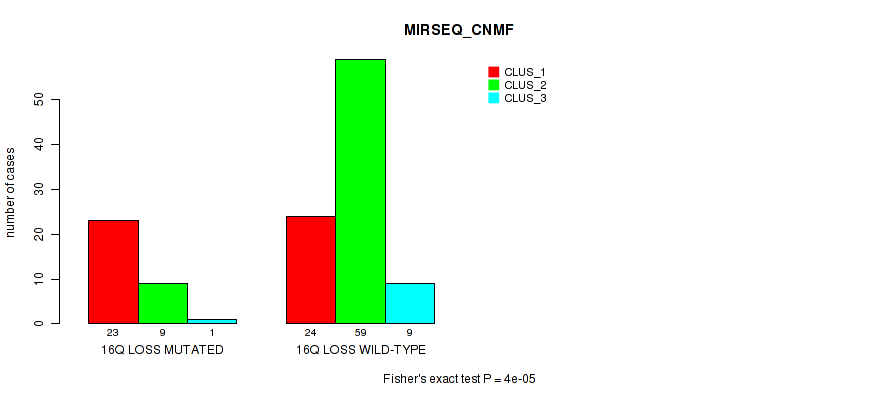
P value = 4e-05 (Fisher's exact test), Q value = 0.025
Table S19. Gene #69: '16q loss' versus Molecular Subtype #5: 'MIRSEQ_CNMF'
| nPatients | CLUS_1 | CLUS_2 | CLUS_3 |
|---|---|---|---|
| ALL | 47 | 68 | 10 |
| 16Q LOSS MUTATED | 23 | 9 | 1 |
| 16Q LOSS WILD-TYPE | 24 | 59 | 9 |
Figure S19. Get High-res Image Gene #69: '16q loss' versus Molecular Subtype #5: 'MIRSEQ_CNMF'
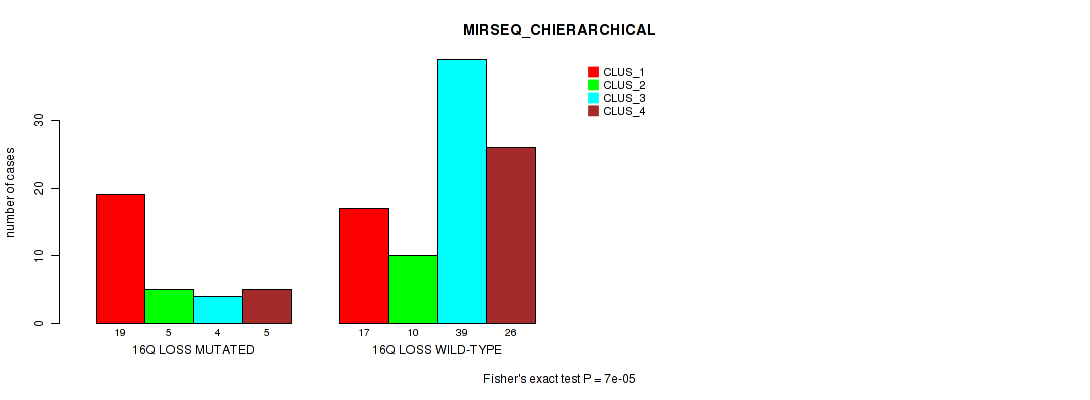
P value = 7e-05 (Fisher's exact test), Q value = 0.044
Table S20. Gene #69: '16q loss' versus Molecular Subtype #6: 'MIRSEQ_CHIERARCHICAL'
| nPatients | CLUS_1 | CLUS_2 | CLUS_3 | CLUS_4 |
|---|---|---|---|---|
| ALL | 36 | 15 | 43 | 31 |
| 16Q LOSS MUTATED | 19 | 5 | 4 | 5 |
| 16Q LOSS WILD-TYPE | 17 | 10 | 39 | 26 |
Figure S20. Get High-res Image Gene #69: '16q loss' versus Molecular Subtype #6: 'MIRSEQ_CHIERARCHICAL'
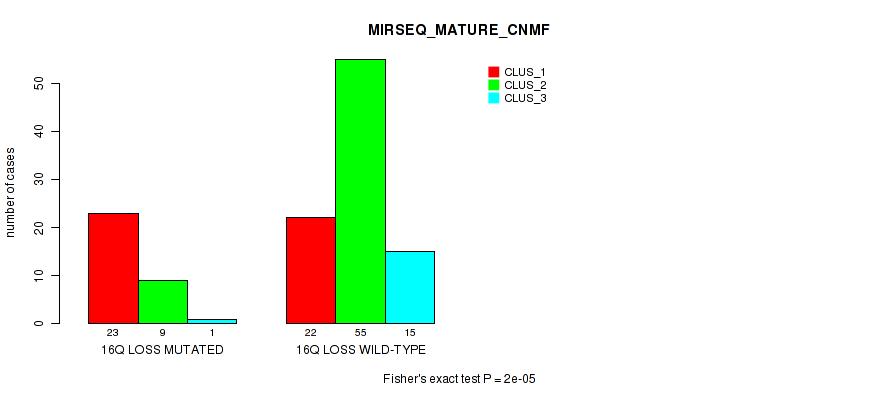
P value = 2e-05 (Fisher's exact test), Q value = 0.013
Table S21. Gene #69: '16q loss' versus Molecular Subtype #7: 'MIRSEQ_MATURE_CNMF'
| nPatients | CLUS_1 | CLUS_2 | CLUS_3 |
|---|---|---|---|
| ALL | 45 | 64 | 16 |
| 16Q LOSS MUTATED | 23 | 9 | 1 |
| 16Q LOSS WILD-TYPE | 22 | 55 | 15 |
Figure S21. Get High-res Image Gene #69: '16q loss' versus Molecular Subtype #7: 'MIRSEQ_MATURE_CNMF'
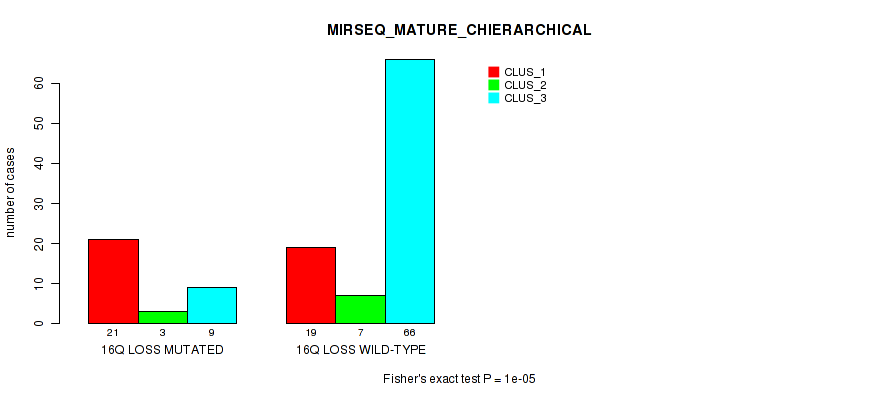
P value = 1e-05 (Fisher's exact test), Q value = 0.0064
Table S22. Gene #69: '16q loss' versus Molecular Subtype #8: 'MIRSEQ_MATURE_CHIERARCHICAL'
| nPatients | CLUS_1 | CLUS_2 | CLUS_3 |
|---|---|---|---|
| ALL | 40 | 10 | 75 |
| 16Q LOSS MUTATED | 21 | 3 | 9 |
| 16Q LOSS WILD-TYPE | 19 | 7 | 66 |
Figure S22. Get High-res Image Gene #69: '16q loss' versus Molecular Subtype #8: 'MIRSEQ_MATURE_CHIERARCHICAL'
-
Copy number data file = transformed.cor.cli.txt
-
Molecular subtypes file = ESCA-TP.transferedmergedcluster.txt
-
Number of patients = 126
-
Number of significantly arm-level cnvs = 80
-
Number of molecular subtypes = 8
-
Exclude genes that fewer than K tumors have mutations, K = 3
For binary or multi-class clinical features (nominal or ordinal), two-tailed Fisher's exact tests (Fisher 1922) were used to estimate the P values using the 'fisher.test' function in R
For multiple hypothesis correction, Q value is the False Discovery Rate (FDR) analogue of the P value (Benjamini and Hochberg 1995), defined as the minimum FDR at which the test may be called significant. We used the 'Benjamini and Hochberg' method of 'p.adjust' function in R to convert P values into Q values.
In addition to the links below, the full results of the analysis summarized in this report can also be downloaded programmatically using firehose_get, or interactively from either the Broad GDAC website or TCGA Data Coordination Center Portal.