This pipeline computes the correlation between significant arm-level copy number variations (cnvs) and selected clinical features.
Testing the association between copy number variation 80 arm-level events and 9 clinical features across 105 patients, one significant finding detected with Q value < 0.25.
-
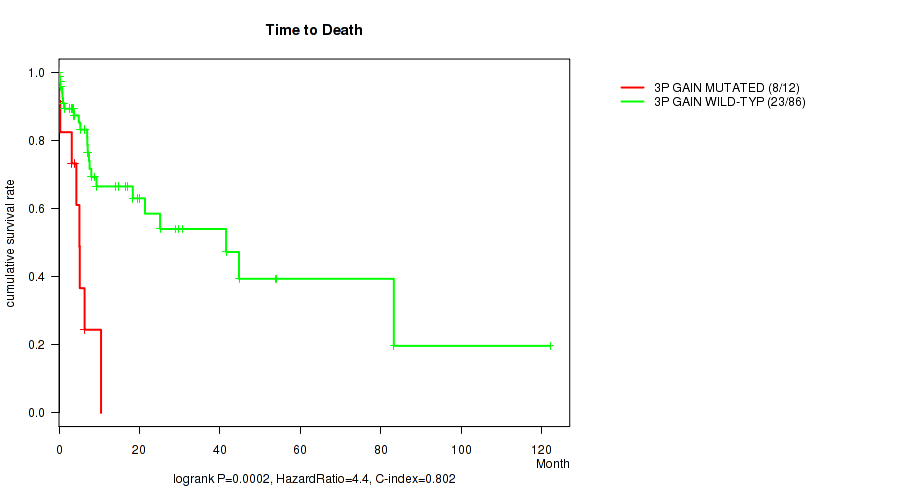
3p gain cnv correlated to 'Time to Death'.
Table 1. Get Full Table Overview of the association between significant copy number variation of 80 arm-level events and 9 clinical features. Shown in the table are P values (Q values). Thresholded by Q value < 0.25, one significant finding detected.
|
Clinical Features |
Time to Death |
AGE |
NEOPLASM DISEASESTAGE |
PATHOLOGY T STAGE |
PATHOLOGY N STAGE |
PATHOLOGY M STAGE |
GENDER | NUMBERPACKYEARSSMOKED | RACE | ||
| nCNV (%) | nWild-Type | logrank test | Wilcoxon-test | Fisher's exact test | Fisher's exact test | Fisher's exact test | Fisher's exact test | Fisher's exact test | Wilcoxon-test | Fisher's exact test | |
| 3p gain | 13 (12%) | 92 |
0.0002 (0.144) |
0.186 (1.00) |
0.256 (1.00) |
0.91 (1.00) |
0.729 (1.00) |
0.432 (1.00) |
1 (1.00) |
0.13 (1.00) |
0.534 (1.00) |
| 1p gain | 17 (16%) | 88 |
0.607 (1.00) |
0.166 (1.00) |
0.595 (1.00) |
0.369 (1.00) |
0.718 (1.00) |
1 (1.00) |
1 (1.00) |
0.3 (1.00) |
1 (1.00) |
| 1q gain | 32 (30%) | 73 |
0.553 (1.00) |
0.195 (1.00) |
0.991 (1.00) |
0.54 (1.00) |
0.951 (1.00) |
0.674 (1.00) |
0.545 (1.00) |
0.747 (1.00) |
0.822 (1.00) |
| 2p gain | 38 (36%) | 67 |
0.191 (1.00) |
0.0383 (1.00) |
0.146 (1.00) |
0.732 (1.00) |
1 (1.00) |
0.557 (1.00) |
0.246 (1.00) |
0.126 (1.00) |
0.196 (1.00) |
| 2q gain | 27 (26%) | 78 |
0.804 (1.00) |
0.0546 (1.00) |
0.318 (1.00) |
0.595 (1.00) |
1 (1.00) |
0.613 (1.00) |
0.344 (1.00) |
0.698 (1.00) |
0.64 (1.00) |
| 3q gain | 41 (39%) | 64 |
0.193 (1.00) |
0.00691 (1.00) |
0.814 (1.00) |
0.167 (1.00) |
0.685 (1.00) |
1 (1.00) |
0.778 (1.00) |
0.62 (1.00) |
0.398 (1.00) |
| 4p gain | 8 (8%) | 97 |
0.232 (1.00) |
0.837 (1.00) |
0.806 (1.00) |
0.729 (1.00) |
0.711 (1.00) |
1 (1.00) |
0.598 (1.00) |
0.476 (1.00) |
0.711 (1.00) |
| 4q gain | 6 (6%) | 99 |
0.453 (1.00) |
0.525 (1.00) |
0.649 (1.00) |
0.488 (1.00) |
0.415 (1.00) |
1 (1.00) |
0.59 (1.00) |
0.662 (1.00) |
1 (1.00) |
| 5p gain | 42 (40%) | 63 |
0.68 (1.00) |
0.678 (1.00) |
0.0193 (1.00) |
0.672 (1.00) |
0.831 (1.00) |
0.113 (1.00) |
0.582 (1.00) |
0.824 (1.00) |
0.672 (1.00) |
| 5q gain | 16 (15%) | 89 |
0.49 (1.00) |
0.171 (1.00) |
0.0447 (1.00) |
0.742 (1.00) |
0.0508 (1.00) |
0.355 (1.00) |
0.697 (1.00) |
0.992 (1.00) |
1 (1.00) |
| 6p gain | 21 (20%) | 84 |
0.195 (1.00) |
0.537 (1.00) |
0.443 (1.00) |
1 (1.00) |
0.349 (1.00) |
1 (1.00) |
0.494 (1.00) |
1 (1.00) |
0.798 (1.00) |
| 6q gain | 17 (16%) | 88 |
0.2 (1.00) |
0.774 (1.00) |
0.0722 (1.00) |
0.649 (1.00) |
0.123 (1.00) |
0.757 (1.00) |
1 (1.00) |
0.909 (1.00) |
1 (1.00) |
| 7p gain | 62 (59%) | 43 |
0.238 (1.00) |
0.5 (1.00) |
0.238 (1.00) |
0.534 (1.00) |
0.111 (1.00) |
0.88 (1.00) |
0.155 (1.00) |
0.701 (1.00) |
0.832 (1.00) |
| 7q gain | 48 (46%) | 57 |
0.591 (1.00) |
0.514 (1.00) |
0.452 (1.00) |
0.138 (1.00) |
0.665 (1.00) |
0.256 (1.00) |
0.162 (1.00) |
0.735 (1.00) |
0.677 (1.00) |
| 8p gain | 40 (38%) | 65 |
0.157 (1.00) |
0.348 (1.00) |
0.593 (1.00) |
0.0657 (1.00) |
0.758 (1.00) |
0.442 (1.00) |
1 (1.00) |
0.893 (1.00) |
0.529 (1.00) |
| 8q gain | 56 (53%) | 49 |
0.237 (1.00) |
0.308 (1.00) |
0.671 (1.00) |
0.208 (1.00) |
0.839 (1.00) |
0.882 (1.00) |
0.281 (1.00) |
0.344 (1.00) |
0.294 (1.00) |
| 9p gain | 8 (8%) | 97 |
0.215 (1.00) |
0.976 (1.00) |
0.388 (1.00) |
0.168 (1.00) |
0.0396 (1.00) |
0.652 (1.00) |
0.598 (1.00) |
0.557 (1.00) |
0.443 (1.00) |
| 9q gain | 19 (18%) | 86 |
0.1 (1.00) |
0.816 (1.00) |
0.139 (1.00) |
0.0555 (1.00) |
0.16 (1.00) |
1 (1.00) |
0.0672 (1.00) |
0.174 (1.00) |
0.106 (1.00) |
| 10p gain | 20 (19%) | 85 |
0.539 (1.00) |
0.735 (1.00) |
0.181 (1.00) |
0.67 (1.00) |
0.792 (1.00) |
0.552 (1.00) |
0.293 (1.00) |
0.424 (1.00) |
1 (1.00) |
| 10q gain | 14 (13%) | 91 |
0.501 (1.00) |
0.821 (1.00) |
0.267 (1.00) |
0.772 (1.00) |
0.0703 (1.00) |
0.227 (1.00) |
0.687 (1.00) |
0.0669 (1.00) |
0.766 (1.00) |
| 11p gain | 19 (18%) | 86 |
0.865 (1.00) |
0.164 (1.00) |
0.962 (1.00) |
0.122 (1.00) |
0.3 (1.00) |
1 (1.00) |
0.466 (1.00) |
0.345 (1.00) |
0.592 (1.00) |
| 11q gain | 20 (19%) | 85 |
0.863 (1.00) |
0.0206 (1.00) |
0.709 (1.00) |
0.014 (1.00) |
0.314 (1.00) |
0.759 (1.00) |
1 (1.00) |
0.976 (1.00) |
0.193 (1.00) |
| 12p gain | 36 (34%) | 69 |
0.498 (1.00) |
0.495 (1.00) |
0.108 (1.00) |
0.0552 (1.00) |
0.64 (1.00) |
0.493 (1.00) |
0.0812 (1.00) |
0.41 (1.00) |
0.0281 (1.00) |
| 12q gain | 21 (20%) | 84 |
0.829 (1.00) |
0.712 (1.00) |
0.0616 (1.00) |
0.582 (1.00) |
0.377 (1.00) |
0.24 (1.00) |
0.73 (1.00) |
0.0853 (1.00) |
0.0207 (1.00) |
| 13q gain | 25 (24%) | 80 |
0.84 (1.00) |
0.328 (1.00) |
0.293 (1.00) |
0.231 (1.00) |
0.498 (1.00) |
0.0129 (1.00) |
0.343 (1.00) |
0.181 (1.00) |
0.0796 (1.00) |
| 14q gain | 27 (26%) | 78 |
0.16 (1.00) |
0.118 (1.00) |
0.8 (1.00) |
0.0989 (1.00) |
0.0367 (1.00) |
1 (1.00) |
0.0104 (1.00) |
0.41 (1.00) |
0.101 (1.00) |
| 15q gain | 20 (19%) | 85 |
0.796 (1.00) |
0.313 (1.00) |
0.858 (1.00) |
0.67 (1.00) |
0.793 (1.00) |
0.553 (1.00) |
0.731 (1.00) |
0.0503 (1.00) |
1 (1.00) |
| 16p gain | 22 (21%) | 83 |
0.353 (1.00) |
0.606 (1.00) |
0.00538 (1.00) |
0.0139 (1.00) |
1 (1.00) |
1 (1.00) |
0.0367 (1.00) |
0.765 (1.00) |
0.127 (1.00) |
| 16q gain | 18 (17%) | 87 |
0.429 (1.00) |
0.409 (1.00) |
0.0143 (1.00) |
0.0419 (1.00) |
0.806 (1.00) |
1 (1.00) |
0.0682 (1.00) |
0.871 (1.00) |
0.414 (1.00) |
| 17p gain | 18 (17%) | 87 |
0.173 (1.00) |
0.339 (1.00) |
0.975 (1.00) |
0.384 (1.00) |
0.679 (1.00) |
1 (1.00) |
0.459 (1.00) |
0.249 (1.00) |
0.414 (1.00) |
| 17q gain | 24 (23%) | 81 |
0.351 (1.00) |
0.697 (1.00) |
0.574 (1.00) |
0.138 (1.00) |
0.143 (1.00) |
0.0857 (1.00) |
0.511 (1.00) |
0.0971 (1.00) |
0.808 (1.00) |
| 18p gain | 29 (28%) | 76 |
0.0809 (1.00) |
0.471 (1.00) |
0.631 (1.00) |
0.914 (1.00) |
1 (1.00) |
0.14 (1.00) |
0.756 (1.00) |
0.75 (1.00) |
0.101 (1.00) |
| 18q gain | 15 (14%) | 90 |
0.165 (1.00) |
0.634 (1.00) |
0.21 (1.00) |
0.641 (1.00) |
1 (1.00) |
0.114 (1.00) |
1 (1.00) |
0.599 (1.00) |
0.766 (1.00) |
| 19p gain | 13 (12%) | 92 |
0.844 (1.00) |
0.533 (1.00) |
0.53 (1.00) |
0.575 (1.00) |
0.00752 (1.00) |
0.43 (1.00) |
0.206 (1.00) |
0.602 (1.00) |
0.763 (1.00) |
| 19q gain | 19 (18%) | 86 |
0.887 (1.00) |
0.529 (1.00) |
0.107 (1.00) |
0.872 (1.00) |
0.00324 (1.00) |
0.332 (1.00) |
0.0672 (1.00) |
0.689 (1.00) |
0.438 (1.00) |
| 20p gain | 54 (51%) | 51 |
0.251 (1.00) |
0.386 (1.00) |
0.809 (1.00) |
0.792 (1.00) |
0.445 (1.00) |
0.484 (1.00) |
0.784 (1.00) |
0.561 (1.00) |
0.218 (1.00) |
| 20q gain | 61 (58%) | 44 |
0.254 (1.00) |
0.193 (1.00) |
0.897 (1.00) |
0.114 (1.00) |
0.212 (1.00) |
0.576 (1.00) |
0.78 (1.00) |
0.782 (1.00) |
0.089 (1.00) |
| 21q gain | 8 (8%) | 97 |
0.745 (1.00) |
0.62 (1.00) |
0.728 (1.00) |
0.545 (1.00) |
1 (1.00) |
1 (1.00) |
0.598 (1.00) |
0.219 (1.00) |
0.121 (1.00) |
| 22q gain | 19 (18%) | 86 |
0.822 (1.00) |
0.285 (1.00) |
0.924 (1.00) |
0.43 (1.00) |
0.0436 (1.00) |
0.779 (1.00) |
1 (1.00) |
0.689 (1.00) |
0.0304 (1.00) |
| xq gain | 22 (21%) | 83 |
0.952 (1.00) |
0.984 (1.00) |
0.805 (1.00) |
0.319 (1.00) |
0.282 (1.00) |
0.628 (1.00) |
0.0367 (1.00) |
0.714 (1.00) |
0.127 (1.00) |
| 1p loss | 22 (21%) | 83 |
0.907 (1.00) |
0.859 (1.00) |
0.347 (1.00) |
0.732 (1.00) |
0.931 (1.00) |
0.189 (1.00) |
0.3 (1.00) |
0.534 (1.00) |
0.123 (1.00) |
| 1q loss | 14 (13%) | 91 |
0.134 (1.00) |
0.415 (1.00) |
0.205 (1.00) |
0.676 (1.00) |
0.178 (1.00) |
0.066 (1.00) |
0.418 (1.00) |
0.32 (1.00) |
0.534 (1.00) |
| 2p loss | 5 (5%) | 100 |
0.216 (1.00) |
0.306 (1.00) |
0.679 (1.00) |
0.262 (1.00) |
0.413 (1.00) |
0.607 (1.00) |
0.545 (1.00) |
0.961 (1.00) |
1 (1.00) |
| 2q loss | 13 (12%) | 92 |
0.452 (1.00) |
0.405 (1.00) |
0.879 (1.00) |
0.417 (1.00) |
0.215 (1.00) |
0.241 (1.00) |
1 (1.00) |
0.167 (1.00) |
0.763 (1.00) |
| 3p loss | 54 (51%) | 51 |
0.299 (1.00) |
0.501 (1.00) |
0.325 (1.00) |
0.494 (1.00) |
0.118 (1.00) |
0.115 (1.00) |
0.268 (1.00) |
0.249 (1.00) |
0.00321 (1.00) |
| 3q loss | 14 (13%) | 91 |
0.853 (1.00) |
0.215 (1.00) |
0.318 (1.00) |
0.343 (1.00) |
0.708 (1.00) |
0.249 (1.00) |
1 (1.00) |
0.1 (1.00) |
0.232 (1.00) |
| 4p loss | 59 (56%) | 46 |
0.0619 (1.00) |
0.25 (1.00) |
0.922 (1.00) |
0.0439 (1.00) |
0.767 (1.00) |
0.0219 (1.00) |
1 (1.00) |
0.337 (1.00) |
0.0352 (1.00) |
| 4q loss | 55 (52%) | 50 |
0.195 (1.00) |
0.164 (1.00) |
0.409 (1.00) |
0.132 (1.00) |
0.703 (1.00) |
0.49 (1.00) |
1 (1.00) |
0.553 (1.00) |
0.535 (1.00) |
| 5p loss | 28 (27%) | 77 |
0.21 (1.00) |
0.648 (1.00) |
0.0137 (1.00) |
0.153 (1.00) |
0.712 (1.00) |
0.506 (1.00) |
0.538 (1.00) |
0.875 (1.00) |
0.639 (1.00) |
| 5q loss | 44 (42%) | 61 |
0.431 (1.00) |
0.497 (1.00) |
0.0626 (1.00) |
0.251 (1.00) |
0.794 (1.00) |
0.65 (1.00) |
0.401 (1.00) |
0.809 (1.00) |
0.835 (1.00) |
| 6p loss | 21 (20%) | 84 |
0.304 (1.00) |
0.0878 (1.00) |
0.941 (1.00) |
0.752 (1.00) |
0.258 (1.00) |
0.462 (1.00) |
1 (1.00) |
0.814 (1.00) |
0.303 (1.00) |
| 6q loss | 21 (20%) | 84 |
0.0772 (1.00) |
0.577 (1.00) |
0.845 (1.00) |
0.583 (1.00) |
0.307 (1.00) |
0.44 (1.00) |
0.73 (1.00) |
0.82 (1.00) |
0.303 (1.00) |
| 7p loss | 8 (8%) | 97 |
0.903 (1.00) |
0.172 (1.00) |
0.653 (1.00) |
1 (1.00) |
0.31 (1.00) |
0.627 (1.00) |
0.0856 (1.00) |
0.276 (1.00) |
0.443 (1.00) |
| 7q loss | 11 (10%) | 94 |
0.672 (1.00) |
0.283 (1.00) |
0.446 (1.00) |
0.0459 (1.00) |
0.518 (1.00) |
0.291 (1.00) |
1 (1.00) |
0.139 (1.00) |
0.0908 (1.00) |
| 8p loss | 32 (30%) | 73 |
0.692 (1.00) |
0.676 (1.00) |
0.268 (1.00) |
0.738 (1.00) |
0.266 (1.00) |
0.159 (1.00) |
0.545 (1.00) |
0.367 (1.00) |
0.652 (1.00) |
| 8q loss | 10 (10%) | 95 |
0.173 (1.00) |
0.996 (1.00) |
0.31 (1.00) |
0.0586 (1.00) |
0.79 (1.00) |
0.41 (1.00) |
1 (1.00) |
0.285 (1.00) |
0.309 (1.00) |
| 9p loss | 57 (54%) | 48 |
0.855 (1.00) |
0.243 (1.00) |
0.837 (1.00) |
0.159 (1.00) |
0.375 (1.00) |
0.213 (1.00) |
0.271 (1.00) |
0.989 (1.00) |
0.00668 (1.00) |
| 9q loss | 36 (34%) | 69 |
0.241 (1.00) |
0.589 (1.00) |
0.288 (1.00) |
0.097 (1.00) |
0.777 (1.00) |
0.843 (1.00) |
0.571 (1.00) |
0.638 (1.00) |
0.124 (1.00) |
| 10p loss | 24 (23%) | 81 |
0.551 (1.00) |
0.708 (1.00) |
0.563 (1.00) |
0.282 (1.00) |
0.229 (1.00) |
0.156 (1.00) |
0.743 (1.00) |
0.438 (1.00) |
0.613 (1.00) |
| 10q loss | 29 (28%) | 76 |
0.789 (1.00) |
0.403 (1.00) |
0.377 (1.00) |
0.0663 (1.00) |
1 (1.00) |
0.00314 (1.00) |
1 (1.00) |
0.87 (1.00) |
0.0192 (1.00) |
| 11p loss | 31 (30%) | 74 |
0.31 (1.00) |
0.584 (1.00) |
0.0225 (1.00) |
0.513 (1.00) |
0.853 (1.00) |
0.557 (1.00) |
0.544 (1.00) |
0.798 (1.00) |
0.367 (1.00) |
| 11q loss | 32 (30%) | 73 |
0.784 (1.00) |
0.336 (1.00) |
0.13 (1.00) |
0.608 (1.00) |
0.369 (1.00) |
0.681 (1.00) |
1 (1.00) |
0.529 (1.00) |
0.261 (1.00) |
| 12p loss | 19 (18%) | 86 |
0.775 (1.00) |
0.412 (1.00) |
0.533 (1.00) |
0.731 (1.00) |
0.316 (1.00) |
0.593 (1.00) |
0.028 (1.00) |
0.111 (1.00) |
0.162 (1.00) |
| 12q loss | 15 (14%) | 90 |
0.529 (1.00) |
0.237 (1.00) |
0.17 (1.00) |
0.587 (1.00) |
0.5 (1.00) |
0.745 (1.00) |
0.00734 (1.00) |
0.0959 (1.00) |
0.031 (1.00) |
| 13q loss | 40 (38%) | 65 |
0.473 (1.00) |
0.106 (1.00) |
0.89 (1.00) |
0.783 (1.00) |
0.757 (1.00) |
0.0537 (1.00) |
0.156 (1.00) |
0.807 (1.00) |
0.00292 (1.00) |
| 14q loss | 27 (26%) | 78 |
0.598 (1.00) |
0.133 (1.00) |
0.0633 (1.00) |
0.267 (1.00) |
0.216 (1.00) |
0.804 (1.00) |
0.527 (1.00) |
0.371 (1.00) |
0.141 (1.00) |
| 15q loss | 26 (25%) | 79 |
0.848 (1.00) |
0.691 (1.00) |
0.578 (1.00) |
0.632 (1.00) |
0.556 (1.00) |
0.155 (1.00) |
0.518 (1.00) |
0.771 (1.00) |
0.476 (1.00) |
| 16p loss | 30 (29%) | 75 |
0.988 (1.00) |
0.804 (1.00) |
0.421 (1.00) |
0.011 (1.00) |
0.8 (1.00) |
0.275 (1.00) |
0.123 (1.00) |
0.174 (1.00) |
0.175 (1.00) |
| 16q loss | 30 (29%) | 75 |
0.746 (1.00) |
0.573 (1.00) |
0.297 (1.00) |
0.0821 (1.00) |
0.713 (1.00) |
0.214 (1.00) |
0.123 (1.00) |
0.237 (1.00) |
0.0356 (1.00) |
| 17p loss | 39 (37%) | 66 |
0.586 (1.00) |
0.231 (1.00) |
0.209 (1.00) |
0.477 (1.00) |
0.683 (1.00) |
0.516 (1.00) |
0.782 (1.00) |
0.887 (1.00) |
0.0505 (1.00) |
| 17q loss | 12 (11%) | 93 |
0.129 (1.00) |
0.0737 (1.00) |
0.0754 (1.00) |
0.363 (1.00) |
0.897 (1.00) |
1 (1.00) |
0.68 (1.00) |
0.102 (1.00) |
1 (1.00) |
| 18p loss | 37 (35%) | 68 |
0.607 (1.00) |
0.251 (1.00) |
0.84 (1.00) |
0.233 (1.00) |
0.282 (1.00) |
0.693 (1.00) |
0.772 (1.00) |
0.0535 (1.00) |
0.0798 (1.00) |
| 18q loss | 53 (50%) | 52 |
0.845 (1.00) |
0.177 (1.00) |
0.966 (1.00) |
0.481 (1.00) |
0.262 (1.00) |
1 (1.00) |
1 (1.00) |
0.334 (1.00) |
0.836 (1.00) |
| 19p loss | 34 (32%) | 71 |
0.592 (1.00) |
0.792 (1.00) |
0.669 (1.00) |
0.639 (1.00) |
0.436 (1.00) |
0.567 (1.00) |
0.769 (1.00) |
0.401 (1.00) |
0.187 (1.00) |
| 19q loss | 26 (25%) | 79 |
0.325 (1.00) |
0.688 (1.00) |
0.818 (1.00) |
0.489 (1.00) |
0.114 (1.00) |
0.813 (1.00) |
1 (1.00) |
0.489 (1.00) |
0.0927 (1.00) |
| 20p loss | 15 (14%) | 90 |
0.0233 (1.00) |
0.993 (1.00) |
0.807 (1.00) |
0.403 (1.00) |
0.777 (1.00) |
1 (1.00) |
1 (1.00) |
0.672 (1.00) |
0.232 (1.00) |
| 20q loss | 6 (6%) | 99 |
0.217 (1.00) |
0.836 (1.00) |
0.284 (1.00) |
0.102 (1.00) |
0.241 (1.00) |
0.307 (1.00) |
1 (1.00) |
0.48 (1.00) |
1 (1.00) |
| 21q loss | 61 (58%) | 44 |
0.335 (1.00) |
0.145 (1.00) |
0.258 (1.00) |
0.516 (1.00) |
0.835 (1.00) |
1 (1.00) |
0.0898 (1.00) |
0.00915 (1.00) |
0.0946 (1.00) |
| 22q loss | 39 (37%) | 66 |
0.61 (1.00) |
0.773 (1.00) |
0.626 (1.00) |
0.366 (1.00) |
0.315 (1.00) |
0.136 (1.00) |
0.406 (1.00) |
0.696 (1.00) |
1 (1.00) |
| xq loss | 24 (23%) | 81 |
0.966 (1.00) |
0.255 (1.00) |
0.708 (1.00) |
0.0686 (1.00) |
0.648 (1.00) |
0.615 (1.00) |
0.511 (1.00) |
0.0219 (1.00) |
0.143 (1.00) |
P value = 2e-04 (logrank test), Q value = 0.14
Table S1. Gene #5: '3p gain' versus Clinical Feature #1: 'Time to Death'
| nPatients | nDeath | Duration Range (Median), Month | |
|---|---|---|---|
| ALL | 98 | 31 | 0.0 - 122.1 (4.2) |
| 3P GAIN MUTATED | 12 | 8 | 0.0 - 10.4 (4.2) |
| 3P GAIN WILD-TYPE | 86 | 23 | 0.1 - 122.1 (4.3) |
Figure S1. Get High-res Image Gene #5: '3p gain' versus Clinical Feature #1: 'Time to Death'
-
Copy number data file = transformed.cor.cli.txt
-
Clinical data file = ESCA-TP.merged_data.txt
-
Number of patients = 105
-
Number of significantly arm-level cnvs = 80
-
Number of selected clinical features = 9
-
Exclude regions that fewer than K tumors have mutations, K = 3
For survival clinical features, the Kaplan-Meier survival curves of tumors with and without gene mutations were plotted and the statistical significance P values were estimated by logrank test (Bland and Altman 2004) using the 'survdiff' function in R
For binary or multi-class clinical features (nominal or ordinal), two-tailed Fisher's exact tests (Fisher 1922) were used to estimate the P values using the 'fisher.test' function in R
For multiple hypothesis correction, Q value is the False Discovery Rate (FDR) analogue of the P value (Benjamini and Hochberg 1995), defined as the minimum FDR at which the test may be called significant. We used the 'Benjamini and Hochberg' method of 'p.adjust' function in R to convert P values into Q values.
In addition to the links below, the full results of the analysis summarized in this report can also be downloaded programmatically using firehose_get, or interactively from either the Broad GDAC website or TCGA Data Coordination Center Portal.