This pipeline computes the correlation between significant arm-level copy number variations (cnvs) and selected clinical features.
Testing the association between copy number variation 80 arm-level events and 8 clinical features across 560 patients, 10 significant findings detected with Q value < 0.25.
-
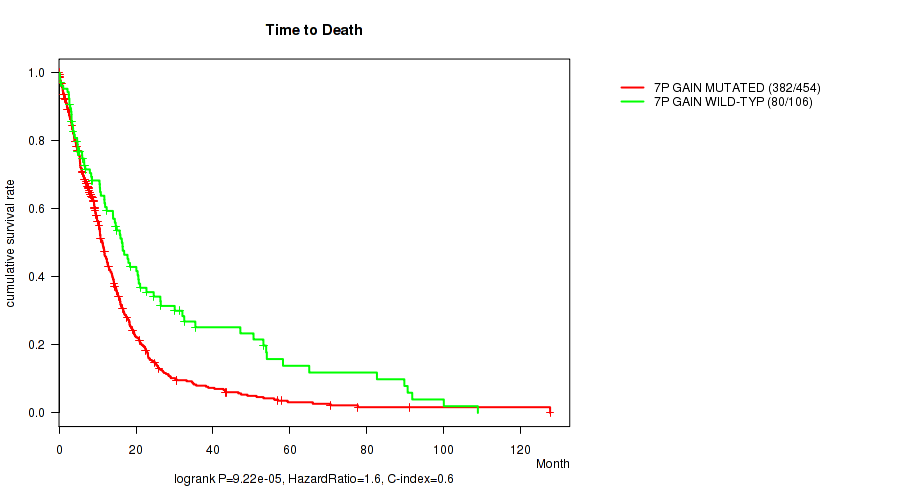
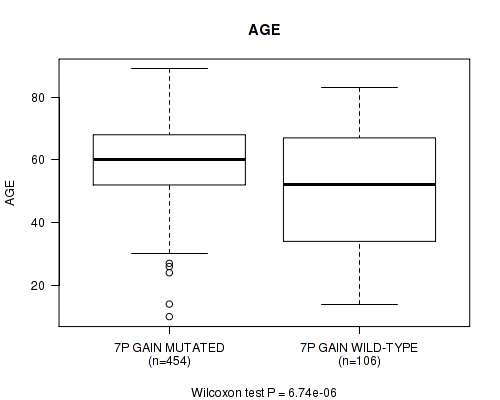
7p gain cnv correlated to 'Time to Death' and 'AGE'.
-
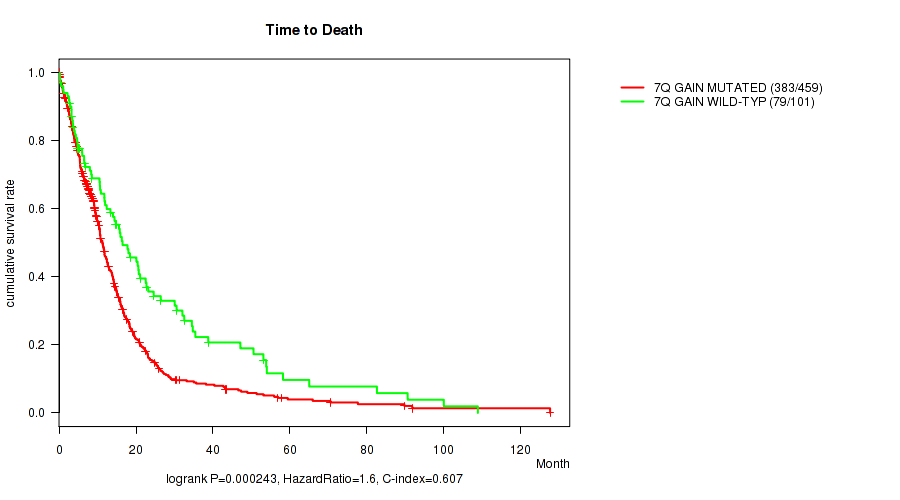
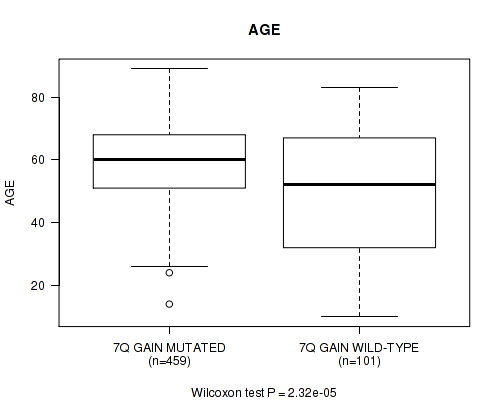
7q gain cnv correlated to 'Time to Death' and 'AGE'.
-
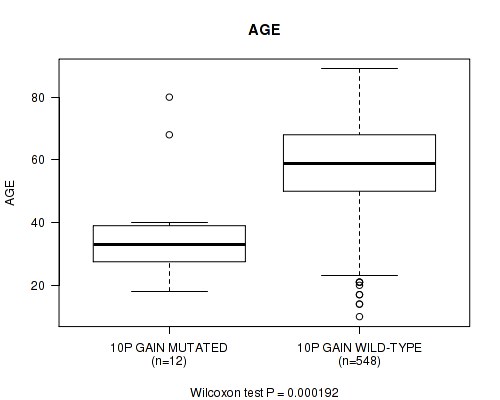
10p gain cnv correlated to 'AGE'.
-
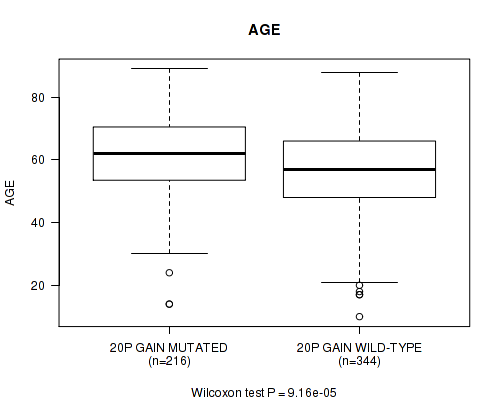
20p gain cnv correlated to 'AGE'.
-
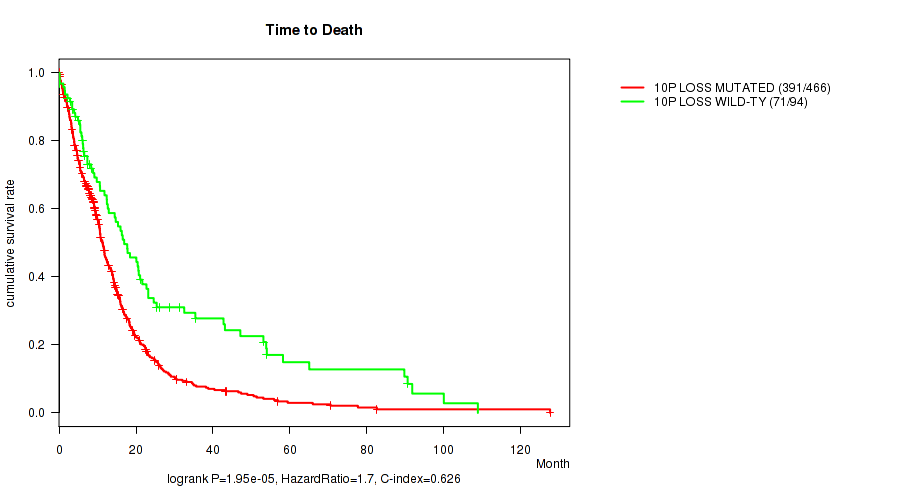
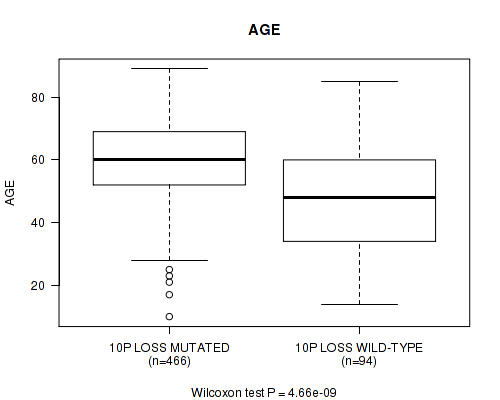
10p loss cnv correlated to 'Time to Death' and 'AGE'.
-
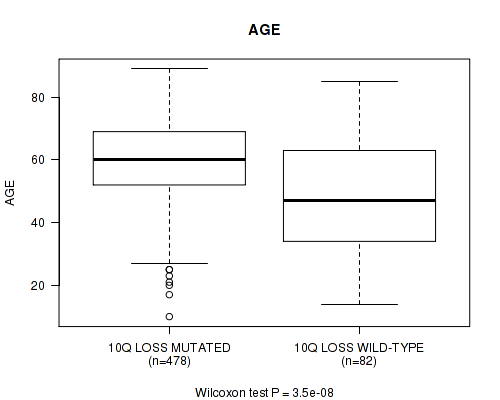
10q loss cnv correlated to 'Time to Death' and 'AGE'.
Table 1. Get Full Table Overview of the association between significant copy number variation of 80 arm-level events and 8 clinical features. Shown in the table are P values (Q values). Thresholded by Q value < 0.25, 10 significant findings detected.
|
Clinical Features |
Time to Death |
AGE | GENDER |
KARNOFSKY PERFORMANCE SCORE |
HISTOLOGICAL TYPE |
RADIATIONS RADIATION REGIMENINDICATION |
RACE | ETHNICITY | ||
| nCNV (%) | nWild-Type | logrank test | Wilcoxon-test | Fisher's exact test | Wilcoxon-test | Fisher's exact test | Fisher's exact test | Fisher's exact test | Fisher's exact test | |
| 7p gain | 454 (81%) | 106 |
9.22e-05 (0.0583) |
6.74e-06 (0.00429) |
1 (1.00) |
0.714 (1.00) |
0.0153 (1.00) |
0.133 (1.00) |
0.0468 (1.00) |
0.27 (1.00) |
| 7q gain | 459 (82%) | 101 |
0.000243 (0.153) |
2.32e-05 (0.0147) |
0.368 (1.00) |
0.899 (1.00) |
0.0265 (1.00) |
0.0995 (1.00) |
0.0304 (1.00) |
0.249 (1.00) |
| 10p loss | 466 (83%) | 94 |
1.95e-05 (0.0124) |
4.66e-09 (2.98e-06) |
0.249 (1.00) |
0.166 (1.00) |
0.00266 (1.00) |
0.716 (1.00) |
0.127 (1.00) |
0.237 (1.00) |
| 10q loss | 478 (85%) | 82 |
6.1e-05 (0.0387) |
3.5e-08 (2.23e-05) |
0.541 (1.00) |
0.0146 (1.00) |
0.0125 (1.00) |
0.61 (1.00) |
0.0749 (1.00) |
0.0931 (1.00) |
| 10p gain | 12 (2%) | 548 |
0.00399 (1.00) |
0.000192 (0.121) |
0.0706 (1.00) |
0.64 (1.00) |
0.542 (1.00) |
1 (1.00) |
0.0226 (1.00) |
0.268 (1.00) |
| 20p gain | 216 (39%) | 344 |
0.543 (1.00) |
9.16e-05 (0.058) |
0.287 (1.00) |
0.492 (1.00) |
0.494 (1.00) |
0.515 (1.00) |
0.0361 (1.00) |
1 (1.00) |
| 1p gain | 81 (14%) | 479 |
0.243 (1.00) |
0.511 (1.00) |
0.624 (1.00) |
0.234 (1.00) |
0.146 (1.00) |
0.368 (1.00) |
0.837 (1.00) |
0.67 (1.00) |
| 1q gain | 87 (16%) | 473 |
0.588 (1.00) |
0.529 (1.00) |
0.403 (1.00) |
0.243 (1.00) |
0.202 (1.00) |
0.383 (1.00) |
0.567 (1.00) |
0.689 (1.00) |
| 2p gain | 36 (6%) | 524 |
0.7 (1.00) |
0.845 (1.00) |
0.111 (1.00) |
0.509 (1.00) |
1 (1.00) |
0.854 (1.00) |
0.135 (1.00) |
1 (1.00) |
| 2q gain | 35 (6%) | 525 |
0.584 (1.00) |
0.345 (1.00) |
0.284 (1.00) |
0.353 (1.00) |
1 (1.00) |
1 (1.00) |
0.124 (1.00) |
1 (1.00) |
| 3p gain | 56 (10%) | 504 |
0.947 (1.00) |
0.0286 (1.00) |
0.391 (1.00) |
0.899 (1.00) |
0.496 (1.00) |
1 (1.00) |
1 (1.00) |
1 (1.00) |
| 3q gain | 61 (11%) | 499 |
0.917 (1.00) |
0.0477 (1.00) |
0.581 (1.00) |
0.837 (1.00) |
0.418 (1.00) |
0.772 (1.00) |
0.457 (1.00) |
1 (1.00) |
| 4p gain | 36 (6%) | 524 |
0.928 (1.00) |
0.466 (1.00) |
0.86 (1.00) |
0.0761 (1.00) |
1 (1.00) |
0.712 (1.00) |
0.406 (1.00) |
0.584 (1.00) |
| 4q gain | 33 (6%) | 527 |
0.94 (1.00) |
0.536 (1.00) |
0.467 (1.00) |
0.0726 (1.00) |
1 (1.00) |
0.441 (1.00) |
0.369 (1.00) |
1 (1.00) |
| 5p gain | 49 (9%) | 511 |
0.854 (1.00) |
0.646 (1.00) |
0.168 (1.00) |
0.21 (1.00) |
0.0383 (1.00) |
0.633 (1.00) |
0.912 (1.00) |
0.308 (1.00) |
| 5q gain | 41 (7%) | 519 |
0.684 (1.00) |
0.56 (1.00) |
0.134 (1.00) |
0.743 (1.00) |
0.052 (1.00) |
0.49 (1.00) |
0.643 (1.00) |
0.612 (1.00) |
| 6p gain | 23 (4%) | 537 |
0.424 (1.00) |
0.707 (1.00) |
0.514 (1.00) |
0.513 (1.00) |
1 (1.00) |
0.171 (1.00) |
0.264 (1.00) |
1 (1.00) |
| 6q gain | 22 (4%) | 538 |
0.371 (1.00) |
0.396 (1.00) |
0.828 (1.00) |
0.475 (1.00) |
1 (1.00) |
0.485 (1.00) |
0.527 (1.00) |
1 (1.00) |
| 8p gain | 52 (9%) | 508 |
0.86 (1.00) |
0.769 (1.00) |
0.657 (1.00) |
0.589 (1.00) |
0.894 (1.00) |
0.642 (1.00) |
0.114 (1.00) |
1 (1.00) |
| 8q gain | 59 (11%) | 501 |
0.451 (1.00) |
0.34 (1.00) |
0.481 (1.00) |
0.691 (1.00) |
0.911 (1.00) |
1 (1.00) |
0.337 (1.00) |
1 (1.00) |
| 9p gain | 47 (8%) | 513 |
0.658 (1.00) |
0.681 (1.00) |
0.163 (1.00) |
0.884 (1.00) |
0.315 (1.00) |
0.745 (1.00) |
0.462 (1.00) |
0.249 (1.00) |
| 9q gain | 71 (13%) | 489 |
0.733 (1.00) |
0.875 (1.00) |
0.195 (1.00) |
0.649 (1.00) |
0.601 (1.00) |
1 (1.00) |
0.63 (1.00) |
0.652 (1.00) |
| 10q gain | 3 (1%) | 557 |
0.481 (1.00) |
0.664 (1.00) |
0.564 (1.00) |
1 (1.00) |
0.238 (1.00) |
1 (1.00) |
0.0742 (1.00) |
|
| 11p gain | 17 (3%) | 543 |
0.584 (1.00) |
0.936 (1.00) |
0.806 (1.00) |
0.377 (1.00) |
1 (1.00) |
0.601 (1.00) |
0.756 (1.00) |
0.341 (1.00) |
| 11q gain | 14 (2%) | 546 |
0.142 (1.00) |
0.111 (1.00) |
0.267 (1.00) |
0.165 (1.00) |
0.601 (1.00) |
0.244 (1.00) |
1 (1.00) |
0.305 (1.00) |
| 12p gain | 58 (10%) | 502 |
0.6 (1.00) |
0.386 (1.00) |
0.571 (1.00) |
0.795 (1.00) |
0.91 (1.00) |
0.552 (1.00) |
0.921 (1.00) |
1 (1.00) |
| 12q gain | 47 (8%) | 513 |
0.983 (1.00) |
0.748 (1.00) |
0.278 (1.00) |
0.944 (1.00) |
0.549 (1.00) |
0.624 (1.00) |
0.133 (1.00) |
0.612 (1.00) |
| 13q gain | 10 (2%) | 550 |
0.551 (1.00) |
0.0115 (1.00) |
0.202 (1.00) |
0.0712 (1.00) |
0.297 (1.00) |
0.0811 (1.00) |
0.644 (1.00) |
1 (1.00) |
| 14q gain | 22 (4%) | 538 |
0.269 (1.00) |
0.0627 (1.00) |
0.513 (1.00) |
0.465 (1.00) |
0.0536 (1.00) |
0.645 (1.00) |
1 (1.00) |
1 (1.00) |
| 15q gain | 24 (4%) | 536 |
0.513 (1.00) |
0.909 (1.00) |
0.527 (1.00) |
0.09 (1.00) |
0.45 (1.00) |
0.177 (1.00) |
1 (1.00) |
1 (1.00) |
| 16p gain | 38 (7%) | 522 |
0.0298 (1.00) |
0.817 (1.00) |
0.306 (1.00) |
0.95 (1.00) |
1 (1.00) |
0.0726 (1.00) |
0.254 (1.00) |
1 (1.00) |
| 16q gain | 37 (7%) | 523 |
0.114 (1.00) |
0.84 (1.00) |
0.606 (1.00) |
0.84 (1.00) |
1 (1.00) |
0.0999 (1.00) |
0.214 (1.00) |
1 (1.00) |
| 17p gain | 47 (8%) | 513 |
0.244 (1.00) |
0.042 (1.00) |
0.212 (1.00) |
0.382 (1.00) |
0.276 (1.00) |
0.329 (1.00) |
0.367 (1.00) |
1 (1.00) |
| 17q gain | 58 (10%) | 502 |
0.0412 (1.00) |
0.0231 (1.00) |
0.479 (1.00) |
0.467 (1.00) |
0.5 (1.00) |
0.299 (1.00) |
0.49 (1.00) |
0.377 (1.00) |
| 18p gain | 57 (10%) | 503 |
0.793 (1.00) |
0.422 (1.00) |
0.669 (1.00) |
0.232 (1.00) |
0.174 (1.00) |
0.881 (1.00) |
0.358 (1.00) |
0.357 (1.00) |
| 18q gain | 57 (10%) | 503 |
0.946 (1.00) |
0.25 (1.00) |
0.2 (1.00) |
0.235 (1.00) |
0.174 (1.00) |
0.653 (1.00) |
0.569 (1.00) |
1 (1.00) |
| 19p gain | 218 (39%) | 342 |
0.42 (1.00) |
0.831 (1.00) |
0.859 (1.00) |
0.909 (1.00) |
0.337 (1.00) |
0.71 (1.00) |
0.595 (1.00) |
0.551 (1.00) |
| 19q gain | 193 (34%) | 367 |
0.447 (1.00) |
0.655 (1.00) |
0.716 (1.00) |
0.945 (1.00) |
0.923 (1.00) |
0.634 (1.00) |
0.333 (1.00) |
0.357 (1.00) |
| 20q gain | 214 (38%) | 346 |
0.734 (1.00) |
0.000431 (0.271) |
0.247 (1.00) |
0.669 (1.00) |
0.476 (1.00) |
0.513 (1.00) |
0.0499 (1.00) |
1 (1.00) |
| 21q gain | 62 (11%) | 498 |
0.564 (1.00) |
0.119 (1.00) |
1 (1.00) |
0.128 (1.00) |
0.0515 (1.00) |
1 (1.00) |
0.0967 (1.00) |
0.376 (1.00) |
| 22q gain | 34 (6%) | 526 |
0.44 (1.00) |
0.601 (1.00) |
1 (1.00) |
0.318 (1.00) |
0.599 (1.00) |
1 (1.00) |
0.59 (1.00) |
0.154 (1.00) |
| xq gain | 16 (3%) | 544 |
0.867 (1.00) |
0.541 (1.00) |
1 (1.00) |
0.621 (1.00) |
0.262 (1.00) |
0.17 (1.00) |
0.726 (1.00) |
0.248 (1.00) |
| 1p loss | 15 (3%) | 545 |
0.272 (1.00) |
0.0548 (1.00) |
0.424 (1.00) |
0.817 (1.00) |
0.626 (1.00) |
0.575 (1.00) |
0.73 (1.00) |
1 (1.00) |
| 1q loss | 14 (2%) | 546 |
0.537 (1.00) |
0.0281 (1.00) |
1 (1.00) |
0.17 (1.00) |
1 (1.00) |
0.39 (1.00) |
1 (1.00) |
1 (1.00) |
| 2p loss | 32 (6%) | 528 |
0.756 (1.00) |
0.0863 (1.00) |
0.135 (1.00) |
0.865 (1.00) |
1 (1.00) |
0.17 (1.00) |
0.671 (1.00) |
1 (1.00) |
| 2q loss | 32 (6%) | 528 |
0.932 (1.00) |
0.115 (1.00) |
0.263 (1.00) |
0.596 (1.00) |
0.313 (1.00) |
0.0771 (1.00) |
0.671 (1.00) |
1 (1.00) |
| 3p loss | 40 (7%) | 520 |
0.273 (1.00) |
0.0617 (1.00) |
1 (1.00) |
0.987 (1.00) |
0.287 (1.00) |
0.113 (1.00) |
0.566 (1.00) |
0.21 (1.00) |
| 3q loss | 34 (6%) | 526 |
0.739 (1.00) |
0.621 (1.00) |
0.589 (1.00) |
0.643 (1.00) |
0.415 (1.00) |
0.572 (1.00) |
0.686 (1.00) |
0.523 (1.00) |
| 4p loss | 53 (9%) | 507 |
0.718 (1.00) |
0.694 (1.00) |
0.184 (1.00) |
0.252 (1.00) |
0.526 (1.00) |
0.643 (1.00) |
0.609 (1.00) |
0.308 (1.00) |
| 4q loss | 53 (9%) | 507 |
0.211 (1.00) |
0.17 (1.00) |
0.659 (1.00) |
0.208 (1.00) |
1 (1.00) |
0.643 (1.00) |
0.565 (1.00) |
0.278 (1.00) |
| 5p loss | 42 (8%) | 518 |
0.0515 (1.00) |
0.49 (1.00) |
1 (1.00) |
0.561 (1.00) |
0.772 (1.00) |
0.0373 (1.00) |
0.0851 (1.00) |
0.21 (1.00) |
| 5q loss | 43 (8%) | 517 |
0.1 (1.00) |
0.54 (1.00) |
1 (1.00) |
0.751 (1.00) |
0.325 (1.00) |
0.127 (1.00) |
0.268 (1.00) |
0.0512 (1.00) |
| 6p loss | 86 (15%) | 474 |
0.00594 (1.00) |
0.428 (1.00) |
0.811 (1.00) |
0.503 (1.00) |
0.571 (1.00) |
0.53 (1.00) |
0.207 (1.00) |
0.701 (1.00) |
| 6q loss | 123 (22%) | 437 |
0.354 (1.00) |
0.795 (1.00) |
0.348 (1.00) |
0.618 (1.00) |
0.764 (1.00) |
1 (1.00) |
0.172 (1.00) |
0.478 (1.00) |
| 7p loss | 8 (1%) | 552 |
0.346 (1.00) |
0.0509 (1.00) |
1 (1.00) |
0.744 (1.00) |
1 (1.00) |
0.446 (1.00) |
0.557 (1.00) |
1 (1.00) |
| 7q loss | 6 (1%) | 554 |
0.518 (1.00) |
0.023 (1.00) |
1 (1.00) |
0.304 (1.00) |
1 (1.00) |
0.67 (1.00) |
0.458 (1.00) |
1 (1.00) |
| 8p loss | 58 (10%) | 502 |
0.637 (1.00) |
0.193 (1.00) |
0.156 (1.00) |
0.395 (1.00) |
0.91 (1.00) |
0.552 (1.00) |
0.00787 (1.00) |
0.621 (1.00) |
| 8q loss | 42 (8%) | 518 |
0.217 (1.00) |
0.23 (1.00) |
0.416 (1.00) |
0.248 (1.00) |
1 (1.00) |
1 (1.00) |
0.364 (1.00) |
1 (1.00) |
| 9p loss | 195 (35%) | 365 |
0.605 (1.00) |
0.558 (1.00) |
0.717 (1.00) |
0.631 (1.00) |
0.547 (1.00) |
0.775 (1.00) |
0.358 (1.00) |
0.064 (1.00) |
| 9q loss | 90 (16%) | 470 |
0.551 (1.00) |
0.554 (1.00) |
0.29 (1.00) |
0.594 (1.00) |
0.0953 (1.00) |
1 (1.00) |
0.103 (1.00) |
0.233 (1.00) |
| 11p loss | 97 (17%) | 463 |
0.174 (1.00) |
0.845 (1.00) |
0.0861 (1.00) |
0.675 (1.00) |
0.379 (1.00) |
0.632 (1.00) |
0.663 (1.00) |
0.7 (1.00) |
| 11q loss | 92 (16%) | 468 |
0.883 (1.00) |
0.432 (1.00) |
0.414 (1.00) |
0.685 (1.00) |
1 (1.00) |
0.271 (1.00) |
1 (1.00) |
0.229 (1.00) |
| 12p loss | 59 (11%) | 501 |
0.978 (1.00) |
0.521 (1.00) |
0.401 (1.00) |
0.792 (1.00) |
1 (1.00) |
0.66 (1.00) |
0.372 (1.00) |
1 (1.00) |
| 12q loss | 58 (10%) | 502 |
0.982 (1.00) |
0.562 (1.00) |
0.479 (1.00) |
0.624 (1.00) |
0.654 (1.00) |
0.882 (1.00) |
0.366 (1.00) |
0.347 (1.00) |
| 13q loss | 181 (32%) | 379 |
0.785 (1.00) |
0.683 (1.00) |
0.926 (1.00) |
0.819 (1.00) |
0.551 (1.00) |
0.629 (1.00) |
0.378 (1.00) |
0.759 (1.00) |
| 14q loss | 145 (26%) | 415 |
0.989 (1.00) |
0.688 (1.00) |
0.431 (1.00) |
0.886 (1.00) |
0.718 (1.00) |
0.837 (1.00) |
0.0906 (1.00) |
0.312 (1.00) |
| 15q loss | 101 (18%) | 459 |
0.732 (1.00) |
0.0701 (1.00) |
0.5 (1.00) |
0.889 (1.00) |
0.688 (1.00) |
0.0763 (1.00) |
0.47 (1.00) |
0.249 (1.00) |
| 16p loss | 63 (11%) | 497 |
0.0481 (1.00) |
0.34 (1.00) |
0.683 (1.00) |
0.87 (1.00) |
0.324 (1.00) |
0.061 (1.00) |
0.929 (1.00) |
1 (1.00) |
| 16q loss | 82 (15%) | 478 |
0.0178 (1.00) |
0.775 (1.00) |
1 (1.00) |
0.591 (1.00) |
0.641 (1.00) |
0.0286 (1.00) |
0.272 (1.00) |
0.702 (1.00) |
| 17p loss | 61 (11%) | 499 |
0.746 (1.00) |
0.492 (1.00) |
0.27 (1.00) |
0.937 (1.00) |
0.749 (1.00) |
0.191 (1.00) |
0.863 (1.00) |
1 (1.00) |
| 17q loss | 40 (7%) | 520 |
0.991 (1.00) |
0.5 (1.00) |
0.502 (1.00) |
0.698 (1.00) |
1 (1.00) |
0.0339 (1.00) |
0.73 (1.00) |
0.595 (1.00) |
| 18p loss | 68 (12%) | 492 |
0.125 (1.00) |
0.849 (1.00) |
0.51 (1.00) |
0.463 (1.00) |
0.772 (1.00) |
1 (1.00) |
0.356 (1.00) |
0.645 (1.00) |
| 18q loss | 60 (11%) | 500 |
0.295 (1.00) |
0.811 (1.00) |
0.78 (1.00) |
0.186 (1.00) |
0.745 (1.00) |
0.245 (1.00) |
0.231 (1.00) |
0.14 (1.00) |
| 19p loss | 25 (4%) | 535 |
0.432 (1.00) |
0.662 (1.00) |
0.677 (1.00) |
0.938 (1.00) |
0.633 (1.00) |
1 (1.00) |
0.833 (1.00) |
1 (1.00) |
| 19q loss | 33 (6%) | 527 |
0.512 (1.00) |
0.662 (1.00) |
0.716 (1.00) |
0.516 (1.00) |
0.188 (1.00) |
0.849 (1.00) |
0.877 (1.00) |
1 (1.00) |
| 20p loss | 18 (3%) | 542 |
0.837 (1.00) |
0.367 (1.00) |
0.219 (1.00) |
0.926 (1.00) |
1 (1.00) |
1 (1.00) |
0.266 (1.00) |
0.341 (1.00) |
| 20q loss | 16 (3%) | 544 |
0.746 (1.00) |
0.694 (1.00) |
0.196 (1.00) |
0.984 (1.00) |
1 (1.00) |
0.596 (1.00) |
0.556 (1.00) |
1 (1.00) |
| 21q loss | 40 (7%) | 520 |
0.974 (1.00) |
0.971 (1.00) |
0.502 (1.00) |
0.325 (1.00) |
0.86 (1.00) |
0.481 (1.00) |
1 (1.00) |
0.229 (1.00) |
| 22q loss | 178 (32%) | 382 |
0.503 (1.00) |
0.0935 (1.00) |
1 (1.00) |
0.458 (1.00) |
0.343 (1.00) |
0.697 (1.00) |
0.934 (1.00) |
1 (1.00) |
| xq loss | 104 (19%) | 456 |
0.301 (1.00) |
0.792 (1.00) |
0.505 (1.00) |
0.312 (1.00) |
0.837 (1.00) |
0.726 (1.00) |
0.226 (1.00) |
0.473 (1.00) |
P value = 9.22e-05 (logrank test), Q value = 0.058
Table S1. Gene #13: '7p gain' versus Clinical Feature #1: 'Time to Death'
| nPatients | nDeath | Duration Range (Median), Month | |
|---|---|---|---|
| ALL | 560 | 462 | 0.1 - 127.6 (10.1) |
| 7P GAIN MUTATED | 454 | 382 | 0.1 - 127.6 (9.7) |
| 7P GAIN WILD-TYPE | 106 | 80 | 0.2 - 108.8 (13.0) |
Figure S1. Get High-res Image Gene #13: '7p gain' versus Clinical Feature #1: 'Time to Death'
P value = 6.74e-06 (Wilcoxon-test), Q value = 0.0043
Table S2. Gene #13: '7p gain' versus Clinical Feature #2: 'AGE'
| nPatients | Mean (Std.Dev) | |
|---|---|---|
| ALL | 560 | 57.9 (14.5) |
| 7P GAIN MUTATED | 454 | 59.7 (12.4) |
| 7P GAIN WILD-TYPE | 106 | 50.1 (19.3) |
Figure S2. Get High-res Image Gene #13: '7p gain' versus Clinical Feature #2: 'AGE'
P value = 0.000243 (logrank test), Q value = 0.15
Table S3. Gene #14: '7q gain' versus Clinical Feature #1: 'Time to Death'
| nPatients | nDeath | Duration Range (Median), Month | |
|---|---|---|---|
| ALL | 560 | 462 | 0.1 - 127.6 (10.1) |
| 7Q GAIN MUTATED | 459 | 383 | 0.1 - 127.6 (9.6) |
| 7Q GAIN WILD-TYPE | 101 | 79 | 0.2 - 108.8 (14.0) |
Figure S3. Get High-res Image Gene #14: '7q gain' versus Clinical Feature #1: 'Time to Death'
P value = 2.32e-05 (Wilcoxon-test), Q value = 0.015
Table S4. Gene #14: '7q gain' versus Clinical Feature #2: 'AGE'
| nPatients | Mean (Std.Dev) | |
|---|---|---|
| ALL | 560 | 57.9 (14.5) |
| 7Q GAIN MUTATED | 459 | 59.6 (12.3) |
| 7Q GAIN WILD-TYPE | 101 | 49.9 (20.0) |
Figure S4. Get High-res Image Gene #14: '7q gain' versus Clinical Feature #2: 'AGE'
P value = 0.000192 (Wilcoxon-test), Q value = 0.12
Table S5. Gene #19: '10p gain' versus Clinical Feature #2: 'AGE'
| nPatients | Mean (Std.Dev) | |
|---|---|---|
| ALL | 560 | 57.9 (14.5) |
| 10P GAIN MUTATED | 12 | 38.1 (18.1) |
| 10P GAIN WILD-TYPE | 548 | 58.3 (14.1) |
Figure S5. Get High-res Image Gene #19: '10p gain' versus Clinical Feature #2: 'AGE'
P value = 9.16e-05 (Wilcoxon-test), Q value = 0.058
Table S6. Gene #36: '20p gain' versus Clinical Feature #2: 'AGE'
| nPatients | Mean (Std.Dev) | |
|---|---|---|
| ALL | 560 | 57.9 (14.5) |
| 20P GAIN MUTATED | 216 | 60.9 (13.1) |
| 20P GAIN WILD-TYPE | 344 | 56.0 (15.0) |
Figure S6. Get High-res Image Gene #36: '20p gain' versus Clinical Feature #2: 'AGE'
P value = 1.95e-05 (logrank test), Q value = 0.012
Table S7. Gene #59: '10p loss' versus Clinical Feature #1: 'Time to Death'
| nPatients | nDeath | Duration Range (Median), Month | |
|---|---|---|---|
| ALL | 560 | 462 | 0.1 - 127.6 (10.1) |
| 10P LOSS MUTATED | 466 | 391 | 0.1 - 127.6 (9.9) |
| 10P LOSS WILD-TYPE | 94 | 71 | 0.2 - 108.8 (12.5) |
Figure S7. Get High-res Image Gene #59: '10p loss' versus Clinical Feature #1: 'Time to Death'
P value = 4.66e-09 (Wilcoxon-test), Q value = 3e-06
Table S8. Gene #59: '10p loss' versus Clinical Feature #2: 'AGE'
| nPatients | Mean (Std.Dev) | |
|---|---|---|
| ALL | 560 | 57.9 (14.5) |
| 10P LOSS MUTATED | 466 | 59.8 (12.6) |
| 10P LOSS WILD-TYPE | 94 | 48.2 (18.7) |
Figure S8. Get High-res Image Gene #59: '10p loss' versus Clinical Feature #2: 'AGE'
P value = 6.1e-05 (logrank test), Q value = 0.039
Table S9. Gene #60: '10q loss' versus Clinical Feature #1: 'Time to Death'
| nPatients | nDeath | Duration Range (Median), Month | |
|---|---|---|---|
| ALL | 560 | 462 | 0.1 - 127.6 (10.1) |
| 10Q LOSS MUTATED | 478 | 400 | 0.1 - 127.6 (9.9) |
| 10Q LOSS WILD-TYPE | 82 | 62 | 0.2 - 108.8 (12.2) |
Figure S9. Get High-res Image Gene #60: '10q loss' versus Clinical Feature #1: 'Time to Death'

P value = 3.5e-08 (Wilcoxon-test), Q value = 2.2e-05
Table S10. Gene #60: '10q loss' versus Clinical Feature #2: 'AGE'
| nPatients | Mean (Std.Dev) | |
|---|---|---|
| ALL | 560 | 57.9 (14.5) |
| 10Q LOSS MUTATED | 478 | 59.5 (12.9) |
| 10Q LOSS WILD-TYPE | 82 | 48.1 (18.5) |
Figure S10. Get High-res Image Gene #60: '10q loss' versus Clinical Feature #2: 'AGE'
-
Copy number data file = transformed.cor.cli.txt
-
Clinical data file = GBM-TP.merged_data.txt
-
Number of patients = 560
-
Number of significantly arm-level cnvs = 80
-
Number of selected clinical features = 8
-
Exclude regions that fewer than K tumors have mutations, K = 3
For survival clinical features, the Kaplan-Meier survival curves of tumors with and without gene mutations were plotted and the statistical significance P values were estimated by logrank test (Bland and Altman 2004) using the 'survdiff' function in R
For binary or multi-class clinical features (nominal or ordinal), two-tailed Fisher's exact tests (Fisher 1922) were used to estimate the P values using the 'fisher.test' function in R
For multiple hypothesis correction, Q value is the False Discovery Rate (FDR) analogue of the P value (Benjamini and Hochberg 1995), defined as the minimum FDR at which the test may be called significant. We used the 'Benjamini and Hochberg' method of 'p.adjust' function in R to convert P values into Q values.
In addition to the links below, the full results of the analysis summarized in this report can also be downloaded programmatically using firehose_get, or interactively from either the Broad GDAC website or TCGA Data Coordination Center Portal.