This pipeline computes the correlation between significantly recurrent gene mutations and selected clinical features.
Testing the association between mutation status of 27 genes and 11 clinical features across 306 patients, 2 significant findings detected with Q value < 0.25.
-
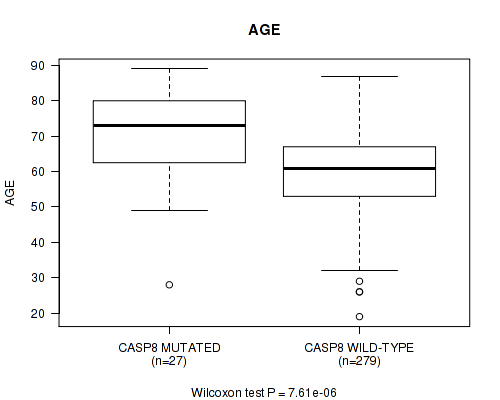
CASP8 mutation correlated to 'AGE'.
-
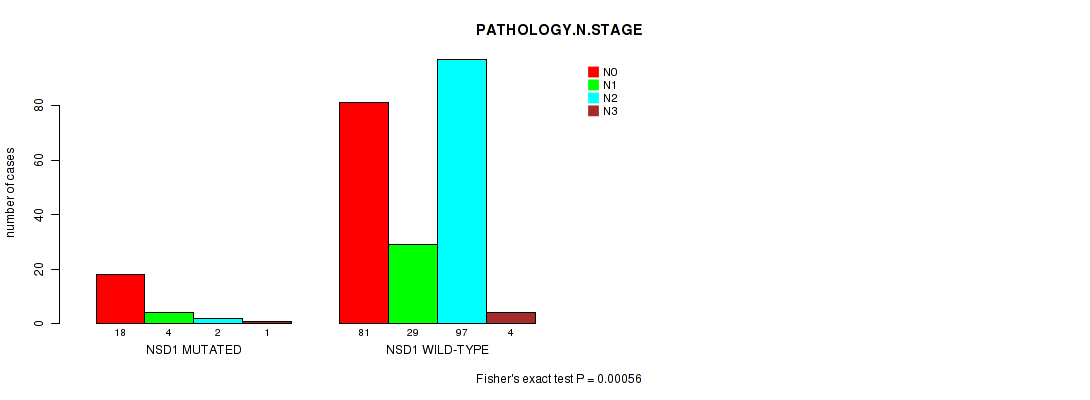
NSD1 mutation correlated to 'PATHOLOGY.N.STAGE'.
Table 1. Get Full Table Overview of the association between mutation status of 27 genes and 11 clinical features. Shown in the table are P values (Q values). Thresholded by Q value < 0.25, 2 significant findings detected.
|
Clinical Features |
Time to Death |
AGE |
NEOPLASM DISEASESTAGE |
PATHOLOGY T STAGE |
PATHOLOGY N STAGE |
GENDER |
RADIATIONS RADIATION REGIMENINDICATION |
NUMBERPACKYEARSSMOKED |
NUMBER OF LYMPH NODES |
RACE | ETHNICITY | ||
| nMutated (%) | nWild-Type | logrank test | Wilcoxon-test | Fisher's exact test | Fisher's exact test | Fisher's exact test | Fisher's exact test | Fisher's exact test | Wilcoxon-test | Wilcoxon-test | Fisher's exact test | Fisher's exact test | |
| CASP8 | 27 (9%) | 279 |
0.509 (1.00) |
7.61e-06 (0.00225) |
0.314 (1.00) |
0.559 (1.00) |
0.0835 (1.00) |
0.00127 (0.375) |
0.372 (1.00) |
0.215 (1.00) |
0.0416 (1.00) |
0.419 (1.00) |
0.351 (1.00) |
| NSD1 | 33 (11%) | 273 |
0.103 (1.00) |
0.0865 (1.00) |
0.0418 (1.00) |
0.778 (1.00) |
0.00056 (0.165) |
0.301 (1.00) |
0.301 (1.00) |
0.0913 (1.00) |
0.00301 (0.87) |
0.383 (1.00) |
0.0513 (1.00) |
| TP53 | 213 (70%) | 93 |
0.0149 (1.00) |
0.509 (1.00) |
0.00972 (1.00) |
0.00564 (1.00) |
0.0155 (1.00) |
0.781 (1.00) |
0.123 (1.00) |
0.0635 (1.00) |
0.00776 (1.00) |
0.646 (1.00) |
0.243 (1.00) |
| CDKN2A | 65 (21%) | 241 |
0.452 (1.00) |
0.409 (1.00) |
0.27 (1.00) |
0.663 (1.00) |
0.952 (1.00) |
0.64 (1.00) |
0.428 (1.00) |
0.0107 (1.00) |
0.785 (1.00) |
0.778 (1.00) |
0.197 (1.00) |
| FAT1 | 69 (23%) | 237 |
0.718 (1.00) |
0.00142 (0.417) |
0.533 (1.00) |
0.451 (1.00) |
0.854 (1.00) |
0.0677 (1.00) |
0.758 (1.00) |
0.341 (1.00) |
0.295 (1.00) |
0.19 (1.00) |
0.0889 (1.00) |
| MLL2 | 53 (17%) | 253 |
0.849 (1.00) |
0.988 (1.00) |
0.373 (1.00) |
0.123 (1.00) |
0.885 (1.00) |
0.867 (1.00) |
1 (1.00) |
0.52 (1.00) |
0.919 (1.00) |
0.498 (1.00) |
1 (1.00) |
| JUB | 18 (6%) | 288 |
0.00188 (0.548) |
0.155 (1.00) |
0.777 (1.00) |
0.456 (1.00) |
0.295 (1.00) |
1 (1.00) |
1 (1.00) |
0.196 (1.00) |
0.221 (1.00) |
0.09 (1.00) |
0.57 (1.00) |
| NOTCH1 | 57 (19%) | 249 |
0.839 (1.00) |
0.144 (1.00) |
0.835 (1.00) |
0.753 (1.00) |
0.935 (1.00) |
0.188 (1.00) |
0.405 (1.00) |
0.0649 (1.00) |
0.403 (1.00) |
0.932 (1.00) |
0.151 (1.00) |
| NFE2L2 | 17 (6%) | 289 |
0.578 (1.00) |
0.00939 (1.00) |
0.692 (1.00) |
0.77 (1.00) |
1 (1.00) |
0.261 (1.00) |
0.256 (1.00) |
0.965 (1.00) |
0.677 (1.00) |
0.176 (1.00) |
0.524 (1.00) |
| HRAS | 10 (3%) | 296 |
0.217 (1.00) |
0.293 (1.00) |
0.16 (1.00) |
0.243 (1.00) |
0.0489 (1.00) |
1 (1.00) |
0.465 (1.00) |
0.214 (1.00) |
0.0534 (1.00) |
0.682 (1.00) |
1 (1.00) |
| ZNF750 | 13 (4%) | 293 |
0.378 (1.00) |
0.824 (1.00) |
0.671 (1.00) |
0.0595 (1.00) |
0.747 (1.00) |
0.123 (1.00) |
0.525 (1.00) |
0.677 (1.00) |
0.357 (1.00) |
0.325 (1.00) |
1 (1.00) |
| RASA1 | 14 (5%) | 292 |
0.983 (1.00) |
0.942 (1.00) |
0.909 (1.00) |
0.525 (1.00) |
1 (1.00) |
0.364 (1.00) |
0.534 (1.00) |
0.694 (1.00) |
0.608 (1.00) |
0.533 (1.00) |
0.499 (1.00) |
| HLA-A | 9 (3%) | 297 |
0.145 (1.00) |
0.307 (1.00) |
0.425 (1.00) |
0.623 (1.00) |
0.34 (1.00) |
1 (1.00) |
0.703 (1.00) |
0.463 (1.00) |
0.701 (1.00) |
0.664 (1.00) |
1 (1.00) |
| EPHA2 | 13 (4%) | 293 |
0.965 (1.00) |
0.675 (1.00) |
0.888 (1.00) |
0.95 (1.00) |
0.6 (1.00) |
0.199 (1.00) |
1 (1.00) |
0.0231 (1.00) |
0.439 (1.00) |
0.116 (1.00) |
0.473 (1.00) |
| RAC1 | 9 (3%) | 297 |
0.102 (1.00) |
0.00213 (0.616) |
0.38 (1.00) |
0.413 (1.00) |
0.218 (1.00) |
0.0676 (1.00) |
1 (1.00) |
0.701 (1.00) |
0.163 (1.00) |
1 (1.00) |
1 (1.00) |
| EP300 | 24 (8%) | 282 |
0.692 (1.00) |
0.427 (1.00) |
0.592 (1.00) |
0.925 (1.00) |
0.693 (1.00) |
0.483 (1.00) |
0.634 (1.00) |
0.413 (1.00) |
0.95 (1.00) |
0.273 (1.00) |
0.296 (1.00) |
| TGFBR2 | 10 (3%) | 296 |
0.702 (1.00) |
0.0813 (1.00) |
0.871 (1.00) |
0.71 (1.00) |
0.34 (1.00) |
0.47 (1.00) |
0.0678 (1.00) |
0.12 (1.00) |
0.485 (1.00) |
0.119 (1.00) |
1 (1.00) |
| PIK3CA | 64 (21%) | 242 |
0.219 (1.00) |
0.79 (1.00) |
0.435 (1.00) |
0.741 (1.00) |
0.467 (1.00) |
0.114 (1.00) |
1 (1.00) |
0.996 (1.00) |
0.462 (1.00) |
0.052 (1.00) |
1 (1.00) |
| FBXW7 | 15 (5%) | 291 |
0.497 (1.00) |
0.143 (1.00) |
0.36 (1.00) |
0.637 (1.00) |
0.294 (1.00) |
0.372 (1.00) |
0.553 (1.00) |
0.218 (1.00) |
0.568 (1.00) |
0.157 (1.00) |
0.499 (1.00) |
| RB1 | 10 (3%) | 296 |
0.397 (1.00) |
0.728 (1.00) |
0.181 (1.00) |
0.237 (1.00) |
0.667 (1.00) |
0.145 (1.00) |
1 (1.00) |
0.905 (1.00) |
0.582 (1.00) |
0.234 (1.00) |
1 (1.00) |
| CTCF | 11 (4%) | 295 |
0.291 (1.00) |
0.0422 (1.00) |
0.635 (1.00) |
0.935 (1.00) |
0.655 (1.00) |
0.181 (1.00) |
0.49 (1.00) |
0.489 (1.00) |
0.186 (1.00) |
0.264 (1.00) |
1 (1.00) |
| KDM6A | 8 (3%) | 298 |
0.211 (1.00) |
0.766 (1.00) |
0.565 (1.00) |
0.456 (1.00) |
0.89 (1.00) |
0.453 (1.00) |
0.686 (1.00) |
0.981 (1.00) |
0.574 (1.00) |
0.0752 (1.00) |
1 (1.00) |
| ELF4 | 5 (2%) | 301 |
0.925 (1.00) |
0.712 (1.00) |
0.0505 (1.00) |
0.203 (1.00) |
0.407 (1.00) |
1 (1.00) |
0.33 (1.00) |
0.553 (1.00) |
0.192 (1.00) |
1 (1.00) |
1 (1.00) |
| RHOA | 4 (1%) | 302 |
0.00675 (1.00) |
0.765 (1.00) |
0.639 (1.00) |
0.223 (1.00) |
0.404 (1.00) |
0.303 (1.00) |
0.576 (1.00) |
0.475 (1.00) |
0.953 (1.00) |
1 (1.00) |
1 (1.00) |
| HLA-B | 8 (3%) | 298 |
0.265 (1.00) |
0.597 (1.00) |
0.293 (1.00) |
0.766 (1.00) |
0.109 (1.00) |
0.222 (1.00) |
0.115 (1.00) |
0.311 (1.00) |
0.0923 (1.00) |
1 (1.00) |
1 (1.00) |
| PRSS1 | 7 (2%) | 299 |
0.884 (1.00) |
0.684 (1.00) |
0.188 (1.00) |
0.913 (1.00) |
0.0915 (1.00) |
0.00204 (0.593) |
0.196 (1.00) |
0.185 (1.00) |
0.0953 (1.00) |
1 (1.00) |
|
| GUCY2F | 8 (3%) | 298 |
0.161 (1.00) |
0.966 (1.00) |
0.403 (1.00) |
0.304 (1.00) |
0.666 (1.00) |
1 (1.00) |
0.44 (1.00) |
0.704 (1.00) |
0.293 (1.00) |
0.121 (1.00) |
1 (1.00) |
P value = 7.61e-06 (Wilcoxon-test), Q value = 0.0023
Table S1. Gene #3: 'CASP8 MUTATION STATUS' versus Clinical Feature #2: 'AGE'
| nPatients | Mean (Std.Dev) | |
|---|---|---|
| ALL | 306 | 61.1 (12.1) |
| CASP8 MUTATED | 27 | 71.1 (13.4) |
| CASP8 WILD-TYPE | 279 | 60.2 (11.6) |
Figure S1. Get High-res Image Gene #3: 'CASP8 MUTATION STATUS' versus Clinical Feature #2: 'AGE'
P value = 0.00056 (Fisher's exact test), Q value = 0.17
Table S2. Gene #9: 'NSD1 MUTATION STATUS' versus Clinical Feature #5: 'PATHOLOGY.N.STAGE'
| nPatients | N0 | N1 | N2 | N3 |
|---|---|---|---|---|
| ALL | 99 | 33 | 99 | 5 |
| NSD1 MUTATED | 18 | 4 | 2 | 1 |
| NSD1 WILD-TYPE | 81 | 29 | 97 | 4 |
Figure S2. Get High-res Image Gene #9: 'NSD1 MUTATION STATUS' versus Clinical Feature #5: 'PATHOLOGY.N.STAGE'
-
Mutation data file = transformed.cor.cli.txt
-
Clinical data file = HNSC-TP.merged_data.txt
-
Number of patients = 306
-
Number of significantly mutated genes = 27
-
Number of selected clinical features = 11
-
Exclude genes that fewer than K tumors have mutations, K = 3
For survival clinical features, the Kaplan-Meier survival curves of tumors with and without gene mutations were plotted and the statistical significance P values were estimated by logrank test (Bland and Altman 2004) using the 'survdiff' function in R
For binary or multi-class clinical features (nominal or ordinal), two-tailed Fisher's exact tests (Fisher 1922) were used to estimate the P values using the 'fisher.test' function in R
For multiple hypothesis correction, Q value is the False Discovery Rate (FDR) analogue of the P value (Benjamini and Hochberg 1995), defined as the minimum FDR at which the test may be called significant. We used the 'Benjamini and Hochberg' method of 'p.adjust' function in R to convert P values into Q values.
In addition to the links below, the full results of the analysis summarized in this report can also be downloaded programmatically using firehose_get, or interactively from either the Broad GDAC website or TCGA Data Coordination Center Portal.