This pipeline computes the correlation between significant copy number variation (cnv focal) genes and selected clinical features.
Testing the association between copy number variation 50 focal events and 8 clinical features across 400 patients, 28 significant findings detected with Q value < 0.25.
-
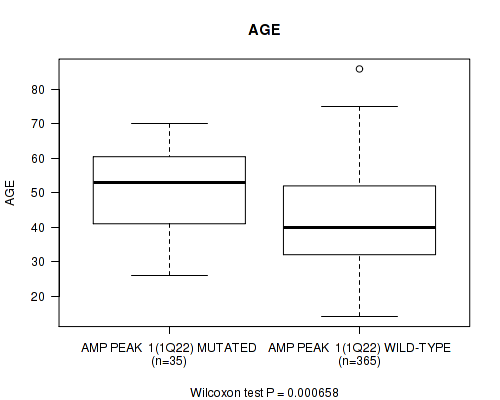
amp_1q22 cnv correlated to 'AGE'.
-
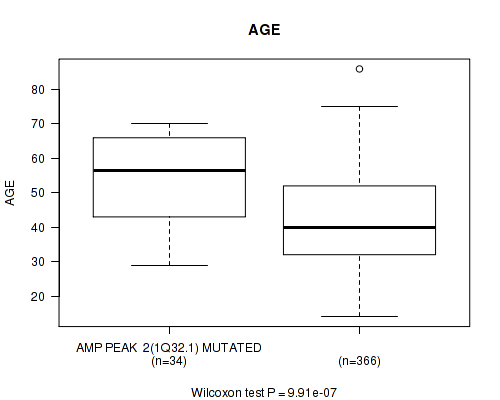
amp_1q32.1 cnv correlated to 'AGE'.
-
amp_3q26.33 cnv correlated to 'Time to Death'.
-
amp_7p11.2 cnv correlated to 'Time to Death' and 'AGE'.
-
amp_7q31.2 cnv correlated to 'AGE'.
-
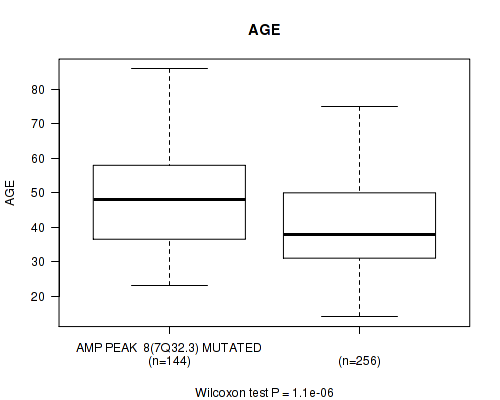
amp_7q32.3 cnv correlated to 'AGE'.
-
amp_12q14.1 cnv correlated to 'Time to Death'.
-
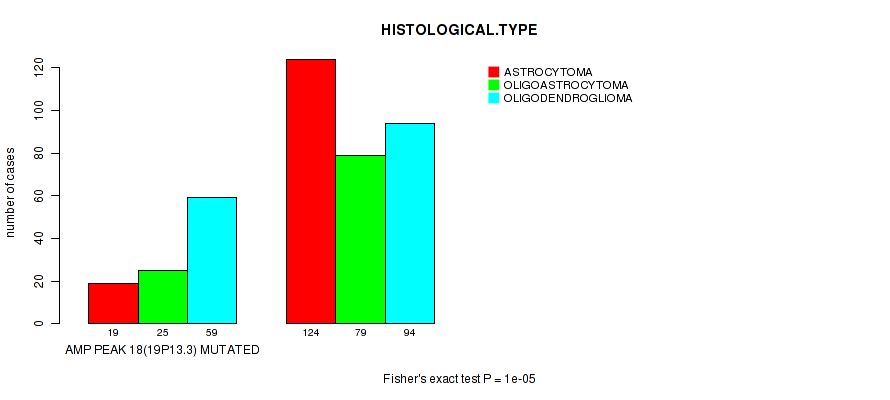
amp_19p13.3 cnv correlated to 'HISTOLOGICAL.TYPE'.
-
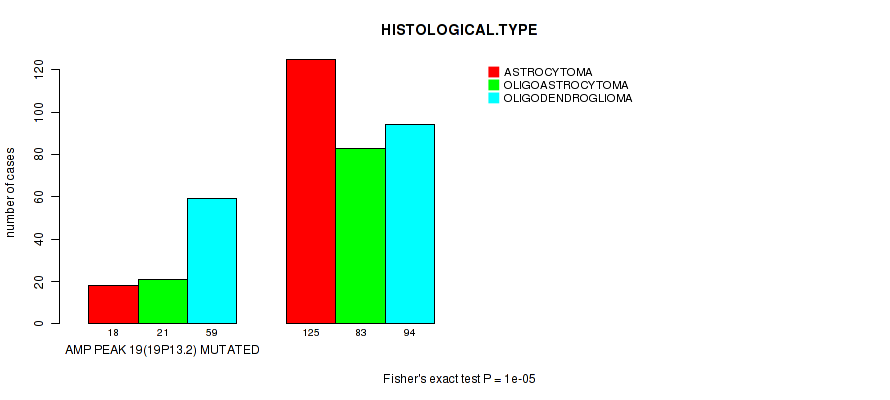
amp_19p13.2 cnv correlated to 'HISTOLOGICAL.TYPE'.
-
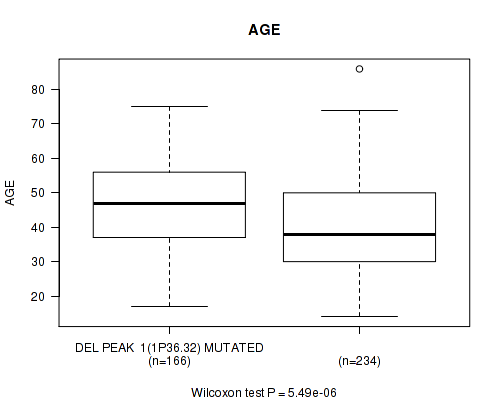
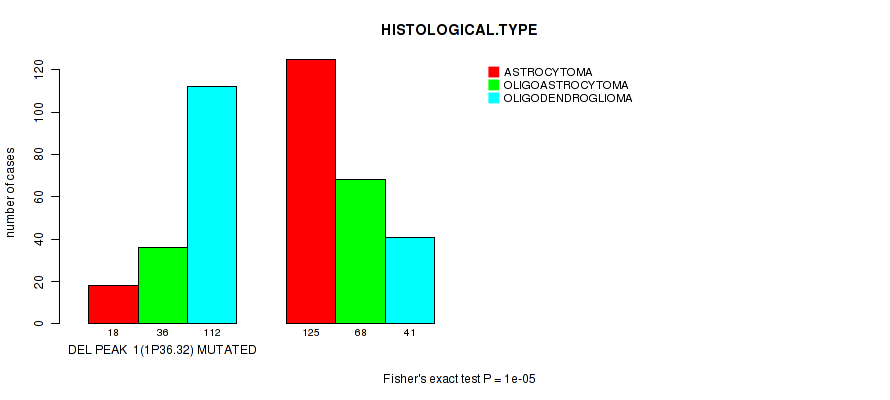
del_1p36.32 cnv correlated to 'AGE' and 'HISTOLOGICAL.TYPE'.
-
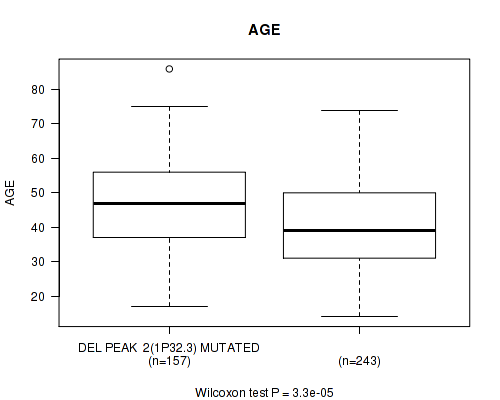
del_1p32.3 cnv correlated to 'AGE' and 'HISTOLOGICAL.TYPE'.
-
del_5q34 cnv correlated to 'HISTOLOGICAL.TYPE'.
-
del_6p25.3 cnv correlated to 'Time to Death'.
-
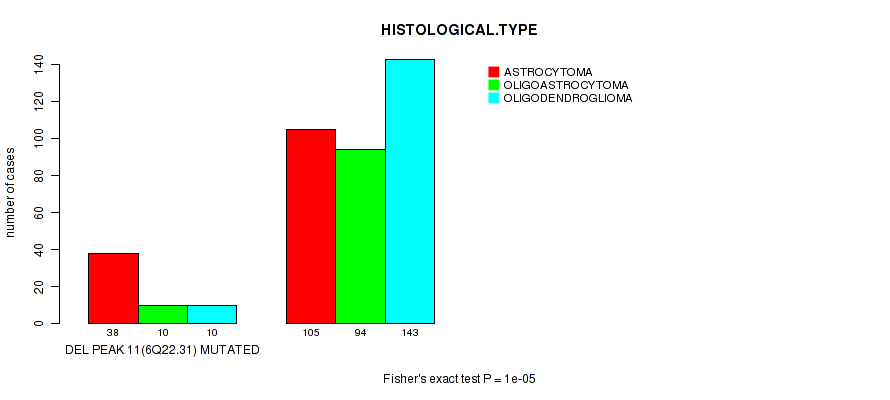
del_6q22.31 cnv correlated to 'Time to Death' and 'HISTOLOGICAL.TYPE'.
-
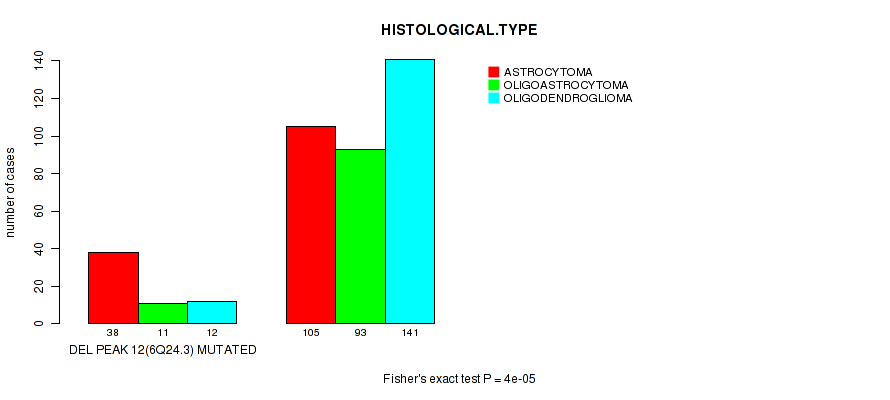
del_6q24.3 cnv correlated to 'HISTOLOGICAL.TYPE'.
-
del_9p23 cnv correlated to 'Time to Death'.
-
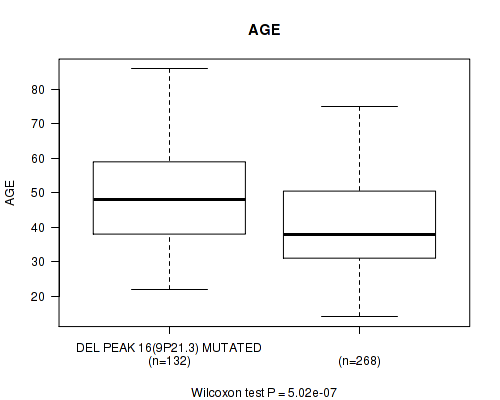
del_9p21.3 cnv correlated to 'Time to Death' and 'AGE'.
-
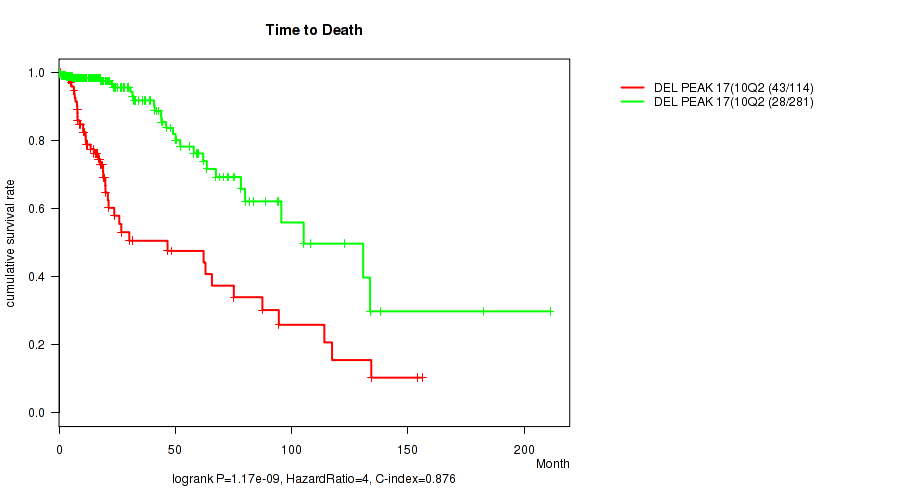
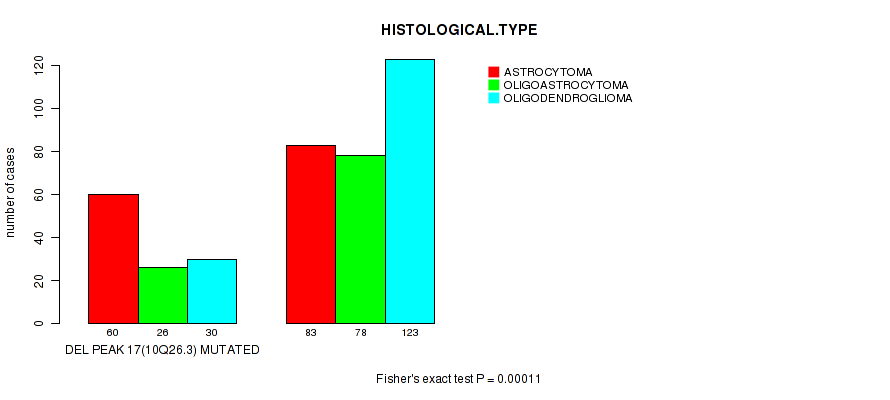
del_10q26.3 cnv correlated to 'Time to Death', 'AGE', and 'HISTOLOGICAL.TYPE'.
-
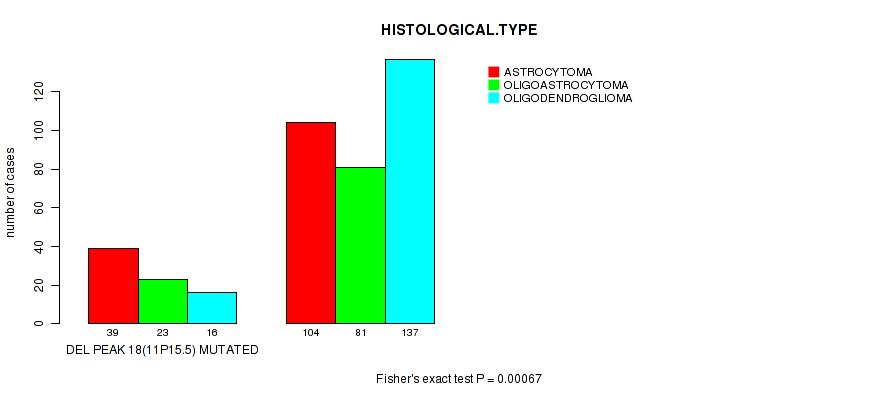
del_11p15.5 cnv correlated to 'HISTOLOGICAL.TYPE'.
-
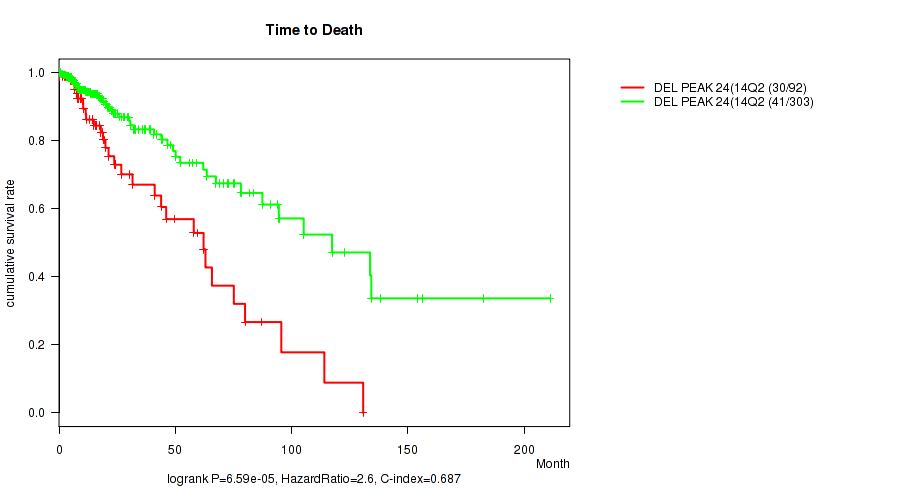
del_14q24.3 cnv correlated to 'Time to Death'.
-
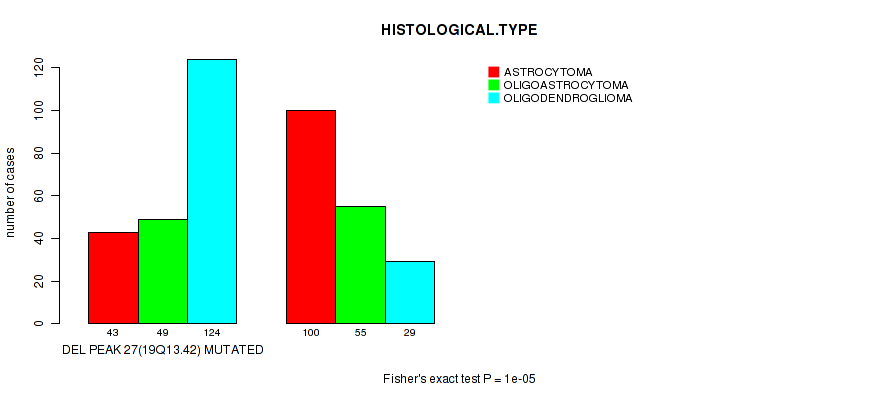
del_19q13.42 cnv correlated to 'HISTOLOGICAL.TYPE'.
Table 1. Get Full Table Overview of the association between significant copy number variation of 50 focal events and 8 clinical features. Shown in the table are P values (Q values). Thresholded by Q value < 0.25, 28 significant findings detected.
|
Clinical Features |
Time to Death |
AGE | GENDER |
KARNOFSKY PERFORMANCE SCORE |
HISTOLOGICAL TYPE |
RADIATIONS RADIATION REGIMENINDICATION |
RACE | ETHNICITY | ||
| nCNV (%) | nWild-Type | logrank test | Wilcoxon-test | Fisher's exact test | Wilcoxon-test | Fisher's exact test | Fisher's exact test | Fisher's exact test | Fisher's exact test | |
| del 10q26 3 | 116 (29%) | 284 |
1.17e-09 (4.68e-07) |
5.34e-06 (0.00209) |
0.149 (1.00) |
0.162 (1.00) |
0.00011 (0.0414) |
1 (1.00) |
0.153 (1.00) |
0.776 (1.00) |
| amp 7p11 2 | 101 (25%) | 299 |
1.74e-06 (0.000682) |
4.85e-08 (1.92e-05) |
0.204 (1.00) |
0.0922 (1.00) |
0.0316 (1.00) |
0.491 (1.00) |
0.0628 (1.00) |
1 (1.00) |
| del 1p36 32 | 166 (42%) | 234 |
0.234 (1.00) |
5.49e-06 (0.00214) |
0.474 (1.00) |
0.743 (1.00) |
1e-05 (0.00389) |
0.0377 (1.00) |
0.171 (1.00) |
1 (1.00) |
| del 1p32 3 | 157 (39%) | 243 |
0.0236 (1.00) |
3.3e-05 (0.0126) |
0.606 (1.00) |
0.626 (1.00) |
1e-05 (0.00389) |
0.00317 (1.00) |
0.541 (1.00) |
1 (1.00) |
| del 6q22 31 | 58 (14%) | 342 |
5.26e-05 (0.0199) |
0.13 (1.00) |
0.887 (1.00) |
0.164 (1.00) |
1e-05 (0.00389) |
0.307 (1.00) |
0.16 (1.00) |
1 (1.00) |
| del 9p21 3 | 132 (33%) | 268 |
1.52e-11 (6.07e-09) |
5.02e-07 (0.000199) |
0.915 (1.00) |
0.00499 (1.00) |
0.00148 (0.543) |
0.0102 (1.00) |
1 (1.00) |
0.781 (1.00) |
| amp 1q22 | 35 (9%) | 365 |
0.0277 (1.00) |
0.000658 (0.246) |
0.86 (1.00) |
0.248 (1.00) |
0.402 (1.00) |
0.394 (1.00) |
0.26 (1.00) |
0.38 (1.00) |
| amp 1q32 1 | 34 (8%) | 366 |
0.00324 (1.00) |
9.91e-07 (0.000392) |
1 (1.00) |
0.0334 (1.00) |
0.191 (1.00) |
0.287 (1.00) |
0.155 (1.00) |
0.628 (1.00) |
| amp 3q26 33 | 17 (4%) | 383 |
0.000369 (0.139) |
0.132 (1.00) |
0.465 (1.00) |
0.212 (1.00) |
0.00082 (0.303) |
0.229 (1.00) |
0.0482 (1.00) |
1 (1.00) |
| amp 7q31 2 | 138 (34%) | 262 |
0.00147 (0.54) |
3.53e-06 (0.00138) |
0.0902 (1.00) |
0.458 (1.00) |
0.0408 (1.00) |
0.613 (1.00) |
0.0877 (1.00) |
1 (1.00) |
| amp 7q32 3 | 144 (36%) | 256 |
0.00403 (1.00) |
1.1e-06 (0.000433) |
0.0467 (1.00) |
0.592 (1.00) |
0.0422 (1.00) |
0.456 (1.00) |
0.124 (1.00) |
1 (1.00) |
| amp 12q14 1 | 29 (7%) | 371 |
4.27e-08 (1.7e-05) |
0.00175 (0.64) |
0.699 (1.00) |
0.408 (1.00) |
0.0126 (1.00) |
0.354 (1.00) |
0.123 (1.00) |
1 (1.00) |
| amp 19p13 3 | 103 (26%) | 297 |
0.729 (1.00) |
0.0306 (1.00) |
0.818 (1.00) |
0.486 (1.00) |
1e-05 (0.00389) |
0.681 (1.00) |
0.667 (1.00) |
0.552 (1.00) |
| amp 19p13 2 | 98 (24%) | 302 |
0.739 (1.00) |
0.0118 (1.00) |
0.351 (1.00) |
0.324 (1.00) |
1e-05 (0.00389) |
0.889 (1.00) |
0.644 (1.00) |
0.541 (1.00) |
| del 5q34 | 51 (13%) | 349 |
0.0289 (1.00) |
0.48 (1.00) |
1 (1.00) |
0.331 (1.00) |
5e-05 (0.0189) |
0.105 (1.00) |
0.495 (1.00) |
0.704 (1.00) |
| del 6p25 3 | 39 (10%) | 361 |
2.29e-05 (0.00878) |
0.152 (1.00) |
0.737 (1.00) |
0.0674 (1.00) |
0.0522 (1.00) |
0.842 (1.00) |
0.086 (1.00) |
0.646 (1.00) |
| del 6q24 3 | 61 (15%) | 339 |
0.000794 (0.295) |
0.423 (1.00) |
0.577 (1.00) |
0.164 (1.00) |
4e-05 (0.0152) |
0.247 (1.00) |
0.199 (1.00) |
1 (1.00) |
| del 9p23 | 110 (28%) | 290 |
4.16e-05 (0.0158) |
0.0038 (1.00) |
1 (1.00) |
0.0553 (1.00) |
0.00773 (1.00) |
0.0149 (1.00) |
0.521 (1.00) |
0.768 (1.00) |
| del 11p15 5 | 78 (20%) | 322 |
0.337 (1.00) |
0.0505 (1.00) |
0.0309 (1.00) |
0.0829 (1.00) |
0.00067 (0.25) |
0.449 (1.00) |
1 (1.00) |
1 (1.00) |
| del 14q24 3 | 94 (24%) | 306 |
6.59e-05 (0.0249) |
0.0393 (1.00) |
0.287 (1.00) |
0.316 (1.00) |
0.104 (1.00) |
0.777 (1.00) |
0.213 (1.00) |
0.535 (1.00) |
| del 19q13 42 | 216 (54%) | 184 |
0.00652 (1.00) |
0.166 (1.00) |
0.841 (1.00) |
0.788 (1.00) |
1e-05 (0.00389) |
1 (1.00) |
0.843 (1.00) |
0.609 (1.00) |
| amp 2p24 3 | 16 (4%) | 384 |
0.163 (1.00) |
0.498 (1.00) |
1 (1.00) |
0.767 (1.00) |
0.102 (1.00) |
1 (1.00) |
1 (1.00) |
0.0907 (1.00) |
| amp 4q12 | 21 (5%) | 379 |
0.0329 (1.00) |
0.37 (1.00) |
1 (1.00) |
0.58 (1.00) |
0.0144 (1.00) |
1 (1.00) |
0.616 (1.00) |
0.569 (1.00) |
| amp 8q24 13 | 77 (19%) | 323 |
0.758 (1.00) |
0.258 (1.00) |
0.25 (1.00) |
0.206 (1.00) |
0.00151 (0.553) |
0.763 (1.00) |
0.863 (1.00) |
1 (1.00) |
| amp 9q34 3 | 39 (10%) | 361 |
0.537 (1.00) |
0.925 (1.00) |
0.126 (1.00) |
0.113 (1.00) |
0.0374 (1.00) |
0.55 (1.00) |
0.147 (1.00) |
0.177 (1.00) |
| amp 10p15 3 | 52 (13%) | 348 |
0.813 (1.00) |
0.000875 (0.323) |
0.295 (1.00) |
0.143 (1.00) |
0.00068 (0.253) |
0.0308 (1.00) |
1 (1.00) |
0.119 (1.00) |
| amp 11q24 1 | 71 (18%) | 329 |
0.801 (1.00) |
0.18 (1.00) |
0.357 (1.00) |
0.832 (1.00) |
0.396 (1.00) |
0.434 (1.00) |
0.844 (1.00) |
0.324 (1.00) |
| amp 12p13 32 | 56 (14%) | 344 |
0.394 (1.00) |
0.0611 (1.00) |
0.0598 (1.00) |
0.456 (1.00) |
0.133 (1.00) |
0.0589 (1.00) |
0.449 (1.00) |
0.706 (1.00) |
| amp 13q34 | 20 (5%) | 380 |
0.384 (1.00) |
0.834 (1.00) |
0.492 (1.00) |
0.0866 (1.00) |
0.679 (1.00) |
1 (1.00) |
0.576 (1.00) |
0.55 (1.00) |
| amp 15q26 3 | 14 (4%) | 386 |
0.00178 (0.649) |
0.77 (1.00) |
1 (1.00) |
0.103 (1.00) |
0.0646 (1.00) |
0.523 (1.00) |
1 (1.00) |
0.418 (1.00) |
| amp 17q25 1 | 33 (8%) | 367 |
0.00892 (1.00) |
0.192 (1.00) |
1 (1.00) |
0.632 (1.00) |
0.282 (1.00) |
0.666 (1.00) |
0.183 (1.00) |
0.342 (1.00) |
| amp xp11 22 | 32 (8%) | 368 |
0.842 (1.00) |
0.147 (1.00) |
0.715 (1.00) |
0.994 (1.00) |
0.104 (1.00) |
0.118 (1.00) |
0.242 (1.00) |
1 (1.00) |
| amp xp11 22 | 47 (12%) | 353 |
0.528 (1.00) |
0.659 (1.00) |
0.211 (1.00) |
0.643 (1.00) |
0.00253 (0.913) |
0.353 (1.00) |
0.372 (1.00) |
1 (1.00) |
| del 1q43 | 20 (5%) | 380 |
0.746 (1.00) |
0.65 (1.00) |
0.359 (1.00) |
0.559 (1.00) |
0.0943 (1.00) |
0.784 (1.00) |
0.279 (1.00) |
0.569 (1.00) |
| del 2q37 3 | 59 (15%) | 341 |
0.651 (1.00) |
0.0344 (1.00) |
0.32 (1.00) |
0.975 (1.00) |
0.0165 (1.00) |
0.503 (1.00) |
0.536 (1.00) |
0.713 (1.00) |
| del 3p21 31 | 33 (8%) | 367 |
0.151 (1.00) |
0.78 (1.00) |
0.857 (1.00) |
0.00219 (0.794) |
0.848 (1.00) |
0.126 (1.00) |
0.708 (1.00) |
0.128 (1.00) |
| del 3q29 | 34 (8%) | 366 |
0.0285 (1.00) |
0.636 (1.00) |
0.367 (1.00) |
0.192 (1.00) |
0.192 (1.00) |
0.522 (1.00) |
0.488 (1.00) |
0.373 (1.00) |
| del 4q34 3 | 109 (27%) | 291 |
0.611 (1.00) |
0.131 (1.00) |
0.734 (1.00) |
0.676 (1.00) |
0.713 (1.00) |
0.225 (1.00) |
0.624 (1.00) |
1 (1.00) |
| del 5p15 33 | 37 (9%) | 363 |
0.793 (1.00) |
0.157 (1.00) |
0.299 (1.00) |
0.0665 (1.00) |
0.00307 (1.00) |
0.0111 (1.00) |
0.54 (1.00) |
1 (1.00) |
| del 7p22 3 | 16 (4%) | 384 |
0.233 (1.00) |
0.892 (1.00) |
0.319 (1.00) |
0.617 (1.00) |
0.77 (1.00) |
0.762 (1.00) |
1 (1.00) |
1 (1.00) |
| del 8q24 3 | 21 (5%) | 379 |
0.445 (1.00) |
0.514 (1.00) |
0.823 (1.00) |
0.642 (1.00) |
0.17 (1.00) |
0.431 (1.00) |
0.18 (1.00) |
0.0395 (1.00) |
| del 12p13 1 | 31 (8%) | 369 |
0.00472 (1.00) |
0.469 (1.00) |
0.577 (1.00) |
0.51 (1.00) |
0.0521 (1.00) |
0.369 (1.00) |
0.694 (1.00) |
0.615 (1.00) |
| del 12q12 | 51 (13%) | 349 |
0.986 (1.00) |
0.33 (1.00) |
0.454 (1.00) |
0.583 (1.00) |
0.00541 (1.00) |
0.721 (1.00) |
0.484 (1.00) |
0.234 (1.00) |
| del 13q14 2 | 112 (28%) | 288 |
0.0103 (1.00) |
0.749 (1.00) |
0.179 (1.00) |
0.0157 (1.00) |
0.153 (1.00) |
0.11 (1.00) |
0.278 (1.00) |
0.569 (1.00) |
| del 13q14 2 | 114 (28%) | 286 |
0.0151 (1.00) |
0.766 (1.00) |
0.182 (1.00) |
0.0159 (1.00) |
0.118 (1.00) |
0.144 (1.00) |
0.284 (1.00) |
0.568 (1.00) |
| del 13q34 | 86 (22%) | 314 |
0.0236 (1.00) |
0.714 (1.00) |
0.391 (1.00) |
0.332 (1.00) |
0.94 (1.00) |
0.305 (1.00) |
0.208 (1.00) |
1 (1.00) |
| del 15q21 3 | 48 (12%) | 352 |
0.272 (1.00) |
0.231 (1.00) |
1 (1.00) |
0.905 (1.00) |
1 (1.00) |
0.585 (1.00) |
1 (1.00) |
0.233 (1.00) |
| del 18q23 | 64 (16%) | 336 |
0.761 (1.00) |
0.0292 (1.00) |
0.412 (1.00) |
0.962 (1.00) |
0.466 (1.00) |
0.87 (1.00) |
0.236 (1.00) |
0.713 (1.00) |
| del 22q13 31 | 59 (15%) | 341 |
0.00198 (0.719) |
0.00562 (1.00) |
0.67 (1.00) |
0.105 (1.00) |
0.00535 (1.00) |
0.737 (1.00) |
0.217 (1.00) |
0.706 (1.00) |
| del xq21 1 | 55 (14%) | 345 |
0.114 (1.00) |
0.0507 (1.00) |
0.884 (1.00) |
0.898 (1.00) |
0.521 (1.00) |
1 (1.00) |
0.511 (1.00) |
0.704 (1.00) |
P value = 0.000658 (Wilcoxon-test), Q value = 0.25
Table S1. Gene #1: 'amp_1q22' versus Clinical Feature #2: 'AGE'
| nPatients | Mean (Std.Dev) | |
|---|---|---|
| ALL | 400 | 43.2 (13.3) |
| AMP PEAK 1(1Q22) MUTATED | 35 | 50.6 (13.1) |
| AMP PEAK 1(1Q22) WILD-TYPE | 365 | 42.5 (13.2) |
Figure S1. Get High-res Image Gene #1: 'amp_1q22' versus Clinical Feature #2: 'AGE'
P value = 9.91e-07 (Wilcoxon-test), Q value = 0.00039
Table S2. Gene #2: 'amp_1q32.1' versus Clinical Feature #2: 'AGE'
| nPatients | Mean (Std.Dev) | |
|---|---|---|
| ALL | 400 | 43.2 (13.3) |
| AMP PEAK 2(1Q32.1) MUTATED | 34 | 54.2 (12.1) |
| AMP PEAK 2(1Q32.1) WILD-TYPE | 366 | 42.2 (13.0) |
Figure S2. Get High-res Image Gene #2: 'amp_1q32.1' versus Clinical Feature #2: 'AGE'
P value = 0.000369 (logrank test), Q value = 0.14
Table S3. Gene #4: 'amp_3q26.33' versus Clinical Feature #1: 'Time to Death'
| nPatients | nDeath | Duration Range (Median), Month | |
|---|---|---|---|
| ALL | 395 | 71 | 0.0 - 211.2 (15.0) |
| AMP PEAK 4(3Q26.33) MUTATED | 16 | 6 | 0.2 - 47.8 (11.3) |
| AMP PEAK 4(3Q26.33) WILD-TYPE | 379 | 65 | 0.0 - 211.2 (15.1) |
Figure S3. Get High-res Image Gene #4: 'amp_3q26.33' versus Clinical Feature #1: 'Time to Death'

P value = 1.74e-06 (logrank test), Q value = 0.00068
Table S4. Gene #6: 'amp_7p11.2' versus Clinical Feature #1: 'Time to Death'
| nPatients | nDeath | Duration Range (Median), Month | |
|---|---|---|---|
| ALL | 395 | 71 | 0.0 - 211.2 (15.0) |
| AMP PEAK 6(7P11.2) MUTATED | 100 | 34 | 0.1 - 211.2 (13.6) |
| AMP PEAK 6(7P11.2) WILD-TYPE | 295 | 37 | 0.0 - 182.3 (15.1) |
Figure S4. Get High-res Image Gene #6: 'amp_7p11.2' versus Clinical Feature #1: 'Time to Death'

P value = 4.85e-08 (Wilcoxon-test), Q value = 1.9e-05
Table S5. Gene #6: 'amp_7p11.2' versus Clinical Feature #2: 'AGE'
| nPatients | Mean (Std.Dev) | |
|---|---|---|
| ALL | 400 | 43.2 (13.3) |
| AMP PEAK 6(7P11.2) MUTATED | 101 | 49.7 (13.5) |
| AMP PEAK 6(7P11.2) WILD-TYPE | 299 | 41.1 (12.6) |
Figure S5. Get High-res Image Gene #6: 'amp_7p11.2' versus Clinical Feature #2: 'AGE'

P value = 3.53e-06 (Wilcoxon-test), Q value = 0.0014
Table S6. Gene #7: 'amp_7q31.2' versus Clinical Feature #2: 'AGE'
| nPatients | Mean (Std.Dev) | |
|---|---|---|
| ALL | 400 | 43.2 (13.3) |
| AMP PEAK 7(7Q31.2) MUTATED | 138 | 47.6 (13.4) |
| AMP PEAK 7(7Q31.2) WILD-TYPE | 262 | 41.0 (12.8) |
Figure S6. Get High-res Image Gene #7: 'amp_7q31.2' versus Clinical Feature #2: 'AGE'

P value = 1.1e-06 (Wilcoxon-test), Q value = 0.00043
Table S7. Gene #8: 'amp_7q32.3' versus Clinical Feature #2: 'AGE'
| nPatients | Mean (Std.Dev) | |
|---|---|---|
| ALL | 400 | 43.2 (13.3) |
| AMP PEAK 8(7Q32.3) MUTATED | 144 | 47.6 (13.2) |
| AMP PEAK 8(7Q32.3) WILD-TYPE | 256 | 40.8 (12.8) |
Figure S7. Get High-res Image Gene #8: 'amp_7q32.3' versus Clinical Feature #2: 'AGE'
P value = 4.27e-08 (logrank test), Q value = 1.7e-05
Table S8. Gene #14: 'amp_12q14.1' versus Clinical Feature #1: 'Time to Death'
| nPatients | nDeath | Duration Range (Median), Month | |
|---|---|---|---|
| ALL | 395 | 71 | 0.0 - 211.2 (15.0) |
| AMP PEAK 14(12Q14.1) MUTATED | 29 | 13 | 1.2 - 80.0 (12.0) |
| AMP PEAK 14(12Q14.1) WILD-TYPE | 366 | 58 | 0.0 - 211.2 (15.1) |
Figure S8. Get High-res Image Gene #14: 'amp_12q14.1' versus Clinical Feature #1: 'Time to Death'

P value = 1e-05 (Fisher's exact test), Q value = 0.0039
Table S9. Gene #18: 'amp_19p13.3' versus Clinical Feature #5: 'HISTOLOGICAL.TYPE'
| nPatients | ASTROCYTOMA | OLIGOASTROCYTOMA | OLIGODENDROGLIOMA |
|---|---|---|---|
| ALL | 143 | 104 | 153 |
| AMP PEAK 18(19P13.3) MUTATED | 19 | 25 | 59 |
| AMP PEAK 18(19P13.3) WILD-TYPE | 124 | 79 | 94 |
Figure S9. Get High-res Image Gene #18: 'amp_19p13.3' versus Clinical Feature #5: 'HISTOLOGICAL.TYPE'
P value = 1e-05 (Fisher's exact test), Q value = 0.0039
Table S10. Gene #19: 'amp_19p13.2' versus Clinical Feature #5: 'HISTOLOGICAL.TYPE'
| nPatients | ASTROCYTOMA | OLIGOASTROCYTOMA | OLIGODENDROGLIOMA |
|---|---|---|---|
| ALL | 143 | 104 | 153 |
| AMP PEAK 19(19P13.2) MUTATED | 18 | 21 | 59 |
| AMP PEAK 19(19P13.2) WILD-TYPE | 125 | 83 | 94 |
Figure S10. Get High-res Image Gene #19: 'amp_19p13.2' versus Clinical Feature #5: 'HISTOLOGICAL.TYPE'
P value = 5.49e-06 (Wilcoxon-test), Q value = 0.0021
Table S11. Gene #22: 'del_1p36.32' versus Clinical Feature #2: 'AGE'
| nPatients | Mean (Std.Dev) | |
|---|---|---|
| ALL | 400 | 43.2 (13.3) |
| DEL PEAK 1(1P36.32) MUTATED | 166 | 46.6 (12.6) |
| DEL PEAK 1(1P36.32) WILD-TYPE | 234 | 40.9 (13.4) |
Figure S11. Get High-res Image Gene #22: 'del_1p36.32' versus Clinical Feature #2: 'AGE'
P value = 1e-05 (Fisher's exact test), Q value = 0.0039
Table S12. Gene #22: 'del_1p36.32' versus Clinical Feature #5: 'HISTOLOGICAL.TYPE'
| nPatients | ASTROCYTOMA | OLIGOASTROCYTOMA | OLIGODENDROGLIOMA |
|---|---|---|---|
| ALL | 143 | 104 | 153 |
| DEL PEAK 1(1P36.32) MUTATED | 18 | 36 | 112 |
| DEL PEAK 1(1P36.32) WILD-TYPE | 125 | 68 | 41 |
Figure S12. Get High-res Image Gene #22: 'del_1p36.32' versus Clinical Feature #5: 'HISTOLOGICAL.TYPE'
P value = 3.3e-05 (Wilcoxon-test), Q value = 0.013
Table S13. Gene #23: 'del_1p32.3' versus Clinical Feature #2: 'AGE'
| nPatients | Mean (Std.Dev) | |
|---|---|---|
| ALL | 400 | 43.2 (13.3) |
| DEL PEAK 2(1P32.3) MUTATED | 157 | 46.6 (13.0) |
| DEL PEAK 2(1P32.3) WILD-TYPE | 243 | 41.1 (13.1) |
Figure S13. Get High-res Image Gene #23: 'del_1p32.3' versus Clinical Feature #2: 'AGE'
P value = 1e-05 (Fisher's exact test), Q value = 0.0039
Table S14. Gene #23: 'del_1p32.3' versus Clinical Feature #5: 'HISTOLOGICAL.TYPE'
| nPatients | ASTROCYTOMA | OLIGOASTROCYTOMA | OLIGODENDROGLIOMA |
|---|---|---|---|
| ALL | 143 | 104 | 153 |
| DEL PEAK 2(1P32.3) MUTATED | 11 | 33 | 113 |
| DEL PEAK 2(1P32.3) WILD-TYPE | 132 | 71 | 40 |
Figure S14. Get High-res Image Gene #23: 'del_1p32.3' versus Clinical Feature #5: 'HISTOLOGICAL.TYPE'

P value = 5e-05 (Fisher's exact test), Q value = 0.019
Table S15. Gene #30: 'del_5q34' versus Clinical Feature #5: 'HISTOLOGICAL.TYPE'
| nPatients | ASTROCYTOMA | OLIGOASTROCYTOMA | OLIGODENDROGLIOMA |
|---|---|---|---|
| ALL | 143 | 104 | 153 |
| DEL PEAK 9(5Q34) MUTATED | 31 | 12 | 8 |
| DEL PEAK 9(5Q34) WILD-TYPE | 112 | 92 | 145 |
Figure S15. Get High-res Image Gene #30: 'del_5q34' versus Clinical Feature #5: 'HISTOLOGICAL.TYPE'

P value = 2.29e-05 (logrank test), Q value = 0.0088
Table S16. Gene #31: 'del_6p25.3' versus Clinical Feature #1: 'Time to Death'
| nPatients | nDeath | Duration Range (Median), Month | |
|---|---|---|---|
| ALL | 395 | 71 | 0.0 - 211.2 (15.0) |
| DEL PEAK 10(6P25.3) MUTATED | 37 | 13 | 0.2 - 94.5 (17.8) |
| DEL PEAK 10(6P25.3) WILD-TYPE | 358 | 58 | 0.0 - 211.2 (14.8) |
Figure S16. Get High-res Image Gene #31: 'del_6p25.3' versus Clinical Feature #1: 'Time to Death'

P value = 5.26e-05 (logrank test), Q value = 0.02
Table S17. Gene #32: 'del_6q22.31' versus Clinical Feature #1: 'Time to Death'
| nPatients | nDeath | Duration Range (Median), Month | |
|---|---|---|---|
| ALL | 395 | 71 | 0.0 - 211.2 (15.0) |
| DEL PEAK 11(6Q22.31) MUTATED | 56 | 18 | 0.1 - 117.4 (15.9) |
| DEL PEAK 11(6Q22.31) WILD-TYPE | 339 | 53 | 0.0 - 211.2 (14.7) |
Figure S17. Get High-res Image Gene #32: 'del_6q22.31' versus Clinical Feature #1: 'Time to Death'

P value = 1e-05 (Fisher's exact test), Q value = 0.0039
Table S18. Gene #32: 'del_6q22.31' versus Clinical Feature #5: 'HISTOLOGICAL.TYPE'
| nPatients | ASTROCYTOMA | OLIGOASTROCYTOMA | OLIGODENDROGLIOMA |
|---|---|---|---|
| ALL | 143 | 104 | 153 |
| DEL PEAK 11(6Q22.31) MUTATED | 38 | 10 | 10 |
| DEL PEAK 11(6Q22.31) WILD-TYPE | 105 | 94 | 143 |
Figure S18. Get High-res Image Gene #32: 'del_6q22.31' versus Clinical Feature #5: 'HISTOLOGICAL.TYPE'
P value = 4e-05 (Fisher's exact test), Q value = 0.015
Table S19. Gene #33: 'del_6q24.3' versus Clinical Feature #5: 'HISTOLOGICAL.TYPE'
| nPatients | ASTROCYTOMA | OLIGOASTROCYTOMA | OLIGODENDROGLIOMA |
|---|---|---|---|
| ALL | 143 | 104 | 153 |
| DEL PEAK 12(6Q24.3) MUTATED | 38 | 11 | 12 |
| DEL PEAK 12(6Q24.3) WILD-TYPE | 105 | 93 | 141 |
Figure S19. Get High-res Image Gene #33: 'del_6q24.3' versus Clinical Feature #5: 'HISTOLOGICAL.TYPE'
P value = 4.16e-05 (logrank test), Q value = 0.016
Table S20. Gene #36: 'del_9p23' versus Clinical Feature #1: 'Time to Death'
| nPatients | nDeath | Duration Range (Median), Month | |
|---|---|---|---|
| ALL | 395 | 71 | 0.0 - 211.2 (15.0) |
| DEL PEAK 15(9P23) MUTATED | 108 | 29 | 0.1 - 117.4 (14.5) |
| DEL PEAK 15(9P23) WILD-TYPE | 287 | 42 | 0.0 - 211.2 (15.1) |
Figure S20. Get High-res Image Gene #36: 'del_9p23' versus Clinical Feature #1: 'Time to Death'

P value = 1.52e-11 (logrank test), Q value = 6.1e-09
Table S21. Gene #37: 'del_9p21.3' versus Clinical Feature #1: 'Time to Death'
| nPatients | nDeath | Duration Range (Median), Month | |
|---|---|---|---|
| ALL | 395 | 71 | 0.0 - 211.2 (15.0) |
| DEL PEAK 16(9P21.3) MUTATED | 130 | 41 | 0.1 - 117.4 (14.2) |
| DEL PEAK 16(9P21.3) WILD-TYPE | 265 | 30 | 0.0 - 211.2 (15.3) |
Figure S21. Get High-res Image Gene #37: 'del_9p21.3' versus Clinical Feature #1: 'Time to Death'

P value = 5.02e-07 (Wilcoxon-test), Q value = 2e-04
Table S22. Gene #37: 'del_9p21.3' versus Clinical Feature #2: 'AGE'
| nPatients | Mean (Std.Dev) | |
|---|---|---|
| ALL | 400 | 43.2 (13.3) |
| DEL PEAK 16(9P21.3) MUTATED | 132 | 48.1 (13.6) |
| DEL PEAK 16(9P21.3) WILD-TYPE | 268 | 40.9 (12.6) |
Figure S22. Get High-res Image Gene #37: 'del_9p21.3' versus Clinical Feature #2: 'AGE'
P value = 1.17e-09 (logrank test), Q value = 4.7e-07
Table S23. Gene #38: 'del_10q26.3' versus Clinical Feature #1: 'Time to Death'
| nPatients | nDeath | Duration Range (Median), Month | |
|---|---|---|---|
| ALL | 395 | 71 | 0.0 - 211.2 (15.0) |
| DEL PEAK 17(10Q26.3) MUTATED | 114 | 43 | 0.1 - 156.2 (15.0) |
| DEL PEAK 17(10Q26.3) WILD-TYPE | 281 | 28 | 0.0 - 211.2 (15.0) |
Figure S23. Get High-res Image Gene #38: 'del_10q26.3' versus Clinical Feature #1: 'Time to Death'
P value = 5.34e-06 (Wilcoxon-test), Q value = 0.0021
Table S24. Gene #38: 'del_10q26.3' versus Clinical Feature #2: 'AGE'
| nPatients | Mean (Std.Dev) | |
|---|---|---|
| ALL | 400 | 43.2 (13.3) |
| DEL PEAK 17(10Q26.3) MUTATED | 116 | 48.2 (13.9) |
| DEL PEAK 17(10Q26.3) WILD-TYPE | 284 | 41.2 (12.6) |
Figure S24. Get High-res Image Gene #38: 'del_10q26.3' versus Clinical Feature #2: 'AGE'

P value = 0.00011 (Fisher's exact test), Q value = 0.041
Table S25. Gene #38: 'del_10q26.3' versus Clinical Feature #5: 'HISTOLOGICAL.TYPE'
| nPatients | ASTROCYTOMA | OLIGOASTROCYTOMA | OLIGODENDROGLIOMA |
|---|---|---|---|
| ALL | 143 | 104 | 153 |
| DEL PEAK 17(10Q26.3) MUTATED | 60 | 26 | 30 |
| DEL PEAK 17(10Q26.3) WILD-TYPE | 83 | 78 | 123 |
Figure S25. Get High-res Image Gene #38: 'del_10q26.3' versus Clinical Feature #5: 'HISTOLOGICAL.TYPE'
P value = 0.00067 (Fisher's exact test), Q value = 0.25
Table S26. Gene #39: 'del_11p15.5' versus Clinical Feature #5: 'HISTOLOGICAL.TYPE'
| nPatients | ASTROCYTOMA | OLIGOASTROCYTOMA | OLIGODENDROGLIOMA |
|---|---|---|---|
| ALL | 143 | 104 | 153 |
| DEL PEAK 18(11P15.5) MUTATED | 39 | 23 | 16 |
| DEL PEAK 18(11P15.5) WILD-TYPE | 104 | 81 | 137 |
Figure S26. Get High-res Image Gene #39: 'del_11p15.5' versus Clinical Feature #5: 'HISTOLOGICAL.TYPE'
P value = 6.59e-05 (logrank test), Q value = 0.025
Table S27. Gene #45: 'del_14q24.3' versus Clinical Feature #1: 'Time to Death'
| nPatients | nDeath | Duration Range (Median), Month | |
|---|---|---|---|
| ALL | 395 | 71 | 0.0 - 211.2 (15.0) |
| DEL PEAK 24(14Q24.3) MUTATED | 92 | 30 | 0.1 - 130.8 (15.9) |
| DEL PEAK 24(14Q24.3) WILD-TYPE | 303 | 41 | 0.0 - 211.2 (14.7) |
Figure S27. Get High-res Image Gene #45: 'del_14q24.3' versus Clinical Feature #1: 'Time to Death'
P value = 1e-05 (Fisher's exact test), Q value = 0.0039
Table S28. Gene #48: 'del_19q13.42' versus Clinical Feature #5: 'HISTOLOGICAL.TYPE'
| nPatients | ASTROCYTOMA | OLIGOASTROCYTOMA | OLIGODENDROGLIOMA |
|---|---|---|---|
| ALL | 143 | 104 | 153 |
| DEL PEAK 27(19Q13.42) MUTATED | 43 | 49 | 124 |
| DEL PEAK 27(19Q13.42) WILD-TYPE | 100 | 55 | 29 |
Figure S28. Get High-res Image Gene #48: 'del_19q13.42' versus Clinical Feature #5: 'HISTOLOGICAL.TYPE'
-
Copy number data file = transformed.cor.cli.txt
-
Clinical data file = LGG-TP.merged_data.txt
-
Number of patients = 400
-
Number of significantly focal cnvs = 50
-
Number of selected clinical features = 8
-
Exclude genes that fewer than K tumors have mutations, K = 3
For survival clinical features, the Kaplan-Meier survival curves of tumors with and without gene mutations were plotted and the statistical significance P values were estimated by logrank test (Bland and Altman 2004) using the 'survdiff' function in R
For binary or multi-class clinical features (nominal or ordinal), two-tailed Fisher's exact tests (Fisher 1922) were used to estimate the P values using the 'fisher.test' function in R
For multiple hypothesis correction, Q value is the False Discovery Rate (FDR) analogue of the P value (Benjamini and Hochberg 1995), defined as the minimum FDR at which the test may be called significant. We used the 'Benjamini and Hochberg' method of 'p.adjust' function in R to convert P values into Q values.
In addition to the links below, the full results of the analysis summarized in this report can also be downloaded programmatically using firehose_get, or interactively from either the Broad GDAC website or TCGA Data Coordination Center Portal.