This pipeline computes the correlation between significantly recurrent gene mutations and selected clinical features.
Testing the association between mutation status of 36 genes and 8 clinical features across 282 patients, 15 significant findings detected with Q value < 0.25.
-
IDH1 mutation correlated to 'Time to Death' and 'AGE'.
-
TP53 mutation correlated to 'AGE' and 'HISTOLOGICAL.TYPE'.
-
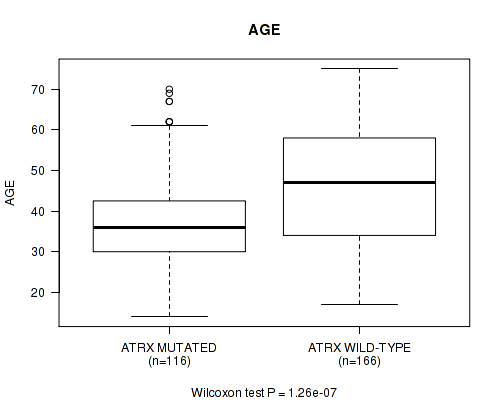
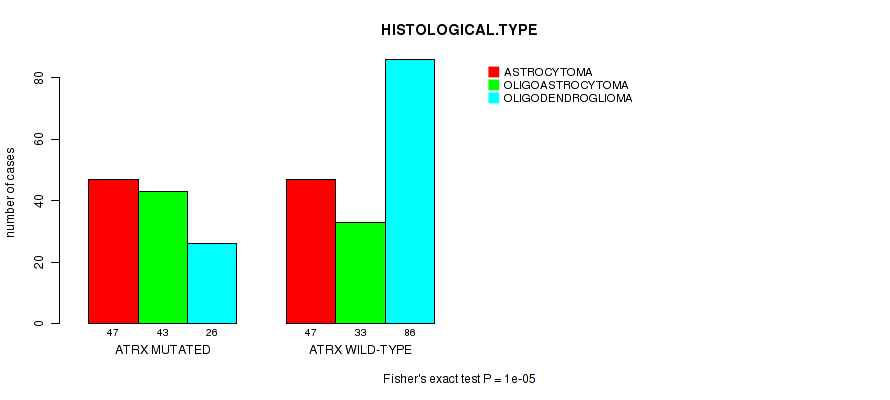
ATRX mutation correlated to 'AGE' and 'HISTOLOGICAL.TYPE'.
-
CIC mutation correlated to 'HISTOLOGICAL.TYPE'.
-
NOTCH1 mutation correlated to 'HISTOLOGICAL.TYPE'.
-
FUBP1 mutation correlated to 'HISTOLOGICAL.TYPE'.
-
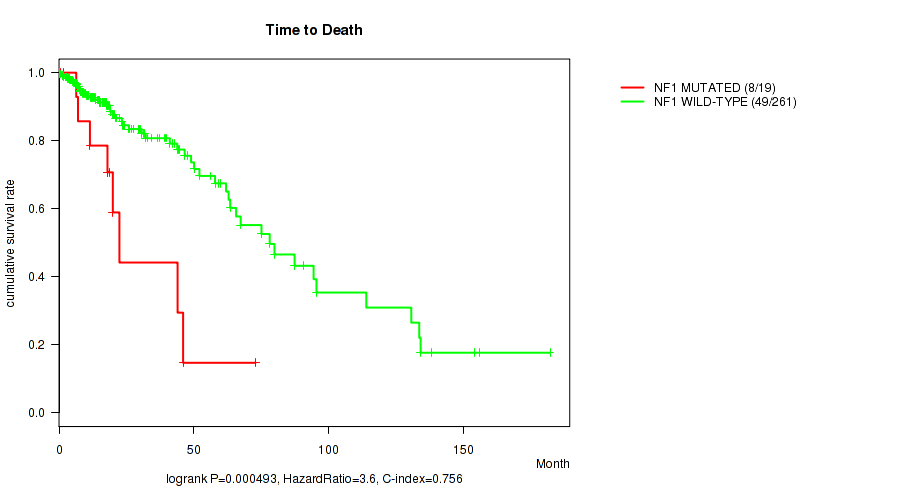
NF1 mutation correlated to 'Time to Death'.
-
PTEN mutation correlated to 'Time to Death' and 'AGE'.
-
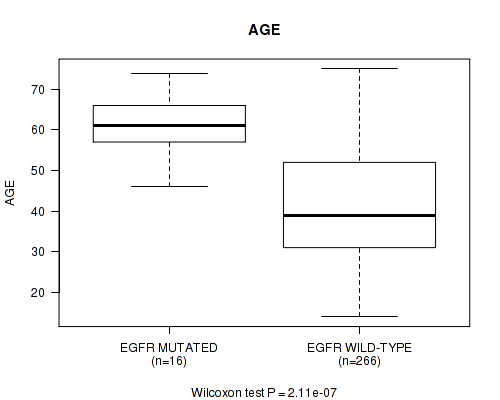
EGFR mutation correlated to 'Time to Death' and 'AGE'.
-
PLCG1 mutation correlated to 'Time to Death'.
Table 1. Get Full Table Overview of the association between mutation status of 36 genes and 8 clinical features. Shown in the table are P values (Q values). Thresholded by Q value < 0.25, 15 significant findings detected.
|
Clinical Features |
Time to Death |
AGE | GENDER |
KARNOFSKY PERFORMANCE SCORE |
HISTOLOGICAL TYPE |
RADIATIONS RADIATION REGIMENINDICATION |
RACE | ETHNICITY | ||
| nMutated (%) | nWild-Type | logrank test | Wilcoxon-test | Fisher's exact test | Wilcoxon-test | Fisher's exact test | Fisher's exact test | Fisher's exact test | Fisher's exact test | |
| IDH1 | 215 (76%) | 67 |
4.7e-09 (1.3e-06) |
0.000464 (0.124) |
0.124 (1.00) |
0.0372 (1.00) |
0.0262 (1.00) |
0.762 (1.00) |
0.178 (1.00) |
0.328 (1.00) |
| TP53 | 143 (51%) | 139 |
0.36 (1.00) |
7.58e-07 (0.000207) |
0.119 (1.00) |
0.197 (1.00) |
1e-05 (0.00271) |
0.0271 (1.00) |
0.469 (1.00) |
1 (1.00) |
| ATRX | 116 (41%) | 166 |
0.0889 (1.00) |
1.26e-07 (3.46e-05) |
0.226 (1.00) |
0.0972 (1.00) |
1e-05 (0.00271) |
0.0666 (1.00) |
0.746 (1.00) |
1 (1.00) |
| PTEN | 13 (5%) | 269 |
3.79e-08 (1.05e-05) |
0.000737 (0.195) |
0.571 (1.00) |
0.106 (1.00) |
0.00537 (1.00) |
0.541 (1.00) |
0.144 (1.00) |
1 (1.00) |
| EGFR | 16 (6%) | 266 |
0 (0) |
2.11e-07 (5.78e-05) |
0.616 (1.00) |
0.00179 (0.467) |
0.299 (1.00) |
0.161 (1.00) |
0.545 (1.00) |
1 (1.00) |
| CIC | 53 (19%) | 229 |
0.0528 (1.00) |
0.337 (1.00) |
0.284 (1.00) |
0.494 (1.00) |
1e-05 (0.00271) |
0.134 (1.00) |
0.757 (1.00) |
1 (1.00) |
| NOTCH1 | 28 (10%) | 254 |
0.743 (1.00) |
0.0411 (1.00) |
1 (1.00) |
0.561 (1.00) |
2e-05 (0.00536) |
0.386 (1.00) |
0.656 (1.00) |
1 (1.00) |
| FUBP1 | 26 (9%) | 256 |
0.95 (1.00) |
0.00443 (1.00) |
1 (1.00) |
0.638 (1.00) |
2e-05 (0.00536) |
1 (1.00) |
1 (1.00) |
0.619 (1.00) |
| NF1 | 19 (7%) | 263 |
0.000493 (0.131) |
0.194 (1.00) |
0.813 (1.00) |
0.339 (1.00) |
0.0797 (1.00) |
0.119 (1.00) |
0.25 (1.00) |
0.265 (1.00) |
| PLCG1 | 4 (1%) | 278 |
1.07e-06 (0.000291) |
0.0604 (1.00) |
1 (1.00) |
0.656 (1.00) |
0.683 (1.00) |
0.586 (1.00) |
0.177 (1.00) |
1 (1.00) |
| IDH2 | 12 (4%) | 270 |
0.252 (1.00) |
0.237 (1.00) |
0.77 (1.00) |
0.911 (1.00) |
0.00999 (1.00) |
0.757 (1.00) |
0.442 (1.00) |
0.109 (1.00) |
| PIK3R1 | 13 (5%) | 269 |
0.537 (1.00) |
0.136 (1.00) |
0.156 (1.00) |
0.493 (1.00) |
0.247 (1.00) |
0.221 (1.00) |
0.444 (1.00) |
1 (1.00) |
| STK19 | 6 (2%) | 276 |
0.0718 (1.00) |
0.915 (1.00) |
0.41 (1.00) |
0.074 (1.00) |
0.25 (1.00) |
0.183 (1.00) |
1 (1.00) |
0.0345 (1.00) |
| PIK3CA | 25 (9%) | 257 |
0.0757 (1.00) |
0.118 (1.00) |
0.833 (1.00) |
0.394 (1.00) |
0.0433 (1.00) |
0.649 (1.00) |
1 (1.00) |
1 (1.00) |
| ARID1A | 12 (4%) | 270 |
0.123 (1.00) |
0.882 (1.00) |
0.0143 (1.00) |
0.0415 (1.00) |
0.344 (1.00) |
1 (1.00) |
1 (1.00) |
0.486 (1.00) |
| GAGE2B | 4 (1%) | 278 |
0.805 (1.00) |
0.8 (1.00) |
0.633 (1.00) |
1 (1.00) |
1 (1.00) |
1 (1.00) |
0.196 (1.00) |
|
| CREBZF | 5 (2%) | 277 |
0.754 (1.00) |
0.246 (1.00) |
0.173 (1.00) |
0.175 (1.00) |
0.224 (1.00) |
1 (1.00) |
0.215 (1.00) |
1 (1.00) |
| TCF12 | 8 (3%) | 274 |
0.314 (1.00) |
0.0886 (1.00) |
0.734 (1.00) |
0.44 (1.00) |
0.179 (1.00) |
0.442 (1.00) |
1 (1.00) |
1 (1.00) |
| SMARCA4 | 13 (5%) | 269 |
0.106 (1.00) |
0.145 (1.00) |
0.78 (1.00) |
0.038 (1.00) |
0.516 (1.00) |
0.0677 (1.00) |
1 (1.00) |
0.486 (1.00) |
| VAV3 | 8 (3%) | 274 |
0.426 (1.00) |
0.902 (1.00) |
0.306 (1.00) |
0.00128 (0.335) |
0.74 (1.00) |
0.701 (1.00) |
1 (1.00) |
0.356 (1.00) |
| ROBO3 | 3 (1%) | 279 |
0.724 (1.00) |
0.974 (1.00) |
0.584 (1.00) |
0.782 (1.00) |
1 (1.00) |
1 (1.00) |
1 (1.00) |
|
| IRS4 | 5 (2%) | 277 |
0.682 (1.00) |
0.98 (1.00) |
1 (1.00) |
0.197 (1.00) |
0.38 (1.00) |
1 (1.00) |
1 (1.00) |
0.239 (1.00) |
| HTRA2 | 4 (1%) | 278 |
0.848 (1.00) |
0.0732 (1.00) |
0.633 (1.00) |
0.566 (1.00) |
0.319 (1.00) |
1 (1.00) |
0.196 (1.00) |
|
| EIF1AX | 4 (1%) | 278 |
0.38 (1.00) |
0.988 (1.00) |
0.133 (1.00) |
0.911 (1.00) |
0.186 (1.00) |
0.586 (1.00) |
1 (1.00) |
1 (1.00) |
| FAM47C | 7 (2%) | 275 |
0.175 (1.00) |
0.953 (1.00) |
1 (1.00) |
0.548 (1.00) |
0.0714 (1.00) |
1 (1.00) |
1 (1.00) |
0.319 (1.00) |
| DDX5 | 4 (1%) | 278 |
0.577 (1.00) |
0.894 (1.00) |
0.633 (1.00) |
0.305 (1.00) |
0.68 (1.00) |
1 (1.00) |
1 (1.00) |
0.151 (1.00) |
| ZNF709 | 3 (1%) | 279 |
0.566 (1.00) |
0.584 (1.00) |
0.258 (1.00) |
0.495 (1.00) |
0.217 (1.00) |
0.134 (1.00) |
1 (1.00) |
|
| TRERF1 | 3 (1%) | 279 |
0.731 (1.00) |
0.698 (1.00) |
0.0839 (1.00) |
0.364 (1.00) |
0.556 (1.00) |
1 (1.00) |
1 (1.00) |
|
| BCOR | 9 (3%) | 273 |
0.958 (1.00) |
0.167 (1.00) |
0.046 (1.00) |
0.302 (1.00) |
0.48 (1.00) |
1 (1.00) |
0.355 (1.00) |
1 (1.00) |
| SRPX | 3 (1%) | 279 |
0.473 (1.00) |
0.109 (1.00) |
0.0839 (1.00) |
0.784 (1.00) |
1 (1.00) |
1 (1.00) |
1 (1.00) |
|
| DOCK5 | 5 (2%) | 277 |
0.00625 (1.00) |
0.0226 (1.00) |
1 (1.00) |
0.724 (1.00) |
1 (1.00) |
0.639 (1.00) |
1 (1.00) |
1 (1.00) |
| GIGYF2 | 4 (1%) | 278 |
0.00116 (0.305) |
0.734 (1.00) |
1 (1.00) |
0.829 (1.00) |
0.0833 (1.00) |
1 (1.00) |
1 (1.00) |
|
| NIPBL | 5 (2%) | 277 |
0.091 (1.00) |
0.0284 (1.00) |
0.389 (1.00) |
0.185 (1.00) |
1 (1.00) |
1 (1.00) |
0.239 (1.00) |
|
| ZBTB20 | 13 (5%) | 269 |
0.405 (1.00) |
0.643 (1.00) |
0.4 (1.00) |
0.95 (1.00) |
0.395 (1.00) |
0.118 (1.00) |
0.144 (1.00) |
0.486 (1.00) |
| TRIP12 | 5 (2%) | 277 |
0.218 (1.00) |
0.64 (1.00) |
1 (1.00) |
0.153 (1.00) |
0.163 (1.00) |
1 (1.00) |
1 (1.00) |
|
| KIAA0664 | 5 (2%) | 277 |
0.995 (1.00) |
0.96 (1.00) |
1 (1.00) |
0.223 (1.00) |
0.163 (1.00) |
1 (1.00) |
1 (1.00) |
P value = 4.7e-09 (logrank test), Q value = 1.3e-06
Table S1. Gene #1: 'IDH1 MUTATION STATUS' versus Clinical Feature #1: 'Time to Death'
| nPatients | nDeath | Duration Range (Median), Month | |
|---|---|---|---|
| ALL | 280 | 57 | 0.0 - 182.3 (15.0) |
| IDH1 MUTATED | 213 | 32 | 0.0 - 182.3 (15.5) |
| IDH1 WILD-TYPE | 67 | 25 | 0.1 - 133.7 (11.6) |
Figure S1. Get High-res Image Gene #1: 'IDH1 MUTATION STATUS' versus Clinical Feature #1: 'Time to Death'

P value = 0.000464 (Wilcoxon-test), Q value = 0.12
Table S2. Gene #1: 'IDH1 MUTATION STATUS' versus Clinical Feature #2: 'AGE'
| nPatients | Mean (Std.Dev) | |
|---|---|---|
| ALL | 282 | 42.7 (13.5) |
| IDH1 MUTATED | 215 | 41.0 (12.7) |
| IDH1 WILD-TYPE | 67 | 48.2 (14.6) |
Figure S2. Get High-res Image Gene #1: 'IDH1 MUTATION STATUS' versus Clinical Feature #2: 'AGE'

P value = 7.58e-07 (Wilcoxon-test), Q value = 0.00021
Table S3. Gene #2: 'TP53 MUTATION STATUS' versus Clinical Feature #2: 'AGE'
| nPatients | Mean (Std.Dev) | |
|---|---|---|
| ALL | 282 | 42.7 (13.5) |
| TP53 MUTATED | 143 | 38.7 (11.8) |
| TP53 WILD-TYPE | 139 | 46.8 (13.9) |
Figure S3. Get High-res Image Gene #2: 'TP53 MUTATION STATUS' versus Clinical Feature #2: 'AGE'

P value = 1e-05 (Fisher's exact test), Q value = 0.0027
Table S4. Gene #2: 'TP53 MUTATION STATUS' versus Clinical Feature #5: 'HISTOLOGICAL.TYPE'
| nPatients | ASTROCYTOMA | OLIGOASTROCYTOMA | OLIGODENDROGLIOMA |
|---|---|---|---|
| ALL | 94 | 76 | 112 |
| TP53 MUTATED | 64 | 50 | 29 |
| TP53 WILD-TYPE | 30 | 26 | 83 |
Figure S4. Get High-res Image Gene #2: 'TP53 MUTATION STATUS' versus Clinical Feature #5: 'HISTOLOGICAL.TYPE'

P value = 1.26e-07 (Wilcoxon-test), Q value = 3.5e-05
Table S5. Gene #3: 'ATRX MUTATION STATUS' versus Clinical Feature #2: 'AGE'
| nPatients | Mean (Std.Dev) | |
|---|---|---|
| ALL | 282 | 42.7 (13.5) |
| ATRX MUTATED | 116 | 37.6 (11.5) |
| ATRX WILD-TYPE | 166 | 46.3 (13.6) |
Figure S5. Get High-res Image Gene #3: 'ATRX MUTATION STATUS' versus Clinical Feature #2: 'AGE'
P value = 1e-05 (Fisher's exact test), Q value = 0.0027
Table S6. Gene #3: 'ATRX MUTATION STATUS' versus Clinical Feature #5: 'HISTOLOGICAL.TYPE'
| nPatients | ASTROCYTOMA | OLIGOASTROCYTOMA | OLIGODENDROGLIOMA |
|---|---|---|---|
| ALL | 94 | 76 | 112 |
| ATRX MUTATED | 47 | 43 | 26 |
| ATRX WILD-TYPE | 47 | 33 | 86 |
Figure S6. Get High-res Image Gene #3: 'ATRX MUTATION STATUS' versus Clinical Feature #5: 'HISTOLOGICAL.TYPE'
P value = 1e-05 (Fisher's exact test), Q value = 0.0027
Table S7. Gene #4: 'CIC MUTATION STATUS' versus Clinical Feature #5: 'HISTOLOGICAL.TYPE'
| nPatients | ASTROCYTOMA | OLIGOASTROCYTOMA | OLIGODENDROGLIOMA |
|---|---|---|---|
| ALL | 94 | 76 | 112 |
| CIC MUTATED | 1 | 9 | 43 |
| CIC WILD-TYPE | 93 | 67 | 69 |
Figure S7. Get High-res Image Gene #4: 'CIC MUTATION STATUS' versus Clinical Feature #5: 'HISTOLOGICAL.TYPE'

P value = 2e-05 (Fisher's exact test), Q value = 0.0054
Table S8. Gene #5: 'NOTCH1 MUTATION STATUS' versus Clinical Feature #5: 'HISTOLOGICAL.TYPE'
| nPatients | ASTROCYTOMA | OLIGOASTROCYTOMA | OLIGODENDROGLIOMA |
|---|---|---|---|
| ALL | 94 | 76 | 112 |
| NOTCH1 MUTATED | 2 | 3 | 23 |
| NOTCH1 WILD-TYPE | 92 | 73 | 89 |
Figure S8. Get High-res Image Gene #5: 'NOTCH1 MUTATION STATUS' versus Clinical Feature #5: 'HISTOLOGICAL.TYPE'

P value = 2e-05 (Fisher's exact test), Q value = 0.0054
Table S9. Gene #7: 'FUBP1 MUTATION STATUS' versus Clinical Feature #5: 'HISTOLOGICAL.TYPE'
| nPatients | ASTROCYTOMA | OLIGOASTROCYTOMA | OLIGODENDROGLIOMA |
|---|---|---|---|
| ALL | 94 | 76 | 112 |
| FUBP1 MUTATED | 1 | 3 | 22 |
| FUBP1 WILD-TYPE | 93 | 73 | 90 |
Figure S9. Get High-res Image Gene #7: 'FUBP1 MUTATION STATUS' versus Clinical Feature #5: 'HISTOLOGICAL.TYPE'

P value = 0.000493 (logrank test), Q value = 0.13
Table S10. Gene #8: 'NF1 MUTATION STATUS' versus Clinical Feature #1: 'Time to Death'
| nPatients | nDeath | Duration Range (Median), Month | |
|---|---|---|---|
| ALL | 280 | 57 | 0.0 - 182.3 (15.0) |
| NF1 MUTATED | 19 | 8 | 0.2 - 73.0 (18.0) |
| NF1 WILD-TYPE | 261 | 49 | 0.0 - 182.3 (14.9) |
Figure S10. Get High-res Image Gene #8: 'NF1 MUTATION STATUS' versus Clinical Feature #1: 'Time to Death'
P value = 3.79e-08 (logrank test), Q value = 1e-05
Table S11. Gene #11: 'PTEN MUTATION STATUS' versus Clinical Feature #1: 'Time to Death'
| nPatients | nDeath | Duration Range (Median), Month | |
|---|---|---|---|
| ALL | 280 | 57 | 0.0 - 182.3 (15.0) |
| PTEN MUTATED | 13 | 6 | 0.5 - 21.0 (10.4) |
| PTEN WILD-TYPE | 267 | 51 | 0.0 - 182.3 (15.2) |
Figure S11. Get High-res Image Gene #11: 'PTEN MUTATION STATUS' versus Clinical Feature #1: 'Time to Death'

P value = 0.000737 (Wilcoxon-test), Q value = 0.19
Table S12. Gene #11: 'PTEN MUTATION STATUS' versus Clinical Feature #2: 'AGE'
| nPatients | Mean (Std.Dev) | |
|---|---|---|
| ALL | 282 | 42.7 (13.5) |
| PTEN MUTATED | 13 | 55.3 (10.5) |
| PTEN WILD-TYPE | 269 | 42.1 (13.3) |
Figure S12. Get High-res Image Gene #11: 'PTEN MUTATION STATUS' versus Clinical Feature #2: 'AGE'

P value = 0 (logrank test), Q value = 0
Table S13. Gene #14: 'EGFR MUTATION STATUS' versus Clinical Feature #1: 'Time to Death'
| nPatients | nDeath | Duration Range (Median), Month | |
|---|---|---|---|
| ALL | 280 | 57 | 0.0 - 182.3 (15.0) |
| EGFR MUTATED | 16 | 8 | 0.5 - 13.6 (5.9) |
| EGFR WILD-TYPE | 264 | 49 | 0.0 - 182.3 (15.6) |
Figure S13. Get High-res Image Gene #14: 'EGFR MUTATION STATUS' versus Clinical Feature #1: 'Time to Death'

P value = 2.11e-07 (Wilcoxon-test), Q value = 5.8e-05
Table S14. Gene #14: 'EGFR MUTATION STATUS' versus Clinical Feature #2: 'AGE'
| nPatients | Mean (Std.Dev) | |
|---|---|---|
| ALL | 282 | 42.7 (13.5) |
| EGFR MUTATED | 16 | 61.1 (7.3) |
| EGFR WILD-TYPE | 266 | 41.6 (13.0) |
Figure S14. Get High-res Image Gene #14: 'EGFR MUTATION STATUS' versus Clinical Feature #2: 'AGE'
P value = 1.07e-06 (logrank test), Q value = 0.00029
Table S15. Gene #25: 'PLCG1 MUTATION STATUS' versus Clinical Feature #1: 'Time to Death'
| nPatients | nDeath | Duration Range (Median), Month | |
|---|---|---|---|
| ALL | 280 | 57 | 0.0 - 182.3 (15.0) |
| PLCG1 MUTATED | 4 | 3 | 6.7 - 21.0 (7.2) |
| PLCG1 WILD-TYPE | 276 | 54 | 0.0 - 182.3 (15.0) |
Figure S15. Get High-res Image Gene #25: 'PLCG1 MUTATION STATUS' versus Clinical Feature #1: 'Time to Death'

-
Mutation data file = transformed.cor.cli.txt
-
Clinical data file = LGG-TP.merged_data.txt
-
Number of patients = 282
-
Number of significantly mutated genes = 36
-
Number of selected clinical features = 8
-
Exclude genes that fewer than K tumors have mutations, K = 3
For survival clinical features, the Kaplan-Meier survival curves of tumors with and without gene mutations were plotted and the statistical significance P values were estimated by logrank test (Bland and Altman 2004) using the 'survdiff' function in R
For binary or multi-class clinical features (nominal or ordinal), two-tailed Fisher's exact tests (Fisher 1922) were used to estimate the P values using the 'fisher.test' function in R
For multiple hypothesis correction, Q value is the False Discovery Rate (FDR) analogue of the P value (Benjamini and Hochberg 1995), defined as the minimum FDR at which the test may be called significant. We used the 'Benjamini and Hochberg' method of 'p.adjust' function in R to convert P values into Q values.
In addition to the links below, the full results of the analysis summarized in this report can also be downloaded programmatically using firehose_get, or interactively from either the Broad GDAC website or TCGA Data Coordination Center Portal.