This pipeline computes the correlation between significant arm-level copy number variations (cnvs) and selected clinical features.
Testing the association between copy number variation 78 arm-level events and 8 clinical features across 400 patients, 27 significant findings detected with Q value < 0.25.
-
3q gain cnv correlated to 'Time to Death'.
-
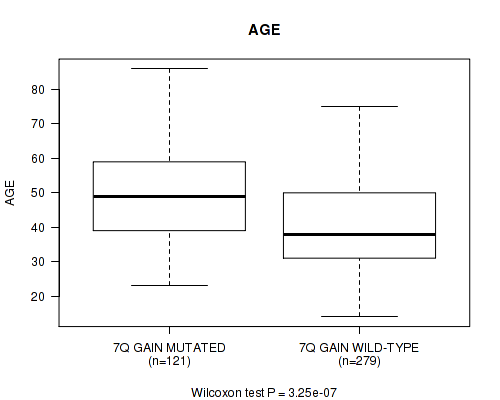
7p gain cnv correlated to 'Time to Death' and 'AGE'.
-
7q gain cnv correlated to 'Time to Death' and 'AGE'.
-
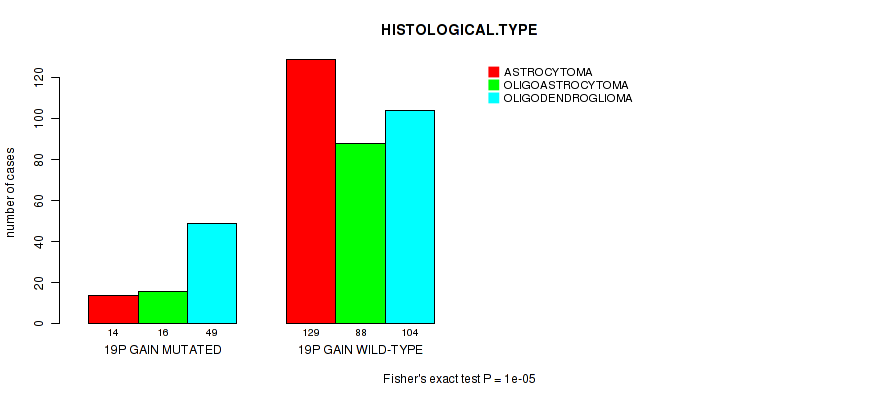
19p gain cnv correlated to 'HISTOLOGICAL.TYPE'.
-
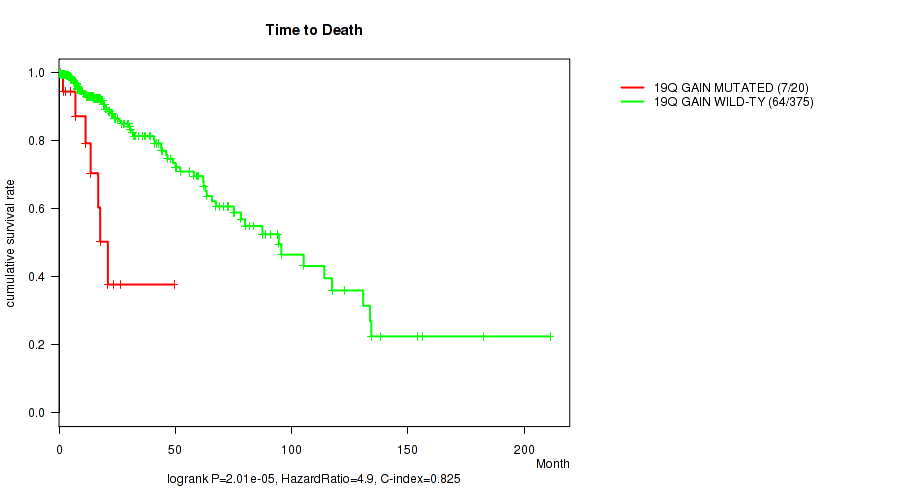
19q gain cnv correlated to 'Time to Death' and 'AGE'.
-
20p gain cnv correlated to 'Time to Death' and 'AGE'.
-
20q gain cnv correlated to 'Time to Death' and 'AGE'.
-
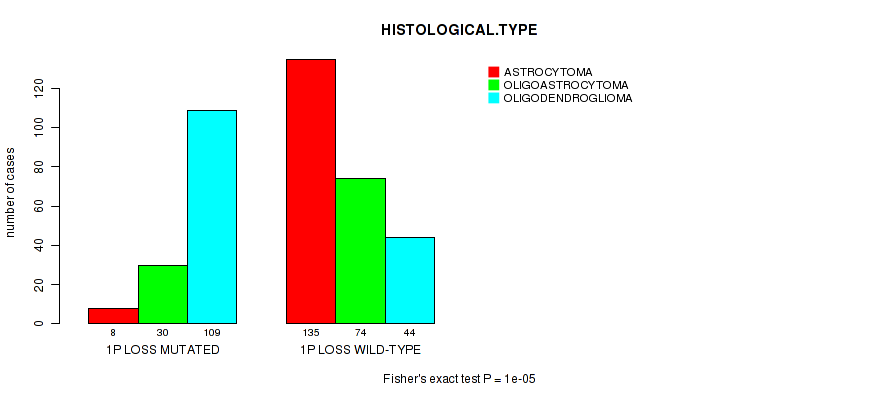
1p loss cnv correlated to 'HISTOLOGICAL.TYPE'.
-
6p loss cnv correlated to 'Time to Death'.
-
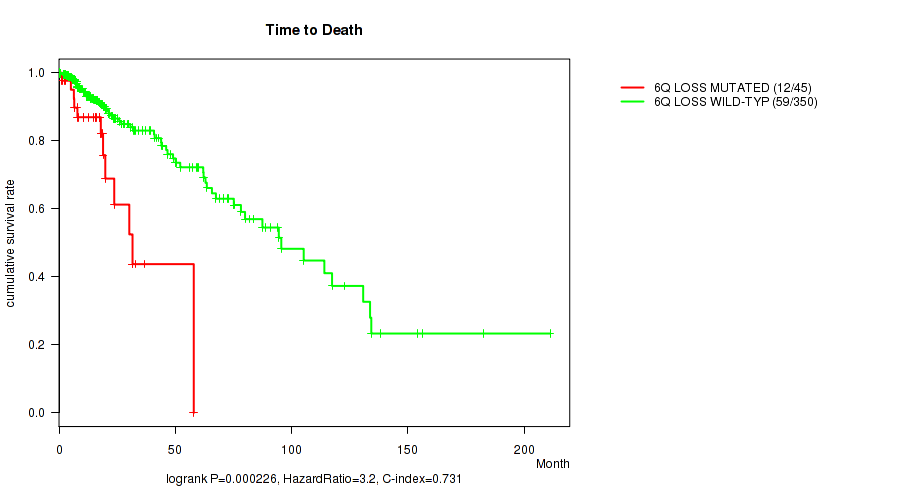
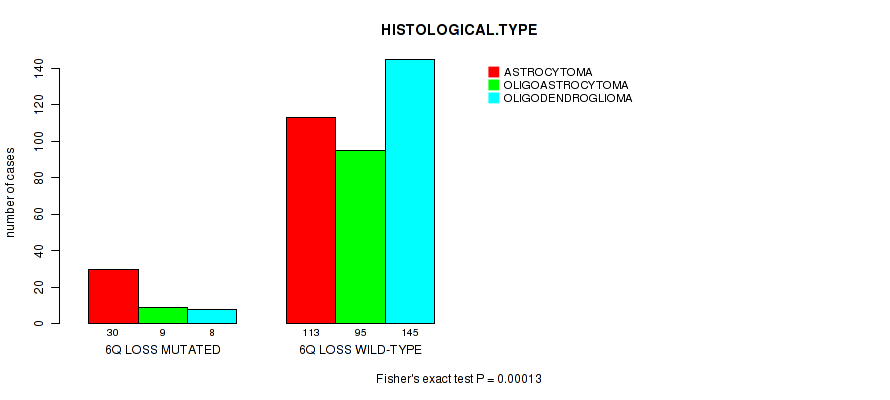
6q loss cnv correlated to 'Time to Death' and 'HISTOLOGICAL.TYPE'.
-
9p loss cnv correlated to 'Time to Death'.
-
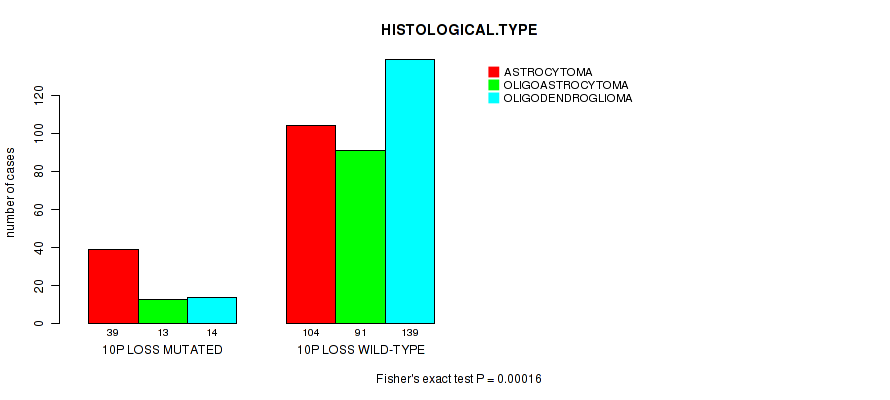
10p loss cnv correlated to 'Time to Death', 'AGE', and 'HISTOLOGICAL.TYPE'.
-
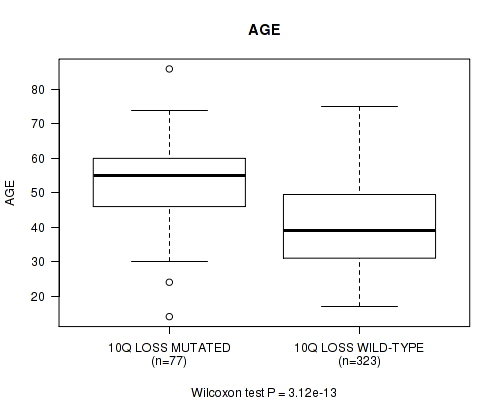
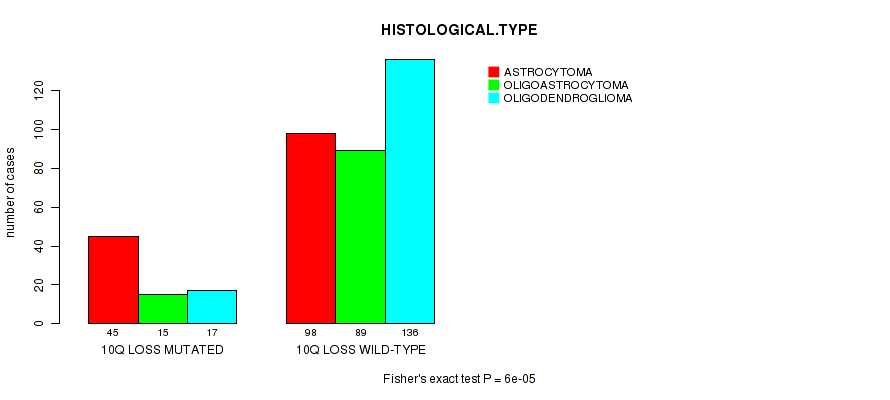
10q loss cnv correlated to 'Time to Death', 'AGE', and 'HISTOLOGICAL.TYPE'.
-
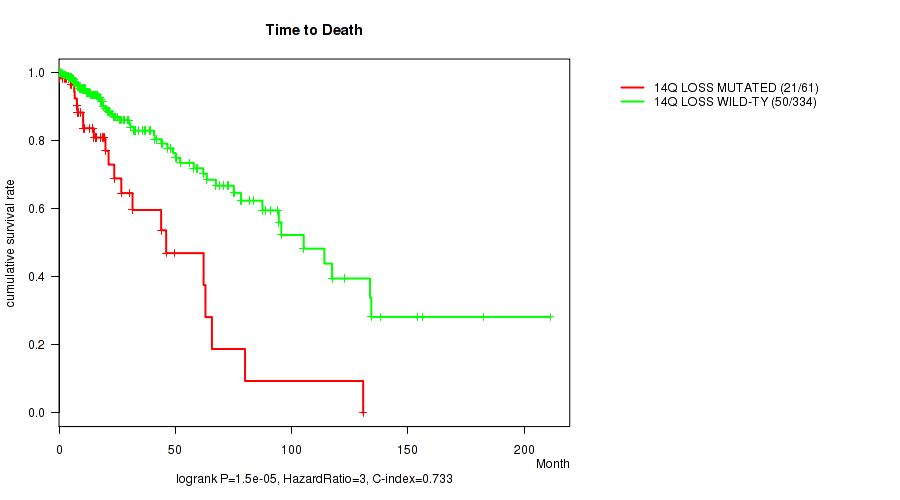
14q loss cnv correlated to 'Time to Death'.
-
19q loss cnv correlated to 'HISTOLOGICAL.TYPE'.
-
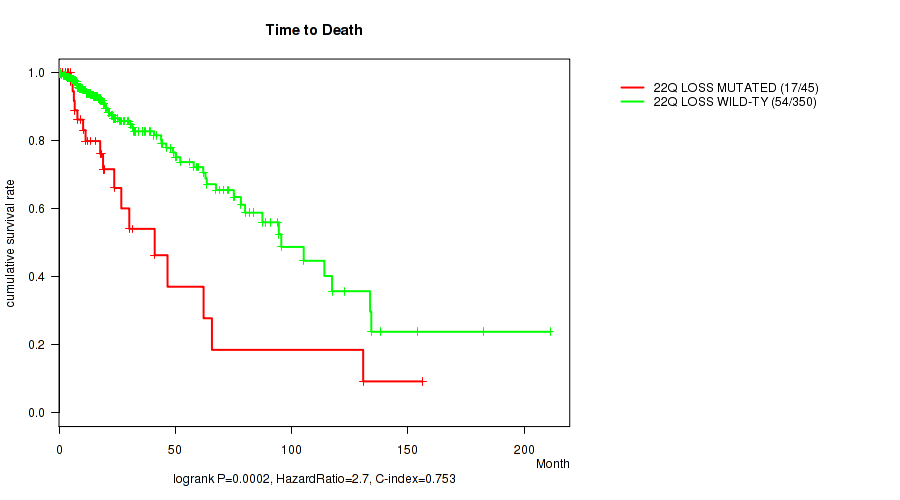
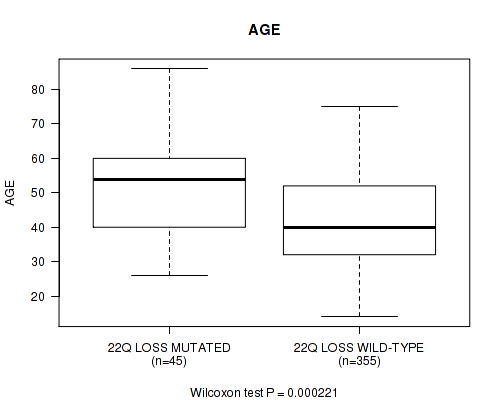
22q loss cnv correlated to 'Time to Death' and 'AGE'.
Table 1. Get Full Table Overview of the association between significant copy number variation of 78 arm-level events and 8 clinical features. Shown in the table are P values (Q values). Thresholded by Q value < 0.25, 27 significant findings detected.
|
Clinical Features |
Time to Death |
AGE | GENDER |
KARNOFSKY PERFORMANCE SCORE |
HISTOLOGICAL TYPE |
RADIATIONS RADIATION REGIMENINDICATION |
RACE | ETHNICITY | ||
| nCNV (%) | nWild-Type | logrank test | Wilcoxon-test | Fisher's exact test | Wilcoxon-test | Fisher's exact test | Fisher's exact test | Fisher's exact test | Fisher's exact test | |
| 10p loss | 66 (16%) | 334 |
0 (0) |
1.09e-13 (6.72e-11) |
0.498 (1.00) |
0.00461 (1.00) |
0.00016 (0.096) |
0.423 (1.00) |
0.015 (1.00) |
1 (1.00) |
| 10q loss | 77 (19%) | 323 |
6.06e-12 (3.74e-09) |
3.12e-13 (1.93e-10) |
0.445 (1.00) |
0.0119 (1.00) |
6e-05 (0.0362) |
0.647 (1.00) |
0.032 (1.00) |
0.745 (1.00) |
| 7p gain | 92 (23%) | 308 |
2.98e-05 (0.018) |
1.29e-06 (0.000788) |
0.122 (1.00) |
0.151 (1.00) |
0.182 (1.00) |
0.67 (1.00) |
0.0403 (1.00) |
0.759 (1.00) |
| 7q gain | 121 (30%) | 279 |
0.000128 (0.0771) |
3.25e-07 (0.000199) |
0.228 (1.00) |
0.377 (1.00) |
0.0738 (1.00) |
0.794 (1.00) |
0.0909 (1.00) |
1 (1.00) |
| 19q gain | 20 (5%) | 380 |
2.01e-05 (0.0122) |
0.000236 (0.14) |
0.819 (1.00) |
0.201 (1.00) |
0.153 (1.00) |
0.784 (1.00) |
0.127 (1.00) |
0.55 (1.00) |
| 20p gain | 36 (9%) | 364 |
7.9e-08 (4.86e-05) |
2.13e-07 (0.000131) |
0.484 (1.00) |
0.0193 (1.00) |
0.344 (1.00) |
0.834 (1.00) |
0.17 (1.00) |
1 (1.00) |
| 20q gain | 37 (9%) | 363 |
6.96e-08 (4.29e-05) |
1.16e-06 (0.000712) |
0.225 (1.00) |
0.0388 (1.00) |
0.437 (1.00) |
0.684 (1.00) |
0.275 (1.00) |
1 (1.00) |
| 6q loss | 47 (12%) | 353 |
0.000226 (0.135) |
0.0382 (1.00) |
1 (1.00) |
0.0231 (1.00) |
0.00013 (0.0781) |
0.0954 (1.00) |
0.085 (1.00) |
0.68 (1.00) |
| 22q loss | 45 (11%) | 355 |
0.0002 (0.119) |
0.000221 (0.132) |
0.526 (1.00) |
0.031 (1.00) |
0.251 (1.00) |
0.85 (1.00) |
0.172 (1.00) |
1 (1.00) |
| 3q gain | 8 (2%) | 392 |
0.000383 (0.228) |
0.0349 (1.00) |
0.308 (1.00) |
0.269 (1.00) |
0.063 (1.00) |
0.384 (1.00) |
1 (1.00) |
1 (1.00) |
| 19p gain | 79 (20%) | 321 |
0.528 (1.00) |
0.00908 (1.00) |
0.377 (1.00) |
0.0978 (1.00) |
1e-05 (0.0061) |
0.763 (1.00) |
0.494 (1.00) |
0.509 (1.00) |
| 1p loss | 147 (37%) | 253 |
0.00479 (1.00) |
0.00202 (1.00) |
0.835 (1.00) |
0.694 (1.00) |
1e-05 (0.0061) |
0.0177 (1.00) |
0.228 (1.00) |
0.788 (1.00) |
| 6p loss | 24 (6%) | 376 |
0.000177 (0.106) |
0.142 (1.00) |
0.836 (1.00) |
0.446 (1.00) |
0.0763 (1.00) |
1 (1.00) |
0.0924 (1.00) |
0.587 (1.00) |
| 9p loss | 86 (22%) | 314 |
2.65e-05 (0.016) |
0.0552 (1.00) |
0.391 (1.00) |
0.377 (1.00) |
0.0626 (1.00) |
0.0277 (1.00) |
0.603 (1.00) |
0.746 (1.00) |
| 14q loss | 63 (16%) | 337 |
1.5e-05 (0.00909) |
0.000651 (0.386) |
1 (1.00) |
0.0429 (1.00) |
0.175 (1.00) |
0.409 (1.00) |
0.111 (1.00) |
0.485 (1.00) |
| 19q loss | 166 (42%) | 234 |
0.0695 (1.00) |
0.0224 (1.00) |
0.919 (1.00) |
0.748 (1.00) |
1e-05 (0.0061) |
0.179 (1.00) |
1 (1.00) |
0.79 (1.00) |
| 1p gain | 11 (3%) | 389 |
0.00555 (1.00) |
0.047 (1.00) |
0.225 (1.00) |
0.941 (1.00) |
0.00449 (1.00) |
0.714 (1.00) |
1 (1.00) |
1 (1.00) |
| 1q gain | 18 (4%) | 382 |
0.424 (1.00) |
0.000959 (0.566) |
0.339 (1.00) |
0.0892 (1.00) |
0.163 (1.00) |
0.565 (1.00) |
1 (1.00) |
1 (1.00) |
| 2p gain | 10 (2%) | 390 |
0.703 (1.00) |
0.208 (1.00) |
0.754 (1.00) |
0.21 (1.00) |
0.52 (1.00) |
1 (1.00) |
1 (1.00) |
0.311 (1.00) |
| 2q gain | 9 (2%) | 391 |
0.77 (1.00) |
0.44 (1.00) |
0.515 (1.00) |
0.21 (1.00) |
0.438 (1.00) |
1 (1.00) |
1 (1.00) |
0.282 (1.00) |
| 3p gain | 11 (3%) | 389 |
0.00116 (0.681) |
0.092 (1.00) |
0.546 (1.00) |
0.696 (1.00) |
0.023 (1.00) |
0.714 (1.00) |
1 (1.00) |
1 (1.00) |
| 4p gain | 9 (2%) | 391 |
0.288 (1.00) |
0.651 (1.00) |
0.737 (1.00) |
0.719 (1.00) |
0.0717 (1.00) |
0.69 (1.00) |
0.332 (1.00) |
1 (1.00) |
| 4q gain | 3 (1%) | 397 |
0.662 (1.00) |
0.393 (1.00) |
1 (1.00) |
0.628 (1.00) |
1 (1.00) |
1 (1.00) |
1 (1.00) |
|
| 5p gain | 8 (2%) | 392 |
0.62 (1.00) |
0.269 (1.00) |
0.735 (1.00) |
0.974 (1.00) |
0.232 (1.00) |
0.691 (1.00) |
0.0723 (1.00) |
1 (1.00) |
| 5q gain | 5 (1%) | 395 |
0.453 (1.00) |
0.614 (1.00) |
0.658 (1.00) |
0.96 (1.00) |
0.644 (1.00) |
0.591 (1.00) |
0.0373 (1.00) |
1 (1.00) |
| 6p gain | 7 (2%) | 393 |
0.777 (1.00) |
0.109 (1.00) |
0.248 (1.00) |
0.96 (1.00) |
0.183 (1.00) |
0.654 (1.00) |
1 (1.00) |
1 (1.00) |
| 8p gain | 37 (9%) | 363 |
0.712 (1.00) |
0.889 (1.00) |
0.489 (1.00) |
0.926 (1.00) |
0.205 (1.00) |
0.684 (1.00) |
1 (1.00) |
1 (1.00) |
| 8q gain | 44 (11%) | 356 |
0.649 (1.00) |
0.451 (1.00) |
0.521 (1.00) |
0.655 (1.00) |
0.0181 (1.00) |
1 (1.00) |
0.753 (1.00) |
1 (1.00) |
| 9p gain | 14 (4%) | 386 |
0.0399 (1.00) |
0.0141 (1.00) |
0.0523 (1.00) |
0.417 (1.00) |
0.403 (1.00) |
1 (1.00) |
1 (1.00) |
1 (1.00) |
| 9q gain | 19 (5%) | 381 |
0.0247 (1.00) |
0.0122 (1.00) |
0.00897 (1.00) |
0.348 (1.00) |
0.13 (1.00) |
0.777 (1.00) |
0.574 (1.00) |
0.55 (1.00) |
| 10p gain | 38 (10%) | 362 |
0.749 (1.00) |
0.0609 (1.00) |
0.231 (1.00) |
0.215 (1.00) |
0.0212 (1.00) |
0.00152 (0.892) |
1 (1.00) |
0.0458 (1.00) |
| 10q gain | 7 (2%) | 393 |
0.766 (1.00) |
0.303 (1.00) |
0.141 (1.00) |
0.235 (1.00) |
0.114 (1.00) |
0.187 (1.00) |
0.269 (1.00) |
0.219 (1.00) |
| 11p gain | 27 (7%) | 373 |
0.524 (1.00) |
0.0225 (1.00) |
0.232 (1.00) |
0.827 (1.00) |
0.0475 (1.00) |
1 (1.00) |
1 (1.00) |
1 (1.00) |
| 11q gain | 47 (12%) | 353 |
0.548 (1.00) |
0.0113 (1.00) |
0.118 (1.00) |
0.578 (1.00) |
0.2 (1.00) |
1 (1.00) |
0.772 (1.00) |
1 (1.00) |
| 12p gain | 27 (7%) | 373 |
0.799 (1.00) |
0.539 (1.00) |
0.159 (1.00) |
0.556 (1.00) |
0.697 (1.00) |
1 (1.00) |
0.245 (1.00) |
1 (1.00) |
| 12q gain | 13 (3%) | 387 |
0.00165 (0.966) |
0.2 (1.00) |
0.403 (1.00) |
0.202 (1.00) |
1 (1.00) |
0.741 (1.00) |
0.103 (1.00) |
1 (1.00) |
| 13q gain | 5 (1%) | 395 |
0.493 (1.00) |
0.814 (1.00) |
1 (1.00) |
0.0235 (1.00) |
0.851 (1.00) |
0.591 (1.00) |
1 (1.00) |
1 (1.00) |
| 14q gain | 3 (1%) | 397 |
0.429 (1.00) |
0.22 (1.00) |
1 (1.00) |
1 (1.00) |
0.126 (1.00) |
1 (1.00) |
1 (1.00) |
|
| 15q gain | 8 (2%) | 392 |
0.121 (1.00) |
0.0102 (1.00) |
0.475 (1.00) |
0.27 (1.00) |
0.234 (1.00) |
1 (1.00) |
1 (1.00) |
1 (1.00) |
| 16p gain | 14 (4%) | 386 |
0.316 (1.00) |
0.0308 (1.00) |
0.413 (1.00) |
0.434 (1.00) |
0.291 (1.00) |
0.523 (1.00) |
0.442 (1.00) |
1 (1.00) |
| 16q gain | 17 (4%) | 383 |
0.178 (1.00) |
0.683 (1.00) |
0.465 (1.00) |
0.906 (1.00) |
0.029 (1.00) |
0.55 (1.00) |
0.514 (1.00) |
1 (1.00) |
| 17p gain | 17 (4%) | 383 |
0.0527 (1.00) |
0.15 (1.00) |
0.318 (1.00) |
0.724 (1.00) |
0.1 (1.00) |
1 (1.00) |
0.132 (1.00) |
0.488 (1.00) |
| 17q gain | 19 (5%) | 381 |
0.0102 (1.00) |
0.346 (1.00) |
0.346 (1.00) |
0.916 (1.00) |
0.176 (1.00) |
1 (1.00) |
0.142 (1.00) |
0.488 (1.00) |
| 18p gain | 12 (3%) | 388 |
0.0585 (1.00) |
0.65 (1.00) |
1 (1.00) |
0.415 (1.00) |
0.325 (1.00) |
1 (1.00) |
0.418 (1.00) |
1 (1.00) |
| 18q gain | 9 (2%) | 391 |
0.132 (1.00) |
0.588 (1.00) |
0.737 (1.00) |
0.899 (1.00) |
0.481 (1.00) |
0.69 (1.00) |
0.331 (1.00) |
1 (1.00) |
| 21q gain | 21 (5%) | 379 |
0.19 (1.00) |
0.00774 (1.00) |
0.501 (1.00) |
0.182 (1.00) |
0.815 (1.00) |
0.792 (1.00) |
0.18 (1.00) |
1 (1.00) |
| 22q gain | 14 (4%) | 386 |
0.883 (1.00) |
0.0516 (1.00) |
1 (1.00) |
0.152 (1.00) |
0.00947 (1.00) |
1 (1.00) |
1 (1.00) |
0.367 (1.00) |
| xq gain | 28 (7%) | 372 |
0.91 (1.00) |
0.539 (1.00) |
0.00286 (1.00) |
0.473 (1.00) |
0.101 (1.00) |
0.479 (1.00) |
0.0931 (1.00) |
0.311 (1.00) |
| 1q loss | 18 (4%) | 382 |
0.961 (1.00) |
0.047 (1.00) |
0.339 (1.00) |
0.234 (1.00) |
0.114 (1.00) |
0.251 (1.00) |
0.0193 (1.00) |
0.509 (1.00) |
| 2p loss | 14 (4%) | 386 |
0.232 (1.00) |
0.939 (1.00) |
0.283 (1.00) |
0.958 (1.00) |
0.785 (1.00) |
1 (1.00) |
1 (1.00) |
1 (1.00) |
| 2q loss | 13 (3%) | 387 |
0.884 (1.00) |
0.136 (1.00) |
0.403 (1.00) |
0.417 (1.00) |
0.109 (1.00) |
1 (1.00) |
1 (1.00) |
1 (1.00) |
| 3p loss | 19 (5%) | 381 |
0.0248 (1.00) |
0.952 (1.00) |
0.346 (1.00) |
0.00077 (0.456) |
0.482 (1.00) |
1 (1.00) |
1 (1.00) |
0.158 (1.00) |
| 3q loss | 23 (6%) | 377 |
0.0227 (1.00) |
0.482 (1.00) |
0.0857 (1.00) |
0.155 (1.00) |
0.927 (1.00) |
0.612 (1.00) |
0.648 (1.00) |
0.218 (1.00) |
| 4p loss | 56 (14%) | 344 |
0.773 (1.00) |
0.00233 (1.00) |
0.112 (1.00) |
0.634 (1.00) |
0.00231 (1.00) |
0.228 (1.00) |
0.512 (1.00) |
0.142 (1.00) |
| 4q loss | 72 (18%) | 328 |
0.836 (1.00) |
0.133 (1.00) |
0.24 (1.00) |
0.917 (1.00) |
0.00539 (1.00) |
0.351 (1.00) |
0.714 (1.00) |
0.0838 (1.00) |
| 5p loss | 28 (7%) | 372 |
0.866 (1.00) |
0.267 (1.00) |
0.695 (1.00) |
0.0929 (1.00) |
0.0146 (1.00) |
0.0158 (1.00) |
0.691 (1.00) |
0.614 (1.00) |
| 5q loss | 28 (7%) | 372 |
0.0513 (1.00) |
0.274 (1.00) |
0.327 (1.00) |
0.436 (1.00) |
0.0522 (1.00) |
0.0332 (1.00) |
0.688 (1.00) |
1 (1.00) |
| 7p loss | 3 (1%) | 397 |
0.469 (1.00) |
0.611 (1.00) |
0.585 (1.00) |
0.631 (1.00) |
1 (1.00) |
1 (1.00) |
1 (1.00) |
|
| 7q loss | 3 (1%) | 397 |
0.634 (1.00) |
0.906 (1.00) |
1 (1.00) |
0.899 (1.00) |
0.627 (1.00) |
1 (1.00) |
1 (1.00) |
1 (1.00) |
| 8p loss | 13 (3%) | 387 |
0.0366 (1.00) |
0.177 (1.00) |
0.781 (1.00) |
0.135 (1.00) |
0.164 (1.00) |
0.497 (1.00) |
0.107 (1.00) |
0.418 (1.00) |
| 8q loss | 9 (2%) | 391 |
0.00933 (1.00) |
0.161 (1.00) |
0.515 (1.00) |
0.302 (1.00) |
0.482 (1.00) |
1 (1.00) |
0.101 (1.00) |
0.311 (1.00) |
| 9q loss | 34 (8%) | 366 |
0.00806 (1.00) |
0.177 (1.00) |
0.857 (1.00) |
0.015 (1.00) |
1 (1.00) |
0.831 (1.00) |
0.194 (1.00) |
0.632 (1.00) |
| 11p loss | 49 (12%) | 351 |
0.424 (1.00) |
0.376 (1.00) |
0.357 (1.00) |
0.114 (1.00) |
0.0404 (1.00) |
0.464 (1.00) |
1 (1.00) |
1 (1.00) |
| 11q loss | 17 (4%) | 383 |
0.0132 (1.00) |
0.102 (1.00) |
0.808 (1.00) |
0.0773 (1.00) |
0.0527 (1.00) |
0.382 (1.00) |
1 (1.00) |
0.509 (1.00) |
| 12p loss | 18 (4%) | 382 |
0.856 (1.00) |
0.237 (1.00) |
0.634 (1.00) |
0.802 (1.00) |
0.199 (1.00) |
0.565 (1.00) |
1 (1.00) |
1 (1.00) |
| 12q loss | 37 (9%) | 363 |
0.476 (1.00) |
0.208 (1.00) |
0.863 (1.00) |
0.576 (1.00) |
0.0307 (1.00) |
0.533 (1.00) |
0.723 (1.00) |
0.379 (1.00) |
| 13q loss | 94 (24%) | 306 |
0.182 (1.00) |
0.924 (1.00) |
0.0962 (1.00) |
0.405 (1.00) |
0.558 (1.00) |
0.0327 (1.00) |
0.238 (1.00) |
0.536 (1.00) |
| 15q loss | 36 (9%) | 364 |
0.245 (1.00) |
0.529 (1.00) |
0.599 (1.00) |
0.965 (1.00) |
0.685 (1.00) |
1 (1.00) |
0.715 (1.00) |
0.379 (1.00) |
| 16p loss | 10 (2%) | 390 |
0.226 (1.00) |
0.000879 (0.52) |
0.523 (1.00) |
0.242 (1.00) |
0.718 (1.00) |
1 (1.00) |
1 (1.00) |
0.339 (1.00) |
| 16q loss | 18 (4%) | 382 |
0.148 (1.00) |
0.00098 (0.577) |
1 (1.00) |
0.525 (1.00) |
0.508 (1.00) |
0.565 (1.00) |
0.558 (1.00) |
0.53 (1.00) |
| 17p loss | 12 (3%) | 388 |
0.00697 (1.00) |
0.0538 (1.00) |
0.381 (1.00) |
0.00296 (1.00) |
0.615 (1.00) |
0.478 (1.00) |
1 (1.00) |
0.0786 (1.00) |
| 17q loss | 8 (2%) | 392 |
0.304 (1.00) |
0.174 (1.00) |
0.735 (1.00) |
0.0326 (1.00) |
0.824 (1.00) |
0.691 (1.00) |
1 (1.00) |
0.0366 (1.00) |
| 18p loss | 58 (14%) | 342 |
0.864 (1.00) |
0.0188 (1.00) |
0.0647 (1.00) |
0.7 (1.00) |
0.254 (1.00) |
0.61 (1.00) |
0.0914 (1.00) |
0.448 (1.00) |
| 18q loss | 53 (13%) | 347 |
0.659 (1.00) |
0.046 (1.00) |
0.374 (1.00) |
0.979 (1.00) |
0.162 (1.00) |
0.861 (1.00) |
0.103 (1.00) |
0.428 (1.00) |
| 19p loss | 18 (4%) | 382 |
0.269 (1.00) |
0.827 (1.00) |
0.634 (1.00) |
0.342 (1.00) |
0.954 (1.00) |
0.0889 (1.00) |
0.0227 (1.00) |
0.488 (1.00) |
| 20p loss | 3 (1%) | 397 |
0.49 (1.00) |
0.449 (1.00) |
0.585 (1.00) |
1 (1.00) |
0.531 (1.00) |
1 (1.00) |
1 (1.00) |
|
| 21q loss | 24 (6%) | 376 |
0.672 (1.00) |
0.758 (1.00) |
0.672 (1.00) |
0.00326 (1.00) |
0.018 (1.00) |
0.619 (1.00) |
1 (1.00) |
0.604 (1.00) |
| xq loss | 53 (13%) | 347 |
0.0159 (1.00) |
0.326 (1.00) |
0.374 (1.00) |
0.507 (1.00) |
0.834 (1.00) |
1 (1.00) |
0.496 (1.00) |
1 (1.00) |
P value = 0.000383 (logrank test), Q value = 0.23
Table S1. Gene #6: '3q gain' versus Clinical Feature #1: 'Time to Death'
| nPatients | nDeath | Duration Range (Median), Month | |
|---|---|---|---|
| ALL | 395 | 71 | 0.0 - 211.2 (15.0) |
| 3Q GAIN MUTATED | 8 | 4 | 0.2 - 47.8 (9.1) |
| 3Q GAIN WILD-TYPE | 387 | 67 | 0.0 - 211.2 (15.0) |
Figure S1. Get High-res Image Gene #6: '3q gain' versus Clinical Feature #1: 'Time to Death'

P value = 2.98e-05 (logrank test), Q value = 0.018
Table S2. Gene #12: '7p gain' versus Clinical Feature #1: 'Time to Death'
| nPatients | nDeath | Duration Range (Median), Month | |
|---|---|---|---|
| ALL | 395 | 71 | 0.0 - 211.2 (15.0) |
| 7P GAIN MUTATED | 92 | 31 | 0.1 - 211.2 (14.0) |
| 7P GAIN WILD-TYPE | 303 | 40 | 0.0 - 182.3 (15.0) |
Figure S2. Get High-res Image Gene #12: '7p gain' versus Clinical Feature #1: 'Time to Death'
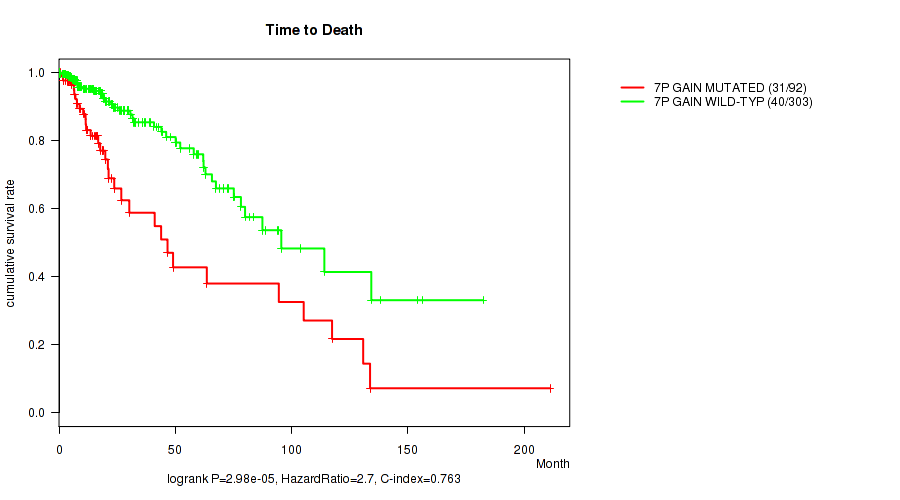
P value = 1.29e-06 (Wilcoxon-test), Q value = 0.00079
Table S3. Gene #12: '7p gain' versus Clinical Feature #2: 'AGE'
| nPatients | Mean (Std.Dev) | |
|---|---|---|
| ALL | 400 | 43.2 (13.3) |
| 7P GAIN MUTATED | 92 | 49.2 (13.1) |
| 7P GAIN WILD-TYPE | 308 | 41.5 (12.9) |
Figure S3. Get High-res Image Gene #12: '7p gain' versus Clinical Feature #2: 'AGE'

P value = 0.000128 (logrank test), Q value = 0.077
Table S4. Gene #13: '7q gain' versus Clinical Feature #1: 'Time to Death'
| nPatients | nDeath | Duration Range (Median), Month | |
|---|---|---|---|
| ALL | 395 | 71 | 0.0 - 211.2 (15.0) |
| 7Q GAIN MUTATED | 119 | 36 | 0.1 - 211.2 (15.3) |
| 7Q GAIN WILD-TYPE | 276 | 35 | 0.0 - 182.3 (15.0) |
Figure S4. Get High-res Image Gene #13: '7q gain' versus Clinical Feature #1: 'Time to Death'

P value = 3.25e-07 (Wilcoxon-test), Q value = 2e-04
Table S5. Gene #13: '7q gain' versus Clinical Feature #2: 'AGE'
| nPatients | Mean (Std.Dev) | |
|---|---|---|
| ALL | 400 | 43.2 (13.3) |
| 7Q GAIN MUTATED | 121 | 48.4 (13.2) |
| 7Q GAIN WILD-TYPE | 279 | 41.0 (12.8) |
Figure S5. Get High-res Image Gene #13: '7q gain' versus Clinical Feature #2: 'AGE'
P value = 1e-05 (Fisher's exact test), Q value = 0.0061
Table S6. Gene #33: '19p gain' versus Clinical Feature #5: 'HISTOLOGICAL.TYPE'
| nPatients | ASTROCYTOMA | OLIGOASTROCYTOMA | OLIGODENDROGLIOMA |
|---|---|---|---|
| ALL | 143 | 104 | 153 |
| 19P GAIN MUTATED | 14 | 16 | 49 |
| 19P GAIN WILD-TYPE | 129 | 88 | 104 |
Figure S6. Get High-res Image Gene #33: '19p gain' versus Clinical Feature #5: 'HISTOLOGICAL.TYPE'
P value = 2.01e-05 (logrank test), Q value = 0.012
Table S7. Gene #34: '19q gain' versus Clinical Feature #1: 'Time to Death'
| nPatients | nDeath | Duration Range (Median), Month | |
|---|---|---|---|
| ALL | 395 | 71 | 0.0 - 211.2 (15.0) |
| 19Q GAIN MUTATED | 20 | 7 | 0.5 - 49.5 (11.8) |
| 19Q GAIN WILD-TYPE | 375 | 64 | 0.0 - 211.2 (15.1) |
Figure S7. Get High-res Image Gene #34: '19q gain' versus Clinical Feature #1: 'Time to Death'
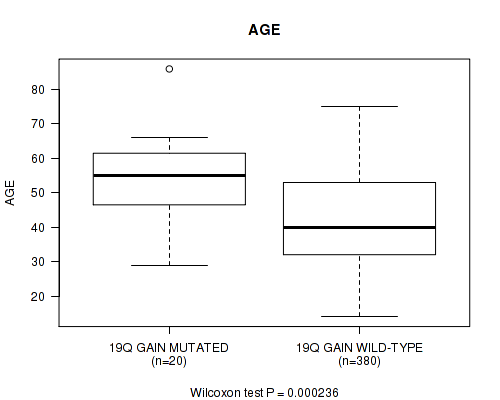
P value = 0.000236 (Wilcoxon-test), Q value = 0.14
Table S8. Gene #34: '19q gain' versus Clinical Feature #2: 'AGE'
| nPatients | Mean (Std.Dev) | |
|---|---|---|
| ALL | 400 | 43.2 (13.3) |
| 19Q GAIN MUTATED | 20 | 54.4 (12.2) |
| 19Q GAIN WILD-TYPE | 380 | 42.7 (13.2) |
Figure S8. Get High-res Image Gene #34: '19q gain' versus Clinical Feature #2: 'AGE'
P value = 7.9e-08 (logrank test), Q value = 4.9e-05
Table S9. Gene #35: '20p gain' versus Clinical Feature #1: 'Time to Death'
| nPatients | nDeath | Duration Range (Median), Month | |
|---|---|---|---|
| ALL | 395 | 71 | 0.0 - 211.2 (15.0) |
| 20P GAIN MUTATED | 36 | 13 | 0.5 - 49.5 (12.2) |
| 20P GAIN WILD-TYPE | 359 | 58 | 0.0 - 211.2 (15.1) |
Figure S9. Get High-res Image Gene #35: '20p gain' versus Clinical Feature #1: 'Time to Death'

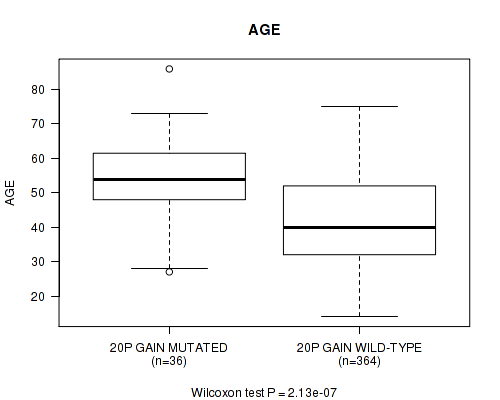
P value = 2.13e-07 (Wilcoxon-test), Q value = 0.00013
Table S10. Gene #35: '20p gain' versus Clinical Feature #2: 'AGE'
| nPatients | Mean (Std.Dev) | |
|---|---|---|
| ALL | 400 | 43.2 (13.3) |
| 20P GAIN MUTATED | 36 | 54.9 (12.3) |
| 20P GAIN WILD-TYPE | 364 | 42.1 (12.9) |
Figure S10. Get High-res Image Gene #35: '20p gain' versus Clinical Feature #2: 'AGE'
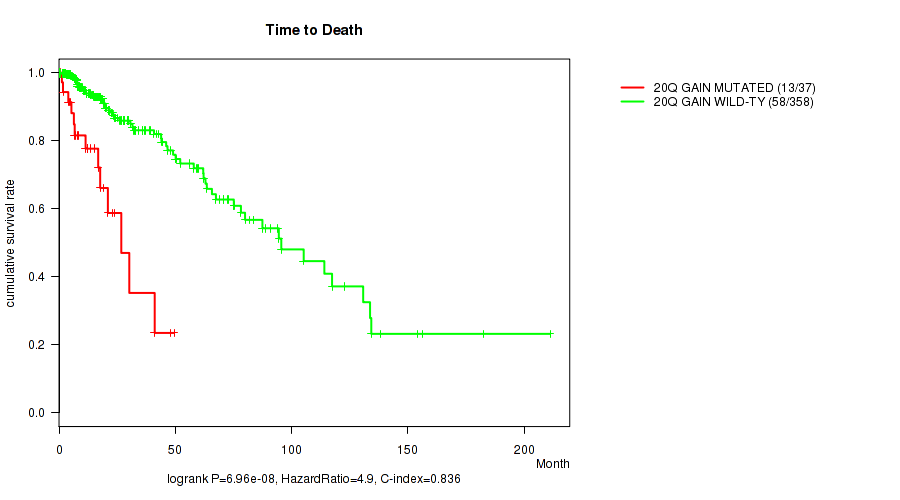
P value = 6.96e-08 (logrank test), Q value = 4.3e-05
Table S11. Gene #36: '20q gain' versus Clinical Feature #1: 'Time to Death'
| nPatients | nDeath | Duration Range (Median), Month | |
|---|---|---|---|
| ALL | 395 | 71 | 0.0 - 211.2 (15.0) |
| 20Q GAIN MUTATED | 37 | 13 | 0.5 - 49.5 (12.2) |
| 20Q GAIN WILD-TYPE | 358 | 58 | 0.0 - 211.2 (15.1) |
Figure S11. Get High-res Image Gene #36: '20q gain' versus Clinical Feature #1: 'Time to Death'
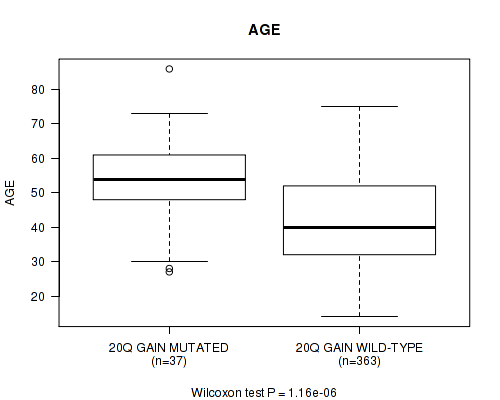
P value = 1.16e-06 (Wilcoxon-test), Q value = 0.00071
Table S12. Gene #36: '20q gain' versus Clinical Feature #2: 'AGE'
| nPatients | Mean (Std.Dev) | |
|---|---|---|
| ALL | 400 | 43.2 (13.3) |
| 20Q GAIN MUTATED | 37 | 54.1 (13.1) |
| 20Q GAIN WILD-TYPE | 363 | 42.1 (12.9) |
Figure S12. Get High-res Image Gene #36: '20q gain' versus Clinical Feature #2: 'AGE'
P value = 1e-05 (Fisher's exact test), Q value = 0.0061
Table S13. Gene #40: '1p loss' versus Clinical Feature #5: 'HISTOLOGICAL.TYPE'
| nPatients | ASTROCYTOMA | OLIGOASTROCYTOMA | OLIGODENDROGLIOMA |
|---|---|---|---|
| ALL | 143 | 104 | 153 |
| 1P LOSS MUTATED | 8 | 30 | 109 |
| 1P LOSS WILD-TYPE | 135 | 74 | 44 |
Figure S13. Get High-res Image Gene #40: '1p loss' versus Clinical Feature #5: 'HISTOLOGICAL.TYPE'
P value = 0.000177 (logrank test), Q value = 0.11
Table S14. Gene #50: '6p loss' versus Clinical Feature #1: 'Time to Death'
| nPatients | nDeath | Duration Range (Median), Month | |
|---|---|---|---|
| ALL | 395 | 71 | 0.0 - 211.2 (15.0) |
| 6P LOSS MUTATED | 23 | 8 | 0.2 - 48.4 (15.7) |
| 6P LOSS WILD-TYPE | 372 | 63 | 0.0 - 211.2 (14.9) |
Figure S14. Get High-res Image Gene #50: '6p loss' versus Clinical Feature #1: 'Time to Death'

P value = 0.000226 (logrank test), Q value = 0.13
Table S15. Gene #51: '6q loss' versus Clinical Feature #1: 'Time to Death'
| nPatients | nDeath | Duration Range (Median), Month | |
|---|---|---|---|
| ALL | 395 | 71 | 0.0 - 211.2 (15.0) |
| 6Q LOSS MUTATED | 45 | 12 | 0.1 - 57.9 (16.1) |
| 6Q LOSS WILD-TYPE | 350 | 59 | 0.0 - 211.2 (14.7) |
Figure S15. Get High-res Image Gene #51: '6q loss' versus Clinical Feature #1: 'Time to Death'
P value = 0.00013 (Fisher's exact test), Q value = 0.078
Table S16. Gene #51: '6q loss' versus Clinical Feature #5: 'HISTOLOGICAL.TYPE'
| nPatients | ASTROCYTOMA | OLIGOASTROCYTOMA | OLIGODENDROGLIOMA |
|---|---|---|---|
| ALL | 143 | 104 | 153 |
| 6Q LOSS MUTATED | 30 | 9 | 8 |
| 6Q LOSS WILD-TYPE | 113 | 95 | 145 |
Figure S16. Get High-res Image Gene #51: '6q loss' versus Clinical Feature #5: 'HISTOLOGICAL.TYPE'
P value = 2.65e-05 (logrank test), Q value = 0.016
Table S17. Gene #56: '9p loss' versus Clinical Feature #1: 'Time to Death'
| nPatients | nDeath | Duration Range (Median), Month | |
|---|---|---|---|
| ALL | 395 | 71 | 0.0 - 211.2 (15.0) |
| 9P LOSS MUTATED | 85 | 26 | 0.1 - 117.4 (15.0) |
| 9P LOSS WILD-TYPE | 310 | 45 | 0.0 - 211.2 (15.0) |
Figure S17. Get High-res Image Gene #56: '9p loss' versus Clinical Feature #1: 'Time to Death'

P value = 0 (logrank test), Q value = 0
Table S18. Gene #58: '10p loss' versus Clinical Feature #1: 'Time to Death'
| nPatients | nDeath | Duration Range (Median), Month | |
|---|---|---|---|
| ALL | 395 | 71 | 0.0 - 211.2 (15.0) |
| 10P LOSS MUTATED | 66 | 30 | 0.1 - 134.3 (11.8) |
| 10P LOSS WILD-TYPE | 329 | 41 | 0.0 - 211.2 (15.3) |
Figure S18. Get High-res Image Gene #58: '10p loss' versus Clinical Feature #1: 'Time to Death'

P value = 1.09e-13 (Wilcoxon-test), Q value = 6.7e-11
Table S19. Gene #58: '10p loss' versus Clinical Feature #2: 'AGE'
| nPatients | Mean (Std.Dev) | |
|---|---|---|
| ALL | 400 | 43.2 (13.3) |
| 10P LOSS MUTATED | 66 | 54.6 (11.5) |
| 10P LOSS WILD-TYPE | 334 | 41.0 (12.5) |
Figure S19. Get High-res Image Gene #58: '10p loss' versus Clinical Feature #2: 'AGE'

P value = 0.00016 (Fisher's exact test), Q value = 0.096
Table S20. Gene #58: '10p loss' versus Clinical Feature #5: 'HISTOLOGICAL.TYPE'
| nPatients | ASTROCYTOMA | OLIGOASTROCYTOMA | OLIGODENDROGLIOMA |
|---|---|---|---|
| ALL | 143 | 104 | 153 |
| 10P LOSS MUTATED | 39 | 13 | 14 |
| 10P LOSS WILD-TYPE | 104 | 91 | 139 |
Figure S20. Get High-res Image Gene #58: '10p loss' versus Clinical Feature #5: 'HISTOLOGICAL.TYPE'
P value = 6.06e-12 (logrank test), Q value = 3.7e-09
Table S21. Gene #59: '10q loss' versus Clinical Feature #1: 'Time to Death'
| nPatients | nDeath | Duration Range (Median), Month | |
|---|---|---|---|
| ALL | 395 | 71 | 0.0 - 211.2 (15.0) |
| 10Q LOSS MUTATED | 76 | 34 | 0.1 - 156.2 (12.3) |
| 10Q LOSS WILD-TYPE | 319 | 37 | 0.0 - 211.2 (15.2) |
Figure S21. Get High-res Image Gene #59: '10q loss' versus Clinical Feature #1: 'Time to Death'
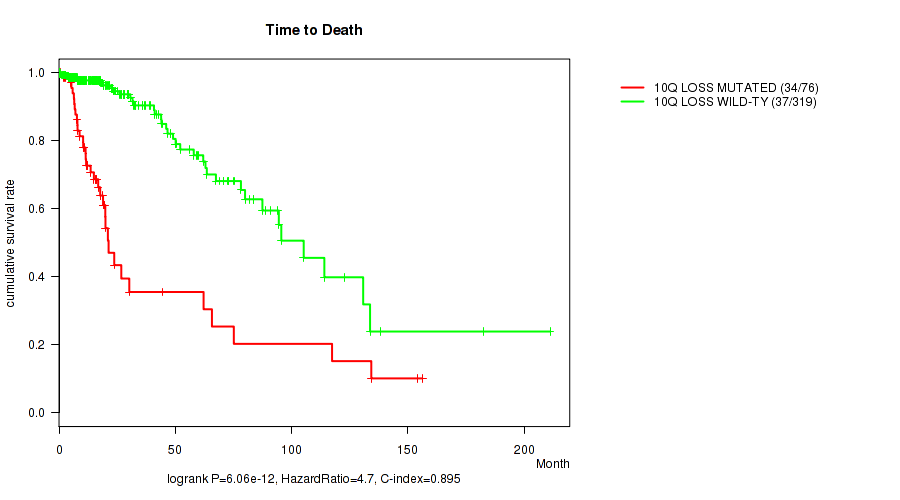
P value = 3.12e-13 (Wilcoxon-test), Q value = 1.9e-10
Table S22. Gene #59: '10q loss' versus Clinical Feature #2: 'AGE'
| nPatients | Mean (Std.Dev) | |
|---|---|---|
| ALL | 400 | 43.2 (13.3) |
| 10Q LOSS MUTATED | 77 | 53.3 (12.5) |
| 10Q LOSS WILD-TYPE | 323 | 40.9 (12.4) |
Figure S22. Get High-res Image Gene #59: '10q loss' versus Clinical Feature #2: 'AGE'
P value = 6e-05 (Fisher's exact test), Q value = 0.036
Table S23. Gene #59: '10q loss' versus Clinical Feature #5: 'HISTOLOGICAL.TYPE'
| nPatients | ASTROCYTOMA | OLIGOASTROCYTOMA | OLIGODENDROGLIOMA |
|---|---|---|---|
| ALL | 143 | 104 | 153 |
| 10Q LOSS MUTATED | 45 | 15 | 17 |
| 10Q LOSS WILD-TYPE | 98 | 89 | 136 |
Figure S23. Get High-res Image Gene #59: '10q loss' versus Clinical Feature #5: 'HISTOLOGICAL.TYPE'
P value = 1.5e-05 (logrank test), Q value = 0.0091
Table S24. Gene #65: '14q loss' versus Clinical Feature #1: 'Time to Death'
| nPatients | nDeath | Duration Range (Median), Month | |
|---|---|---|---|
| ALL | 395 | 71 | 0.0 - 211.2 (15.0) |
| 14Q LOSS MUTATED | 61 | 21 | 0.1 - 130.8 (15.0) |
| 14Q LOSS WILD-TYPE | 334 | 50 | 0.0 - 211.2 (15.0) |
Figure S24. Get High-res Image Gene #65: '14q loss' versus Clinical Feature #1: 'Time to Death'
P value = 1e-05 (Fisher's exact test), Q value = 0.0061
Table S25. Gene #74: '19q loss' versus Clinical Feature #5: 'HISTOLOGICAL.TYPE'
| nPatients | ASTROCYTOMA | OLIGOASTROCYTOMA | OLIGODENDROGLIOMA |
|---|---|---|---|
| ALL | 143 | 104 | 153 |
| 19Q LOSS MUTATED | 17 | 33 | 116 |
| 19Q LOSS WILD-TYPE | 126 | 71 | 37 |
Figure S25. Get High-res Image Gene #74: '19q loss' versus Clinical Feature #5: 'HISTOLOGICAL.TYPE'
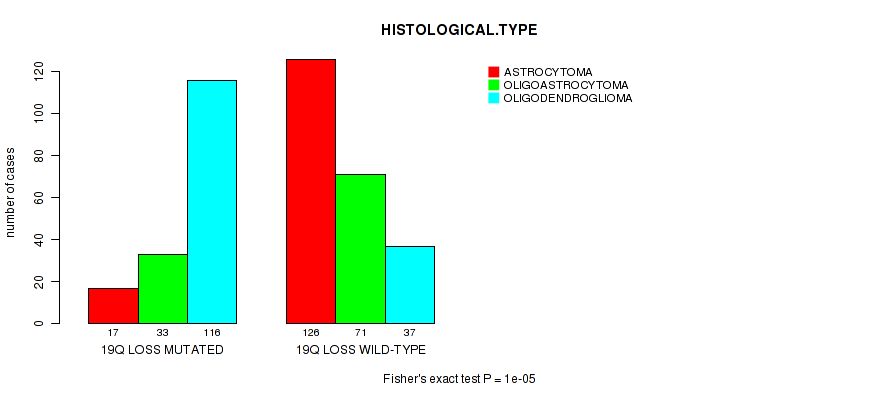
P value = 2e-04 (logrank test), Q value = 0.12
Table S26. Gene #77: '22q loss' versus Clinical Feature #1: 'Time to Death'
| nPatients | nDeath | Duration Range (Median), Month | |
|---|---|---|---|
| ALL | 395 | 71 | 0.0 - 211.2 (15.0) |
| 22Q LOSS MUTATED | 45 | 17 | 0.1 - 156.2 (15.5) |
| 22Q LOSS WILD-TYPE | 350 | 54 | 0.0 - 211.2 (15.0) |
Figure S26. Get High-res Image Gene #77: '22q loss' versus Clinical Feature #1: 'Time to Death'
P value = 0.000221 (Wilcoxon-test), Q value = 0.13
Table S27. Gene #77: '22q loss' versus Clinical Feature #2: 'AGE'
| nPatients | Mean (Std.Dev) | |
|---|---|---|
| ALL | 400 | 43.2 (13.3) |
| 22Q LOSS MUTATED | 45 | 50.6 (13.7) |
| 22Q LOSS WILD-TYPE | 355 | 42.3 (13.0) |
Figure S27. Get High-res Image Gene #77: '22q loss' versus Clinical Feature #2: 'AGE'
-
Copy number data file = transformed.cor.cli.txt
-
Clinical data file = LGG-TP.merged_data.txt
-
Number of patients = 400
-
Number of significantly arm-level cnvs = 78
-
Number of selected clinical features = 8
-
Exclude regions that fewer than K tumors have mutations, K = 3
For survival clinical features, the Kaplan-Meier survival curves of tumors with and without gene mutations were plotted and the statistical significance P values were estimated by logrank test (Bland and Altman 2004) using the 'survdiff' function in R
For binary or multi-class clinical features (nominal or ordinal), two-tailed Fisher's exact tests (Fisher 1922) were used to estimate the P values using the 'fisher.test' function in R
For multiple hypothesis correction, Q value is the False Discovery Rate (FDR) analogue of the P value (Benjamini and Hochberg 1995), defined as the minimum FDR at which the test may be called significant. We used the 'Benjamini and Hochberg' method of 'p.adjust' function in R to convert P values into Q values.
In addition to the links below, the full results of the analysis summarized in this report can also be downloaded programmatically using firehose_get, or interactively from either the Broad GDAC website or TCGA Data Coordination Center Portal.