This pipeline computes the correlation between significant arm-level copy number variations (cnvs) and molecular subtypes.
Testing the association between copy number variation 80 arm-level events and 8 molecular subtypes across 208 patients, 37 significant findings detected with P value < 0.05 and Q value < 0.25.
-
1q gain cnv correlated to 'CN_CNMF', 'METHLYATION_CNMF', and 'MRNASEQ_CNMF'.
-
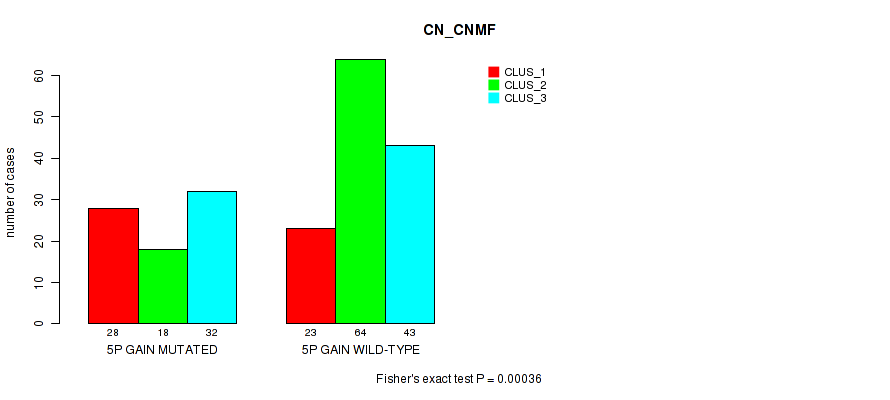
5p gain cnv correlated to 'CN_CNMF'.
-
5q gain cnv correlated to 'CN_CNMF'.
-
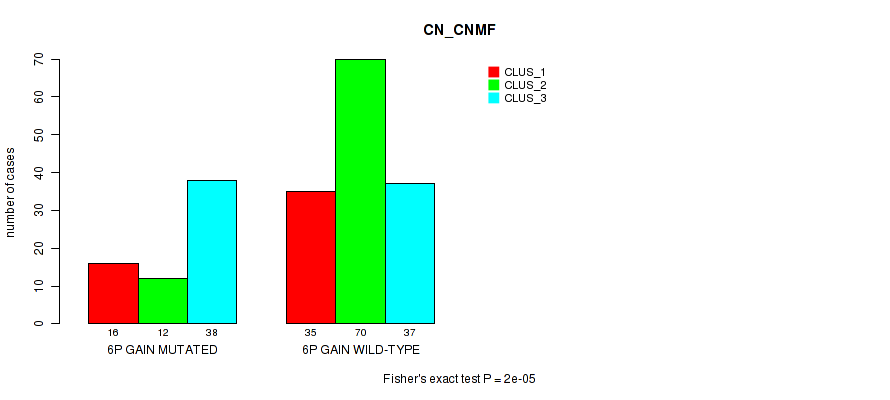
6p gain cnv correlated to 'CN_CNMF'.
-
8q gain cnv correlated to 'CN_CNMF'.
-
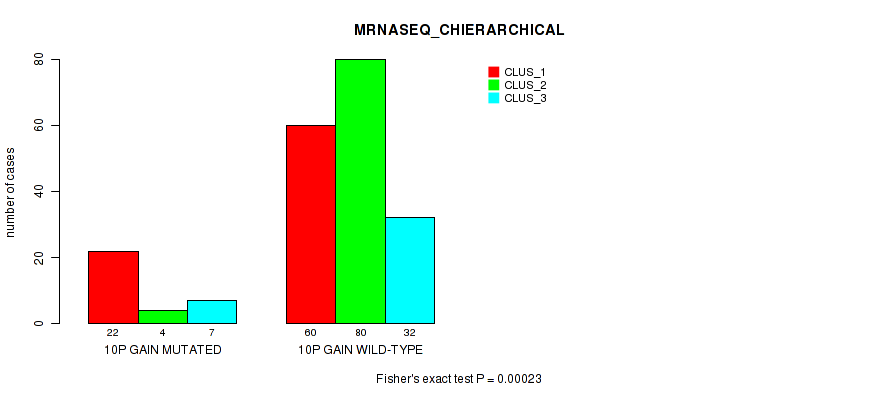
10p gain cnv correlated to 'MRNASEQ_CHIERARCHICAL'.
-
10q gain cnv correlated to 'MRNASEQ_CNMF'.
-
12p gain cnv correlated to 'MRNASEQ_CHIERARCHICAL' and 'MIRSEQ_MATURE_CNMF'.
-
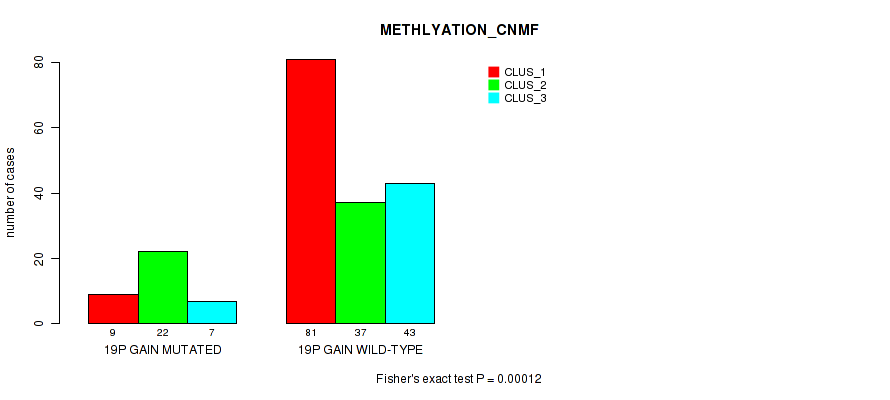
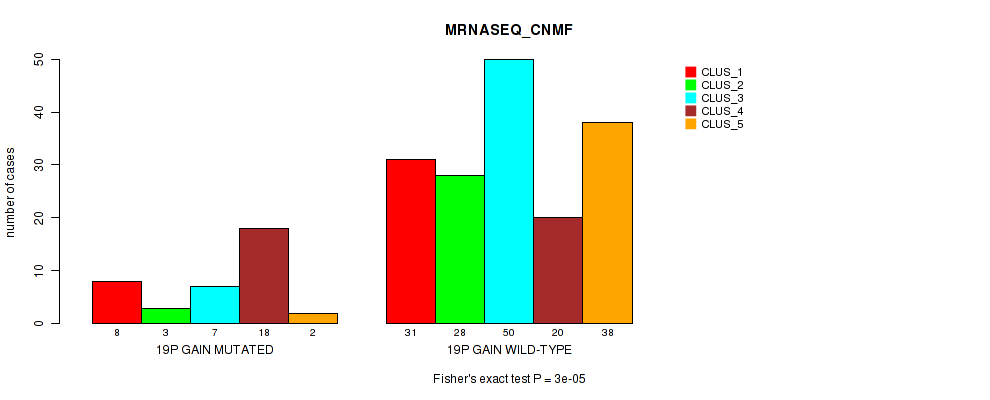
19p gain cnv correlated to 'METHLYATION_CNMF' and 'MRNASEQ_CNMF'.
-
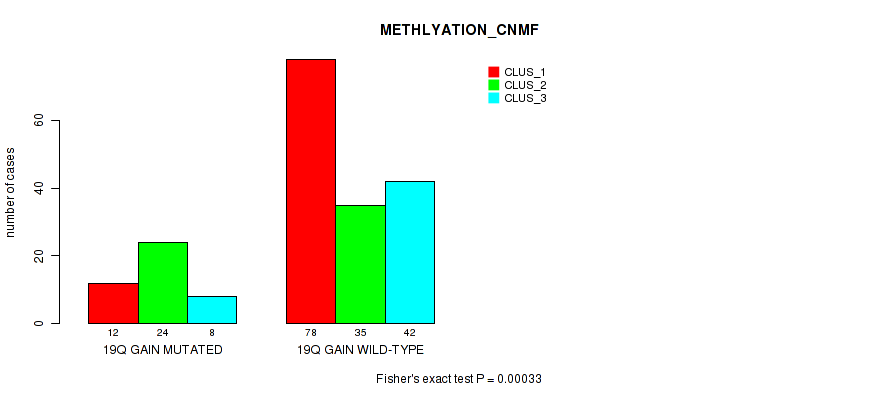
19q gain cnv correlated to 'METHLYATION_CNMF' and 'MRNASEQ_CNMF'.
-
20p gain cnv correlated to 'CN_CNMF'.
-
20q gain cnv correlated to 'CN_CNMF'.
-
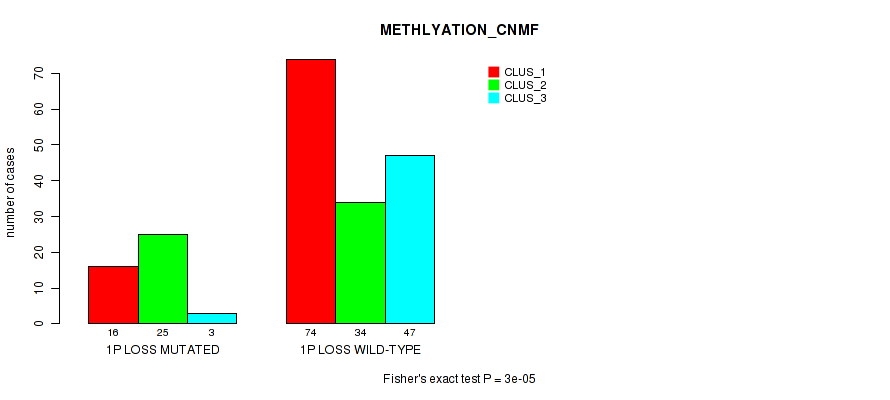
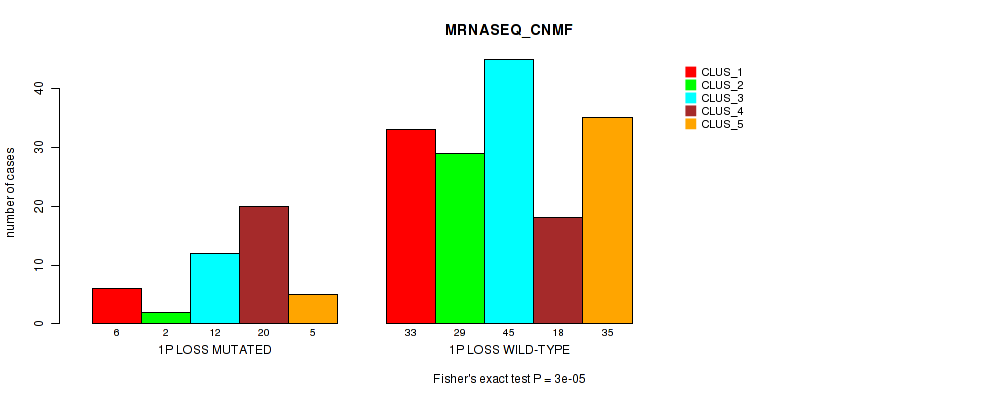
1p loss cnv correlated to 'METHLYATION_CNMF' and 'MRNASEQ_CNMF'.
-
4p loss cnv correlated to 'CN_CNMF'.
-
4q loss cnv correlated to 'CN_CNMF' and 'MRNASEQ_CNMF'.
-
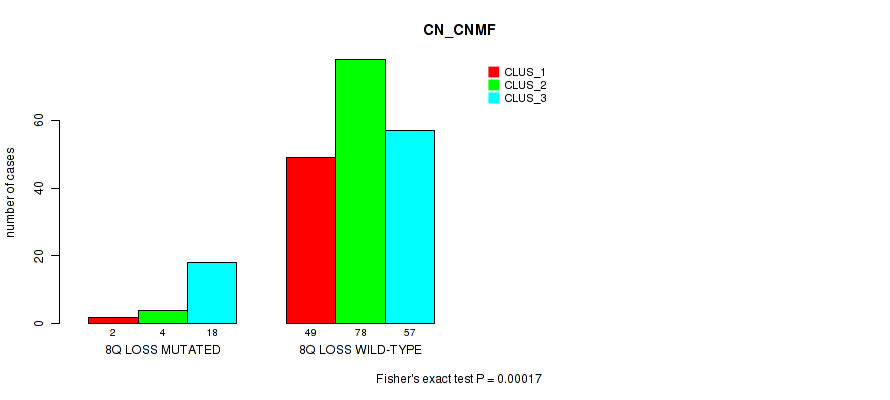
8q loss cnv correlated to 'CN_CNMF'.
-
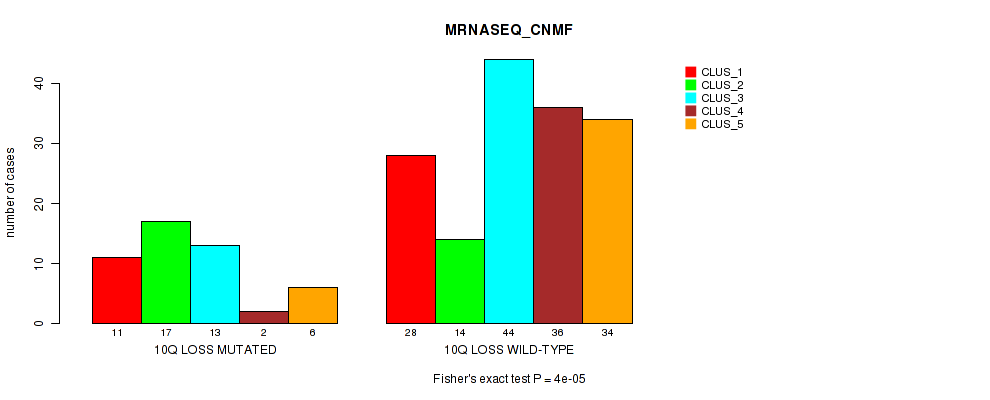
10q loss cnv correlated to 'MRNASEQ_CNMF'.
-
13q loss cnv correlated to 'CN_CNMF'.
-
16p loss cnv correlated to 'MRNASEQ_CNMF', 'MRNASEQ_CHIERARCHICAL', 'MIRSEQ_CHIERARCHICAL', and 'MIRSEQ_MATURE_CHIERARCHICAL'.
-
16q loss cnv correlated to 'CN_CNMF', 'METHLYATION_CNMF', 'MRNASEQ_CNMF', 'MRNASEQ_CHIERARCHICAL', and 'MIRSEQ_MATURE_CHIERARCHICAL'.
-
17p loss cnv correlated to 'CN_CNMF'.
-
19p loss cnv correlated to 'CN_CNMF'.
-
19q loss cnv correlated to 'CN_CNMF'.
Table 1. Get Full Table Overview of the association between significant copy number variation of 80 arm-level events and 8 molecular subtypes. Shown in the table are P values (Q values). Thresholded by P value < 0.05 and Q value < 0.25, 37 significant findings detected.
|
Clinical Features |
CN CNMF |
METHLYATION CNMF |
MRNASEQ CNMF |
MRNASEQ CHIERARCHICAL |
MIRSEQ CNMF |
MIRSEQ CHIERARCHICAL |
MIRSEQ MATURE CNMF |
MIRSEQ MATURE CHIERARCHICAL |
||
| nCNV (%) | nWild-Type | Fisher's exact test | Fisher's exact test | Fisher's exact test | Fisher's exact test | Fisher's exact test | Fisher's exact test | Fisher's exact test | Fisher's exact test | |
| 16q loss | 78 (38%) | 130 |
2e-05 (0.0127) |
6e-05 (0.0376) |
2e-05 (0.0127) |
0.0003 (0.183) |
0.205 (1.00) |
0.00792 (1.00) |
0.00949 (1.00) |
0.00011 (0.0685) |
| 16p loss | 63 (30%) | 145 |
0.0049 (1.00) |
0.074 (1.00) |
2e-05 (0.0127) |
0.00027 (0.166) |
0.438 (1.00) |
0.00027 (0.166) |
0.00064 (0.385) |
0.00017 (0.106) |
| 1q gain | 118 (57%) | 90 |
1e-05 (0.0064) |
0.00018 (0.111) |
5e-05 (0.0314) |
0.00641 (1.00) |
0.632 (1.00) |
0.0391 (1.00) |
0.572 (1.00) |
0.00311 (1.00) |
| 12p gain | 26 (12%) | 182 |
0.479 (1.00) |
0.0728 (1.00) |
0.00417 (1.00) |
0.0003 (0.183) |
0.442 (1.00) |
0.162 (1.00) |
0.0004 (0.242) |
0.121 (1.00) |
| 19p gain | 39 (19%) | 169 |
0.0811 (1.00) |
0.00012 (0.0746) |
3e-05 (0.019) |
0.00047 (0.283) |
0.0127 (1.00) |
0.00275 (1.00) |
0.00227 (1.00) |
0.00195 (1.00) |
| 19q gain | 46 (22%) | 162 |
0.0324 (1.00) |
0.00033 (0.2) |
0.00022 (0.136) |
0.00105 (0.622) |
0.0377 (1.00) |
0.00947 (1.00) |
0.00313 (1.00) |
0.00073 (0.438) |
| 1p loss | 46 (22%) | 162 |
0.00102 (0.606) |
3e-05 (0.019) |
3e-05 (0.019) |
0.0955 (1.00) |
0.0163 (1.00) |
0.0352 (1.00) |
0.0493 (1.00) |
0.0275 (1.00) |
| 4q loss | 77 (37%) | 131 |
1e-05 (0.0064) |
0.00328 (1.00) |
0.00039 (0.236) |
0.434 (1.00) |
0.931 (1.00) |
0.0475 (1.00) |
0.116 (1.00) |
0.0853 (1.00) |
| 5p gain | 78 (38%) | 130 |
0.00036 (0.218) |
0.0152 (1.00) |
0.884 (1.00) |
0.615 (1.00) |
0.558 (1.00) |
0.92 (1.00) |
0.779 (1.00) |
0.33 (1.00) |
| 5q gain | 56 (27%) | 152 |
4e-05 (0.0252) |
0.108 (1.00) |
0.912 (1.00) |
0.855 (1.00) |
0.861 (1.00) |
0.995 (1.00) |
0.985 (1.00) |
0.999 (1.00) |
| 6p gain | 66 (32%) | 142 |
2e-05 (0.0127) |
0.00064 (0.385) |
0.00233 (1.00) |
0.105 (1.00) |
0.348 (1.00) |
0.00077 (0.461) |
0.0853 (1.00) |
0.0161 (1.00) |
| 8q gain | 101 (49%) | 107 |
1e-05 (0.0064) |
0.271 (1.00) |
0.0247 (1.00) |
0.0464 (1.00) |
0.174 (1.00) |
0.154 (1.00) |
0.484 (1.00) |
0.0761 (1.00) |
| 10p gain | 33 (16%) | 175 |
0.109 (1.00) |
0.00334 (1.00) |
0.0236 (1.00) |
0.00023 (0.141) |
0.145 (1.00) |
0.389 (1.00) |
0.00103 (0.611) |
0.044 (1.00) |
| 10q gain | 20 (10%) | 188 |
0.00926 (1.00) |
0.00263 (1.00) |
0.00017 (0.106) |
0.0221 (1.00) |
0.0558 (1.00) |
0.0972 (1.00) |
0.012 (1.00) |
0.158 (1.00) |
| 20p gain | 63 (30%) | 145 |
8e-05 (0.05) |
0.0364 (1.00) |
0.00435 (1.00) |
0.0172 (1.00) |
0.438 (1.00) |
0.0495 (1.00) |
0.00183 (1.00) |
0.0924 (1.00) |
| 20q gain | 65 (31%) | 143 |
5e-05 (0.0314) |
0.0216 (1.00) |
0.00662 (1.00) |
0.0135 (1.00) |
0.384 (1.00) |
0.0647 (1.00) |
0.00742 (1.00) |
0.083 (1.00) |
| 4p loss | 55 (26%) | 153 |
0.00027 (0.166) |
0.0681 (1.00) |
0.00419 (1.00) |
0.154 (1.00) |
0.729 (1.00) |
0.0134 (1.00) |
0.111 (1.00) |
0.0993 (1.00) |
| 8q loss | 24 (12%) | 184 |
0.00017 (0.106) |
0.838 (1.00) |
0.0946 (1.00) |
0.127 (1.00) |
0.961 (1.00) |
0.902 (1.00) |
0.416 (1.00) |
0.197 (1.00) |
| 10q loss | 49 (24%) | 159 |
0.62 (1.00) |
0.79 (1.00) |
4e-05 (0.0252) |
0.242 (1.00) |
0.222 (1.00) |
0.00116 (0.686) |
0.402 (1.00) |
0.0132 (1.00) |
| 13q loss | 73 (35%) | 135 |
0.0002 (0.123) |
0.283 (1.00) |
0.248 (1.00) |
0.0217 (1.00) |
0.591 (1.00) |
0.138 (1.00) |
0.231 (1.00) |
0.143 (1.00) |
| 17p loss | 110 (53%) | 98 |
0.00031 (0.188) |
0.0866 (1.00) |
0.24 (1.00) |
0.231 (1.00) |
0.0415 (1.00) |
0.003 (1.00) |
0.0168 (1.00) |
0.00531 (1.00) |
| 19p loss | 29 (14%) | 179 |
0.00027 (0.166) |
0.0282 (1.00) |
0.173 (1.00) |
0.525 (1.00) |
0.308 (1.00) |
0.00769 (1.00) |
0.989 (1.00) |
0.0972 (1.00) |
| 19q loss | 23 (11%) | 185 |
0.0001 (0.0624) |
0.397 (1.00) |
0.304 (1.00) |
0.122 (1.00) |
0.811 (1.00) |
0.00089 (0.53) |
0.37 (1.00) |
0.162 (1.00) |
| 1p gain | 37 (18%) | 171 |
0.163 (1.00) |
0.631 (1.00) |
0.318 (1.00) |
0.202 (1.00) |
0.39 (1.00) |
0.0238 (1.00) |
0.642 (1.00) |
0.0969 (1.00) |
| 2p gain | 29 (14%) | 179 |
0.275 (1.00) |
0.531 (1.00) |
0.368 (1.00) |
0.167 (1.00) |
0.967 (1.00) |
0.727 (1.00) |
0.434 (1.00) |
0.743 (1.00) |
| 2q gain | 26 (12%) | 182 |
0.264 (1.00) |
0.669 (1.00) |
0.144 (1.00) |
0.0831 (1.00) |
0.711 (1.00) |
0.859 (1.00) |
0.303 (1.00) |
0.504 (1.00) |
| 3p gain | 22 (11%) | 186 |
0.0258 (1.00) |
0.718 (1.00) |
0.476 (1.00) |
0.64 (1.00) |
0.917 (1.00) |
0.457 (1.00) |
0.361 (1.00) |
0.919 (1.00) |
| 3q gain | 24 (12%) | 184 |
0.0202 (1.00) |
0.681 (1.00) |
0.691 (1.00) |
0.455 (1.00) |
0.752 (1.00) |
0.345 (1.00) |
0.242 (1.00) |
0.537 (1.00) |
| 4p gain | 18 (9%) | 190 |
0.0282 (1.00) |
0.185 (1.00) |
0.325 (1.00) |
0.234 (1.00) |
0.188 (1.00) |
0.693 (1.00) |
0.523 (1.00) |
0.935 (1.00) |
| 4q gain | 6 (3%) | 202 |
0.443 (1.00) |
0.385 (1.00) |
0.525 (1.00) |
0.434 (1.00) |
0.579 (1.00) |
0.689 (1.00) |
0.0123 (1.00) |
0.891 (1.00) |
| 6q gain | 40 (19%) | 168 |
0.00402 (1.00) |
0.0549 (1.00) |
0.0523 (1.00) |
0.245 (1.00) |
0.518 (1.00) |
0.0355 (1.00) |
0.078 (1.00) |
0.325 (1.00) |
| 7p gain | 63 (30%) | 145 |
0.811 (1.00) |
0.351 (1.00) |
0.663 (1.00) |
0.348 (1.00) |
0.06 (1.00) |
0.441 (1.00) |
0.103 (1.00) |
0.328 (1.00) |
| 7q gain | 65 (31%) | 143 |
0.812 (1.00) |
0.0159 (1.00) |
0.898 (1.00) |
0.817 (1.00) |
0.053 (1.00) |
0.225 (1.00) |
0.0331 (1.00) |
0.75 (1.00) |
| 8p gain | 41 (20%) | 167 |
0.00542 (1.00) |
0.0735 (1.00) |
0.254 (1.00) |
0.122 (1.00) |
0.149 (1.00) |
0.603 (1.00) |
0.0871 (1.00) |
0.255 (1.00) |
| 9p gain | 12 (6%) | 196 |
0.284 (1.00) |
0.491 (1.00) |
0.0443 (1.00) |
0.432 (1.00) |
0.805 (1.00) |
0.733 (1.00) |
0.554 (1.00) |
0.698 (1.00) |
| 9q gain | 13 (6%) | 195 |
0.126 (1.00) |
0.863 (1.00) |
0.0436 (1.00) |
0.265 (1.00) |
0.308 (1.00) |
0.746 (1.00) |
0.532 (1.00) |
0.936 (1.00) |
| 11p gain | 15 (7%) | 193 |
0.944 (1.00) |
0.353 (1.00) |
0.287 (1.00) |
0.317 (1.00) |
0.264 (1.00) |
0.144 (1.00) |
0.00326 (1.00) |
0.69 (1.00) |
| 11q gain | 14 (7%) | 194 |
1 (1.00) |
1 (1.00) |
0.742 (1.00) |
0.751 (1.00) |
0.384 (1.00) |
0.856 (1.00) |
0.195 (1.00) |
1 (1.00) |
| 12q gain | 30 (14%) | 178 |
0.428 (1.00) |
0.402 (1.00) |
0.00859 (1.00) |
0.00171 (1.00) |
0.537 (1.00) |
0.205 (1.00) |
0.00368 (1.00) |
0.319 (1.00) |
| 13q gain | 14 (7%) | 194 |
0.1 (1.00) |
0.206 (1.00) |
0.033 (1.00) |
0.628 (1.00) |
0.493 (1.00) |
0.0147 (1.00) |
0.0409 (1.00) |
0.533 (1.00) |
| 14q gain | 12 (6%) | 196 |
0.261 (1.00) |
0.649 (1.00) |
0.297 (1.00) |
0.178 (1.00) |
0.931 (1.00) |
0.621 (1.00) |
0.742 (1.00) |
0.618 (1.00) |
| 15q gain | 18 (9%) | 190 |
1 (1.00) |
0.415 (1.00) |
0.907 (1.00) |
0.621 (1.00) |
0.209 (1.00) |
0.424 (1.00) |
0.817 (1.00) |
0.597 (1.00) |
| 16p gain | 19 (9%) | 189 |
0.316 (1.00) |
0.754 (1.00) |
0.692 (1.00) |
0.543 (1.00) |
1 (1.00) |
0.488 (1.00) |
0.331 (1.00) |
0.0764 (1.00) |
| 16q gain | 10 (5%) | 198 |
0.846 (1.00) |
0.731 (1.00) |
0.0659 (1.00) |
0.335 (1.00) |
0.259 (1.00) |
0.862 (1.00) |
0.0554 (1.00) |
0.121 (1.00) |
| 17p gain | 17 (8%) | 191 |
0.9 (1.00) |
0.0341 (1.00) |
0.435 (1.00) |
0.106 (1.00) |
1 (1.00) |
0.416 (1.00) |
0.82 (1.00) |
0.654 (1.00) |
| 17q gain | 52 (25%) | 156 |
0.0125 (1.00) |
0.0606 (1.00) |
0.297 (1.00) |
0.0338 (1.00) |
1 (1.00) |
0.401 (1.00) |
0.457 (1.00) |
0.67 (1.00) |
| 18p gain | 17 (8%) | 191 |
0.192 (1.00) |
0.0724 (1.00) |
0.00254 (1.00) |
0.0012 (0.708) |
0.174 (1.00) |
0.0343 (1.00) |
0.018 (1.00) |
0.0578 (1.00) |
| 18q gain | 15 (7%) | 193 |
0.489 (1.00) |
0.062 (1.00) |
0.00088 (0.525) |
0.00088 (0.525) |
0.402 (1.00) |
0.0671 (1.00) |
0.0313 (1.00) |
0.114 (1.00) |
| 21q gain | 17 (8%) | 191 |
0.143 (1.00) |
0.724 (1.00) |
0.592 (1.00) |
0.322 (1.00) |
0.948 (1.00) |
0.33 (1.00) |
0.247 (1.00) |
0.524 (1.00) |
| 22q gain | 28 (13%) | 180 |
0.0555 (1.00) |
0.0255 (1.00) |
0.00436 (1.00) |
0.00658 (1.00) |
0.103 (1.00) |
0.356 (1.00) |
0.0979 (1.00) |
0.406 (1.00) |
| xq gain | 36 (17%) | 172 |
0.0036 (1.00) |
0.0267 (1.00) |
0.703 (1.00) |
0.373 (1.00) |
0.103 (1.00) |
0.284 (1.00) |
0.207 (1.00) |
0.13 (1.00) |
| 1q loss | 14 (7%) | 194 |
0.534 (1.00) |
0.299 (1.00) |
0.211 (1.00) |
0.384 (1.00) |
0.359 (1.00) |
0.325 (1.00) |
0.335 (1.00) |
0.841 (1.00) |
| 2p loss | 20 (10%) | 188 |
0.062 (1.00) |
0.912 (1.00) |
0.294 (1.00) |
0.559 (1.00) |
0.101 (1.00) |
0.38 (1.00) |
0.201 (1.00) |
0.746 (1.00) |
| 2q loss | 22 (11%) | 186 |
0.0182 (1.00) |
0.773 (1.00) |
0.304 (1.00) |
0.508 (1.00) |
0.0266 (1.00) |
0.7 (1.00) |
0.706 (1.00) |
0.723 (1.00) |
| 3p loss | 30 (14%) | 178 |
0.214 (1.00) |
0.161 (1.00) |
0.0192 (1.00) |
0.00641 (1.00) |
0.264 (1.00) |
0.193 (1.00) |
0.0261 (1.00) |
0.00323 (1.00) |
| 3q loss | 19 (9%) | 189 |
1 (1.00) |
0.901 (1.00) |
0.286 (1.00) |
0.196 (1.00) |
0.139 (1.00) |
0.419 (1.00) |
0.0706 (1.00) |
0.143 (1.00) |
| 5p loss | 15 (7%) | 193 |
0.554 (1.00) |
0.94 (1.00) |
0.473 (1.00) |
0.885 (1.00) |
0.661 (1.00) |
0.471 (1.00) |
0.0195 (1.00) |
0.663 (1.00) |
| 5q loss | 23 (11%) | 185 |
0.215 (1.00) |
0.541 (1.00) |
0.254 (1.00) |
0.118 (1.00) |
0.423 (1.00) |
0.126 (1.00) |
0.203 (1.00) |
0.445 (1.00) |
| 6p loss | 21 (10%) | 187 |
0.917 (1.00) |
0.838 (1.00) |
0.215 (1.00) |
1 (1.00) |
0.0301 (1.00) |
0.898 (1.00) |
0.416 (1.00) |
0.282 (1.00) |
| 6q loss | 56 (27%) | 152 |
0.797 (1.00) |
0.616 (1.00) |
0.565 (1.00) |
0.785 (1.00) |
0.17 (1.00) |
0.228 (1.00) |
0.91 (1.00) |
0.326 (1.00) |
| 7p loss | 12 (6%) | 196 |
0.519 (1.00) |
0.326 (1.00) |
0.00395 (1.00) |
0.631 (1.00) |
0.866 (1.00) |
0.799 (1.00) |
0.755 (1.00) |
0.355 (1.00) |
| 7q loss | 16 (8%) | 192 |
0.717 (1.00) |
0.206 (1.00) |
0.01 (1.00) |
0.516 (1.00) |
0.636 (1.00) |
0.326 (1.00) |
0.799 (1.00) |
0.211 (1.00) |
| 8p loss | 101 (49%) | 107 |
0.00852 (1.00) |
0.0463 (1.00) |
0.193 (1.00) |
0.883 (1.00) |
0.229 (1.00) |
0.431 (1.00) |
0.0554 (1.00) |
0.132 (1.00) |
| 9p loss | 66 (32%) | 142 |
0.00266 (1.00) |
0.154 (1.00) |
0.624 (1.00) |
0.804 (1.00) |
0.579 (1.00) |
0.541 (1.00) |
0.888 (1.00) |
0.632 (1.00) |
| 9q loss | 64 (31%) | 144 |
0.0343 (1.00) |
0.0428 (1.00) |
0.385 (1.00) |
0.317 (1.00) |
0.774 (1.00) |
0.314 (1.00) |
0.815 (1.00) |
0.513 (1.00) |
| 10p loss | 29 (14%) | 179 |
0.792 (1.00) |
0.457 (1.00) |
0.0926 (1.00) |
0.342 (1.00) |
0.165 (1.00) |
0.0288 (1.00) |
0.386 (1.00) |
0.0818 (1.00) |
| 11p loss | 40 (19%) | 168 |
0.217 (1.00) |
0.461 (1.00) |
0.232 (1.00) |
0.169 (1.00) |
0.542 (1.00) |
0.194 (1.00) |
0.243 (1.00) |
0.166 (1.00) |
| 11q loss | 43 (21%) | 165 |
0.209 (1.00) |
0.151 (1.00) |
0.463 (1.00) |
0.309 (1.00) |
0.335 (1.00) |
0.387 (1.00) |
0.37 (1.00) |
0.444 (1.00) |
| 12p loss | 40 (19%) | 168 |
0.0432 (1.00) |
0.0729 (1.00) |
0.0955 (1.00) |
0.625 (1.00) |
0.226 (1.00) |
0.219 (1.00) |
0.242 (1.00) |
0.176 (1.00) |
| 12q loss | 22 (11%) | 186 |
0.187 (1.00) |
0.532 (1.00) |
0.601 (1.00) |
0.765 (1.00) |
0.486 (1.00) |
0.88 (1.00) |
0.424 (1.00) |
0.87 (1.00) |
| 14q loss | 64 (31%) | 144 |
0.0012 (0.708) |
0.367 (1.00) |
0.0262 (1.00) |
0.00354 (1.00) |
0.276 (1.00) |
0.232 (1.00) |
0.1 (1.00) |
0.142 (1.00) |
| 15q loss | 45 (22%) | 163 |
0.0175 (1.00) |
0.14 (1.00) |
0.0537 (1.00) |
0.0334 (1.00) |
0.824 (1.00) |
0.0199 (1.00) |
0.00363 (1.00) |
0.0825 (1.00) |
| 17q loss | 32 (15%) | 176 |
0.104 (1.00) |
0.602 (1.00) |
0.409 (1.00) |
0.847 (1.00) |
0.68 (1.00) |
0.835 (1.00) |
0.549 (1.00) |
0.541 (1.00) |
| 18p loss | 43 (21%) | 165 |
0.0294 (1.00) |
0.00295 (1.00) |
0.7 (1.00) |
0.33 (1.00) |
0.724 (1.00) |
0.351 (1.00) |
0.493 (1.00) |
0.194 (1.00) |
| 18q loss | 46 (22%) | 162 |
0.00078 (0.466) |
0.00378 (1.00) |
0.733 (1.00) |
0.272 (1.00) |
0.423 (1.00) |
0.177 (1.00) |
0.0735 (1.00) |
0.0373 (1.00) |
| 20p loss | 13 (6%) | 195 |
0.412 (1.00) |
0.57 (1.00) |
0.65 (1.00) |
0.0519 (1.00) |
0.579 (1.00) |
0.732 (1.00) |
0.181 (1.00) |
0.167 (1.00) |
| 20q loss | 9 (4%) | 199 |
0.692 (1.00) |
0.621 (1.00) |
0.565 (1.00) |
0.0659 (1.00) |
0.576 (1.00) |
0.949 (1.00) |
0.284 (1.00) |
0.382 (1.00) |
| 21q loss | 59 (28%) | 149 |
0.0207 (1.00) |
0.881 (1.00) |
0.018 (1.00) |
0.334 (1.00) |
0.33 (1.00) |
0.00142 (0.835) |
0.0217 (1.00) |
0.0815 (1.00) |
| 22q loss | 51 (25%) | 157 |
0.69 (1.00) |
0.64 (1.00) |
0.533 (1.00) |
0.342 (1.00) |
0.399 (1.00) |
0.218 (1.00) |
0.514 (1.00) |
0.107 (1.00) |
| xq loss | 36 (17%) | 172 |
0.00169 (0.992) |
0.0509 (1.00) |
0.84 (1.00) |
0.81 (1.00) |
0.673 (1.00) |
0.934 (1.00) |
0.424 (1.00) |
0.929 (1.00) |
P value = 1e-05 (Fisher's exact test), Q value = 0.0064
Table S1. Gene #2: '1q gain' versus Molecular Subtype #1: 'CN_CNMF'
| nPatients | CLUS_1 | CLUS_2 | CLUS_3 |
|---|---|---|---|
| ALL | 51 | 82 | 75 |
| 1Q GAIN MUTATED | 37 | 29 | 52 |
| 1Q GAIN WILD-TYPE | 14 | 53 | 23 |
Figure S1. Get High-res Image Gene #2: '1q gain' versus Molecular Subtype #1: 'CN_CNMF'

P value = 0.00018 (Fisher's exact test), Q value = 0.11
Table S2. Gene #2: '1q gain' versus Molecular Subtype #2: 'METHLYATION_CNMF'
| nPatients | CLUS_1 | CLUS_2 | CLUS_3 |
|---|---|---|---|
| ALL | 90 | 59 | 50 |
| 1Q GAIN MUTATED | 57 | 41 | 16 |
| 1Q GAIN WILD-TYPE | 33 | 18 | 34 |
Figure S2. Get High-res Image Gene #2: '1q gain' versus Molecular Subtype #2: 'METHLYATION_CNMF'

P value = 5e-05 (Fisher's exact test), Q value = 0.031
Table S3. Gene #2: '1q gain' versus Molecular Subtype #3: 'MRNASEQ_CNMF'
| nPatients | CLUS_1 | CLUS_2 | CLUS_3 | CLUS_4 | CLUS_5 |
|---|---|---|---|---|---|
| ALL | 39 | 31 | 57 | 38 | 40 |
| 1Q GAIN MUTATED | 18 | 19 | 20 | 30 | 28 |
| 1Q GAIN WILD-TYPE | 21 | 12 | 37 | 8 | 12 |
Figure S3. Get High-res Image Gene #2: '1q gain' versus Molecular Subtype #3: 'MRNASEQ_CNMF'

P value = 0.00036 (Fisher's exact test), Q value = 0.22
Table S4. Gene #9: '5p gain' versus Molecular Subtype #1: 'CN_CNMF'
| nPatients | CLUS_1 | CLUS_2 | CLUS_3 |
|---|---|---|---|
| ALL | 51 | 82 | 75 |
| 5P GAIN MUTATED | 28 | 18 | 32 |
| 5P GAIN WILD-TYPE | 23 | 64 | 43 |
Figure S4. Get High-res Image Gene #9: '5p gain' versus Molecular Subtype #1: 'CN_CNMF'
P value = 4e-05 (Fisher's exact test), Q value = 0.025
Table S5. Gene #10: '5q gain' versus Molecular Subtype #1: 'CN_CNMF'
| nPatients | CLUS_1 | CLUS_2 | CLUS_3 |
|---|---|---|---|
| ALL | 51 | 82 | 75 |
| 5Q GAIN MUTATED | 25 | 11 | 20 |
| 5Q GAIN WILD-TYPE | 26 | 71 | 55 |
Figure S5. Get High-res Image Gene #10: '5q gain' versus Molecular Subtype #1: 'CN_CNMF'

P value = 2e-05 (Fisher's exact test), Q value = 0.013
Table S6. Gene #11: '6p gain' versus Molecular Subtype #1: 'CN_CNMF'
| nPatients | CLUS_1 | CLUS_2 | CLUS_3 |
|---|---|---|---|
| ALL | 51 | 82 | 75 |
| 6P GAIN MUTATED | 16 | 12 | 38 |
| 6P GAIN WILD-TYPE | 35 | 70 | 37 |
Figure S6. Get High-res Image Gene #11: '6p gain' versus Molecular Subtype #1: 'CN_CNMF'
P value = 1e-05 (Fisher's exact test), Q value = 0.0064
Table S7. Gene #16: '8q gain' versus Molecular Subtype #1: 'CN_CNMF'
| nPatients | CLUS_1 | CLUS_2 | CLUS_3 |
|---|---|---|---|
| ALL | 51 | 82 | 75 |
| 8Q GAIN MUTATED | 46 | 24 | 31 |
| 8Q GAIN WILD-TYPE | 5 | 58 | 44 |
Figure S7. Get High-res Image Gene #16: '8q gain' versus Molecular Subtype #1: 'CN_CNMF'

P value = 0.00023 (Fisher's exact test), Q value = 0.14
Table S8. Gene #19: '10p gain' versus Molecular Subtype #4: 'MRNASEQ_CHIERARCHICAL'
| nPatients | CLUS_1 | CLUS_2 | CLUS_3 |
|---|---|---|---|
| ALL | 82 | 84 | 39 |
| 10P GAIN MUTATED | 22 | 4 | 7 |
| 10P GAIN WILD-TYPE | 60 | 80 | 32 |
Figure S8. Get High-res Image Gene #19: '10p gain' versus Molecular Subtype #4: 'MRNASEQ_CHIERARCHICAL'
P value = 0.00017 (Fisher's exact test), Q value = 0.11
Table S9. Gene #20: '10q gain' versus Molecular Subtype #3: 'MRNASEQ_CNMF'
| nPatients | CLUS_1 | CLUS_2 | CLUS_3 | CLUS_4 | CLUS_5 |
|---|---|---|---|---|---|
| ALL | 39 | 31 | 57 | 38 | 40 |
| 10Q GAIN MUTATED | 1 | 0 | 3 | 11 | 5 |
| 10Q GAIN WILD-TYPE | 38 | 31 | 54 | 27 | 35 |
Figure S9. Get High-res Image Gene #20: '10q gain' versus Molecular Subtype #3: 'MRNASEQ_CNMF'

P value = 3e-04 (Fisher's exact test), Q value = 0.18
Table S10. Gene #23: '12p gain' versus Molecular Subtype #4: 'MRNASEQ_CHIERARCHICAL'
| nPatients | CLUS_1 | CLUS_2 | CLUS_3 |
|---|---|---|---|
| ALL | 82 | 84 | 39 |
| 12P GAIN MUTATED | 20 | 4 | 2 |
| 12P GAIN WILD-TYPE | 62 | 80 | 37 |
Figure S10. Get High-res Image Gene #23: '12p gain' versus Molecular Subtype #4: 'MRNASEQ_CHIERARCHICAL'

P value = 4e-04 (Fisher's exact test), Q value = 0.24
Table S11. Gene #23: '12p gain' versus Molecular Subtype #7: 'MIRSEQ_MATURE_CNMF'
| nPatients | CLUS_1 | CLUS_2 | CLUS_3 | CLUS_4 | CLUS_5 |
|---|---|---|---|---|---|
| ALL | 28 | 35 | 43 | 60 | 37 |
| 12P GAIN MUTATED | 6 | 1 | 3 | 4 | 12 |
| 12P GAIN WILD-TYPE | 22 | 34 | 40 | 56 | 25 |
Figure S11. Get High-res Image Gene #23: '12p gain' versus Molecular Subtype #7: 'MIRSEQ_MATURE_CNMF'

P value = 0.00012 (Fisher's exact test), Q value = 0.075
Table S12. Gene #34: '19p gain' versus Molecular Subtype #2: 'METHLYATION_CNMF'
| nPatients | CLUS_1 | CLUS_2 | CLUS_3 |
|---|---|---|---|
| ALL | 90 | 59 | 50 |
| 19P GAIN MUTATED | 9 | 22 | 7 |
| 19P GAIN WILD-TYPE | 81 | 37 | 43 |
Figure S12. Get High-res Image Gene #34: '19p gain' versus Molecular Subtype #2: 'METHLYATION_CNMF'
P value = 3e-05 (Fisher's exact test), Q value = 0.019
Table S13. Gene #34: '19p gain' versus Molecular Subtype #3: 'MRNASEQ_CNMF'
| nPatients | CLUS_1 | CLUS_2 | CLUS_3 | CLUS_4 | CLUS_5 |
|---|---|---|---|---|---|
| ALL | 39 | 31 | 57 | 38 | 40 |
| 19P GAIN MUTATED | 8 | 3 | 7 | 18 | 2 |
| 19P GAIN WILD-TYPE | 31 | 28 | 50 | 20 | 38 |
Figure S13. Get High-res Image Gene #34: '19p gain' versus Molecular Subtype #3: 'MRNASEQ_CNMF'
P value = 0.00033 (Fisher's exact test), Q value = 0.2
Table S14. Gene #35: '19q gain' versus Molecular Subtype #2: 'METHLYATION_CNMF'
| nPatients | CLUS_1 | CLUS_2 | CLUS_3 |
|---|---|---|---|
| ALL | 90 | 59 | 50 |
| 19Q GAIN MUTATED | 12 | 24 | 8 |
| 19Q GAIN WILD-TYPE | 78 | 35 | 42 |
Figure S14. Get High-res Image Gene #35: '19q gain' versus Molecular Subtype #2: 'METHLYATION_CNMF'
P value = 0.00022 (Fisher's exact test), Q value = 0.14
Table S15. Gene #35: '19q gain' versus Molecular Subtype #3: 'MRNASEQ_CNMF'
| nPatients | CLUS_1 | CLUS_2 | CLUS_3 | CLUS_4 | CLUS_5 |
|---|---|---|---|---|---|
| ALL | 39 | 31 | 57 | 38 | 40 |
| 19Q GAIN MUTATED | 9 | 5 | 8 | 19 | 4 |
| 19Q GAIN WILD-TYPE | 30 | 26 | 49 | 19 | 36 |
Figure S15. Get High-res Image Gene #35: '19q gain' versus Molecular Subtype #3: 'MRNASEQ_CNMF'

P value = 8e-05 (Fisher's exact test), Q value = 0.05
Table S16. Gene #36: '20p gain' versus Molecular Subtype #1: 'CN_CNMF'
| nPatients | CLUS_1 | CLUS_2 | CLUS_3 |
|---|---|---|---|
| ALL | 51 | 82 | 75 |
| 20P GAIN MUTATED | 16 | 12 | 35 |
| 20P GAIN WILD-TYPE | 35 | 70 | 40 |
Figure S16. Get High-res Image Gene #36: '20p gain' versus Molecular Subtype #1: 'CN_CNMF'

P value = 5e-05 (Fisher's exact test), Q value = 0.031
Table S17. Gene #37: '20q gain' versus Molecular Subtype #1: 'CN_CNMF'
| nPatients | CLUS_1 | CLUS_2 | CLUS_3 |
|---|---|---|---|
| ALL | 51 | 82 | 75 |
| 20Q GAIN MUTATED | 17 | 12 | 36 |
| 20Q GAIN WILD-TYPE | 34 | 70 | 39 |
Figure S17. Get High-res Image Gene #37: '20q gain' versus Molecular Subtype #1: 'CN_CNMF'

P value = 3e-05 (Fisher's exact test), Q value = 0.019
Table S18. Gene #41: '1p loss' versus Molecular Subtype #2: 'METHLYATION_CNMF'
| nPatients | CLUS_1 | CLUS_2 | CLUS_3 |
|---|---|---|---|
| ALL | 90 | 59 | 50 |
| 1P LOSS MUTATED | 16 | 25 | 3 |
| 1P LOSS WILD-TYPE | 74 | 34 | 47 |
Figure S18. Get High-res Image Gene #41: '1p loss' versus Molecular Subtype #2: 'METHLYATION_CNMF'
P value = 3e-05 (Fisher's exact test), Q value = 0.019
Table S19. Gene #41: '1p loss' versus Molecular Subtype #3: 'MRNASEQ_CNMF'
| nPatients | CLUS_1 | CLUS_2 | CLUS_3 | CLUS_4 | CLUS_5 |
|---|---|---|---|---|---|
| ALL | 39 | 31 | 57 | 38 | 40 |
| 1P LOSS MUTATED | 6 | 2 | 12 | 20 | 5 |
| 1P LOSS WILD-TYPE | 33 | 29 | 45 | 18 | 35 |
Figure S19. Get High-res Image Gene #41: '1p loss' versus Molecular Subtype #3: 'MRNASEQ_CNMF'
P value = 0.00027 (Fisher's exact test), Q value = 0.17
Table S20. Gene #47: '4p loss' versus Molecular Subtype #1: 'CN_CNMF'
| nPatients | CLUS_1 | CLUS_2 | CLUS_3 |
|---|---|---|---|
| ALL | 51 | 82 | 75 |
| 4P LOSS MUTATED | 13 | 11 | 31 |
| 4P LOSS WILD-TYPE | 38 | 71 | 44 |
Figure S20. Get High-res Image Gene #47: '4p loss' versus Molecular Subtype #1: 'CN_CNMF'

P value = 1e-05 (Fisher's exact test), Q value = 0.0064
Table S21. Gene #48: '4q loss' versus Molecular Subtype #1: 'CN_CNMF'
| nPatients | CLUS_1 | CLUS_2 | CLUS_3 |
|---|---|---|---|
| ALL | 51 | 82 | 75 |
| 4Q LOSS MUTATED | 17 | 12 | 48 |
| 4Q LOSS WILD-TYPE | 34 | 70 | 27 |
Figure S21. Get High-res Image Gene #48: '4q loss' versus Molecular Subtype #1: 'CN_CNMF'

P value = 0.00039 (Fisher's exact test), Q value = 0.24
Table S22. Gene #48: '4q loss' versus Molecular Subtype #3: 'MRNASEQ_CNMF'
| nPatients | CLUS_1 | CLUS_2 | CLUS_3 | CLUS_4 | CLUS_5 |
|---|---|---|---|---|---|
| ALL | 39 | 31 | 57 | 38 | 40 |
| 4Q LOSS MUTATED | 7 | 12 | 21 | 25 | 12 |
| 4Q LOSS WILD-TYPE | 32 | 19 | 36 | 13 | 28 |
Figure S22. Get High-res Image Gene #48: '4q loss' versus Molecular Subtype #3: 'MRNASEQ_CNMF'

P value = 0.00017 (Fisher's exact test), Q value = 0.11
Table S23. Gene #56: '8q loss' versus Molecular Subtype #1: 'CN_CNMF'
| nPatients | CLUS_1 | CLUS_2 | CLUS_3 |
|---|---|---|---|
| ALL | 51 | 82 | 75 |
| 8Q LOSS MUTATED | 2 | 4 | 18 |
| 8Q LOSS WILD-TYPE | 49 | 78 | 57 |
Figure S23. Get High-res Image Gene #56: '8q loss' versus Molecular Subtype #1: 'CN_CNMF'
P value = 4e-05 (Fisher's exact test), Q value = 0.025
Table S24. Gene #60: '10q loss' versus Molecular Subtype #3: 'MRNASEQ_CNMF'
| nPatients | CLUS_1 | CLUS_2 | CLUS_3 | CLUS_4 | CLUS_5 |
|---|---|---|---|---|---|
| ALL | 39 | 31 | 57 | 38 | 40 |
| 10Q LOSS MUTATED | 11 | 17 | 13 | 2 | 6 |
| 10Q LOSS WILD-TYPE | 28 | 14 | 44 | 36 | 34 |
Figure S24. Get High-res Image Gene #60: '10q loss' versus Molecular Subtype #3: 'MRNASEQ_CNMF'
P value = 2e-04 (Fisher's exact test), Q value = 0.12
Table S25. Gene #65: '13q loss' versus Molecular Subtype #1: 'CN_CNMF'
| nPatients | CLUS_1 | CLUS_2 | CLUS_3 |
|---|---|---|---|
| ALL | 51 | 82 | 75 |
| 13Q LOSS MUTATED | 12 | 21 | 40 |
| 13Q LOSS WILD-TYPE | 39 | 61 | 35 |
Figure S25. Get High-res Image Gene #65: '13q loss' versus Molecular Subtype #1: 'CN_CNMF'

P value = 2e-05 (Fisher's exact test), Q value = 0.013
Table S26. Gene #68: '16p loss' versus Molecular Subtype #3: 'MRNASEQ_CNMF'
| nPatients | CLUS_1 | CLUS_2 | CLUS_3 | CLUS_4 | CLUS_5 |
|---|---|---|---|---|---|
| ALL | 39 | 31 | 57 | 38 | 40 |
| 16P LOSS MUTATED | 10 | 10 | 14 | 24 | 5 |
| 16P LOSS WILD-TYPE | 29 | 21 | 43 | 14 | 35 |
Figure S26. Get High-res Image Gene #68: '16p loss' versus Molecular Subtype #3: 'MRNASEQ_CNMF'

P value = 0.00027 (Fisher's exact test), Q value = 0.17
Table S27. Gene #68: '16p loss' versus Molecular Subtype #4: 'MRNASEQ_CHIERARCHICAL'
| nPatients | CLUS_1 | CLUS_2 | CLUS_3 |
|---|---|---|---|
| ALL | 82 | 84 | 39 |
| 16P LOSS MUTATED | 38 | 20 | 5 |
| 16P LOSS WILD-TYPE | 44 | 64 | 34 |
Figure S27. Get High-res Image Gene #68: '16p loss' versus Molecular Subtype #4: 'MRNASEQ_CHIERARCHICAL'

P value = 0.00027 (Fisher's exact test), Q value = 0.17
Table S28. Gene #68: '16p loss' versus Molecular Subtype #6: 'MIRSEQ_CHIERARCHICAL'
| nPatients | CLUS_1 | CLUS_2 | CLUS_3 | CLUS_4 | CLUS_5 |
|---|---|---|---|---|---|
| ALL | 26 | 53 | 74 | 26 | 24 |
| 16P LOSS MUTATED | 8 | 10 | 30 | 13 | 1 |
| 16P LOSS WILD-TYPE | 18 | 43 | 44 | 13 | 23 |
Figure S28. Get High-res Image Gene #68: '16p loss' versus Molecular Subtype #6: 'MIRSEQ_CHIERARCHICAL'

P value = 0.00017 (Fisher's exact test), Q value = 0.11
Table S29. Gene #68: '16p loss' versus Molecular Subtype #8: 'MIRSEQ_MATURE_CHIERARCHICAL'
| nPatients | CLUS_1 | CLUS_2 | CLUS_3 | CLUS_4 | CLUS_5 |
|---|---|---|---|---|---|
| ALL | 25 | 44 | 36 | 74 | 24 |
| 16P LOSS MUTATED | 8 | 6 | 19 | 27 | 2 |
| 16P LOSS WILD-TYPE | 17 | 38 | 17 | 47 | 22 |
Figure S29. Get High-res Image Gene #68: '16p loss' versus Molecular Subtype #8: 'MIRSEQ_MATURE_CHIERARCHICAL'

P value = 2e-05 (Fisher's exact test), Q value = 0.013
Table S30. Gene #69: '16q loss' versus Molecular Subtype #1: 'CN_CNMF'
| nPatients | CLUS_1 | CLUS_2 | CLUS_3 |
|---|---|---|---|
| ALL | 51 | 82 | 75 |
| 16Q LOSS MUTATED | 17 | 18 | 43 |
| 16Q LOSS WILD-TYPE | 34 | 64 | 32 |
Figure S30. Get High-res Image Gene #69: '16q loss' versus Molecular Subtype #1: 'CN_CNMF'

P value = 6e-05 (Fisher's exact test), Q value = 0.038
Table S31. Gene #69: '16q loss' versus Molecular Subtype #2: 'METHLYATION_CNMF'
| nPatients | CLUS_1 | CLUS_2 | CLUS_3 |
|---|---|---|---|
| ALL | 90 | 59 | 50 |
| 16Q LOSS MUTATED | 28 | 35 | 10 |
| 16Q LOSS WILD-TYPE | 62 | 24 | 40 |
Figure S31. Get High-res Image Gene #69: '16q loss' versus Molecular Subtype #2: 'METHLYATION_CNMF'

P value = 2e-05 (Fisher's exact test), Q value = 0.013
Table S32. Gene #69: '16q loss' versus Molecular Subtype #3: 'MRNASEQ_CNMF'
| nPatients | CLUS_1 | CLUS_2 | CLUS_3 | CLUS_4 | CLUS_5 |
|---|---|---|---|---|---|
| ALL | 39 | 31 | 57 | 38 | 40 |
| 16Q LOSS MUTATED | 9 | 15 | 20 | 27 | 7 |
| 16Q LOSS WILD-TYPE | 30 | 16 | 37 | 11 | 33 |
Figure S32. Get High-res Image Gene #69: '16q loss' versus Molecular Subtype #3: 'MRNASEQ_CNMF'

P value = 3e-04 (Fisher's exact test), Q value = 0.18
Table S33. Gene #69: '16q loss' versus Molecular Subtype #4: 'MRNASEQ_CHIERARCHICAL'
| nPatients | CLUS_1 | CLUS_2 | CLUS_3 |
|---|---|---|---|
| ALL | 82 | 84 | 39 |
| 16Q LOSS MUTATED | 44 | 27 | 7 |
| 16Q LOSS WILD-TYPE | 38 | 57 | 32 |
Figure S33. Get High-res Image Gene #69: '16q loss' versus Molecular Subtype #4: 'MRNASEQ_CHIERARCHICAL'

P value = 0.00011 (Fisher's exact test), Q value = 0.069
Table S34. Gene #69: '16q loss' versus Molecular Subtype #8: 'MIRSEQ_MATURE_CHIERARCHICAL'
| nPatients | CLUS_1 | CLUS_2 | CLUS_3 | CLUS_4 | CLUS_5 |
|---|---|---|---|---|---|
| ALL | 25 | 44 | 36 | 74 | 24 |
| 16Q LOSS MUTATED | 8 | 12 | 23 | 32 | 2 |
| 16Q LOSS WILD-TYPE | 17 | 32 | 13 | 42 | 22 |
Figure S34. Get High-res Image Gene #69: '16q loss' versus Molecular Subtype #8: 'MIRSEQ_MATURE_CHIERARCHICAL'

P value = 0.00031 (Fisher's exact test), Q value = 0.19
Table S35. Gene #70: '17p loss' versus Molecular Subtype #1: 'CN_CNMF'
| nPatients | CLUS_1 | CLUS_2 | CLUS_3 |
|---|---|---|---|
| ALL | 51 | 82 | 75 |
| 17P LOSS MUTATED | 19 | 38 | 53 |
| 17P LOSS WILD-TYPE | 32 | 44 | 22 |
Figure S35. Get High-res Image Gene #70: '17p loss' versus Molecular Subtype #1: 'CN_CNMF'

P value = 0.00027 (Fisher's exact test), Q value = 0.17
Table S36. Gene #74: '19p loss' versus Molecular Subtype #1: 'CN_CNMF'
| nPatients | CLUS_1 | CLUS_2 | CLUS_3 |
|---|---|---|---|
| ALL | 51 | 82 | 75 |
| 19P LOSS MUTATED | 7 | 3 | 19 |
| 19P LOSS WILD-TYPE | 44 | 79 | 56 |
Figure S36. Get High-res Image Gene #74: '19p loss' versus Molecular Subtype #1: 'CN_CNMF'

P value = 1e-04 (Fisher's exact test), Q value = 0.062
Table S37. Gene #75: '19q loss' versus Molecular Subtype #1: 'CN_CNMF'
| nPatients | CLUS_1 | CLUS_2 | CLUS_3 |
|---|---|---|---|
| ALL | 51 | 82 | 75 |
| 19Q LOSS MUTATED | 6 | 1 | 16 |
| 19Q LOSS WILD-TYPE | 45 | 81 | 59 |
Figure S37. Get High-res Image Gene #75: '19q loss' versus Molecular Subtype #1: 'CN_CNMF'

-
Copy number data file = transformed.cor.cli.txt
-
Molecular subtypes file = LIHC-TP.transferedmergedcluster.txt
-
Number of patients = 208
-
Number of significantly arm-level cnvs = 80
-
Number of molecular subtypes = 8
-
Exclude genes that fewer than K tumors have mutations, K = 3
For binary or multi-class clinical features (nominal or ordinal), two-tailed Fisher's exact tests (Fisher 1922) were used to estimate the P values using the 'fisher.test' function in R
For multiple hypothesis correction, Q value is the False Discovery Rate (FDR) analogue of the P value (Benjamini and Hochberg 1995), defined as the minimum FDR at which the test may be called significant. We used the 'Benjamini and Hochberg' method of 'p.adjust' function in R to convert P values into Q values.
In addition to the links below, the full results of the analysis summarized in this report can also be downloaded programmatically using firehose_get, or interactively from either the Broad GDAC website or TCGA Data Coordination Center Portal.