This pipeline computes the correlation between significant arm-level copy number variations (cnvs) and selected clinical features.
Testing the association between copy number variation 36 arm-level events and 7 clinical features across 21 patients, one significant finding detected with Q value < 0.25.
-
11q loss cnv correlated to 'Time to Death'.
Table 1. Get Full Table Overview of the association between significant copy number variation of 36 arm-level events and 7 clinical features. Shown in the table are P values (Q values). Thresholded by Q value < 0.25, one significant finding detected.
|
Clinical Features |
Time to Death |
AGE |
NEOPLASM DISEASESTAGE |
PATHOLOGY T STAGE |
PATHOLOGY N STAGE |
PATHOLOGY M STAGE |
GENDER | ||
| nCNV (%) | nWild-Type | logrank test | Wilcoxon-test | Fisher's exact test | Fisher's exact test | Fisher's exact test | Fisher's exact test | Fisher's exact test | |
| 11q loss | 3 (14%) | 18 |
0.00035 (0.0868) |
0.42 (1.00) |
0.22 (1.00) |
0.531 (1.00) |
1 (1.00) |
0.526 (1.00) |
|
| 1q gain | 5 (24%) | 16 |
0.203 (1.00) |
0.869 (1.00) |
1 (1.00) |
1 (1.00) |
0.613 (1.00) |
0.444 (1.00) |
0.598 (1.00) |
| 3p gain | 4 (19%) | 17 |
0.942 (1.00) |
0.928 (1.00) |
1 (1.00) |
0.253 (1.00) |
1 (1.00) |
1 (1.00) |
0.544 (1.00) |
| 3q gain | 5 (24%) | 16 |
0.41 (1.00) |
0.619 (1.00) |
0.877 (1.00) |
0.0475 (1.00) |
1 (1.00) |
1 (1.00) |
0.115 (1.00) |
| 5p gain | 6 (29%) | 15 |
0.568 (1.00) |
0.149 (1.00) |
0.816 (1.00) |
0.146 (1.00) |
1 (1.00) |
0.723 (1.00) |
0.291 (1.00) |
| 5q gain | 3 (14%) | 18 |
0.469 (1.00) |
0.174 (1.00) |
1 (1.00) |
1 (1.00) |
1 (1.00) |
0.26 (1.00) |
0.184 (1.00) |
| 7p gain | 5 (24%) | 16 |
0.187 (1.00) |
0.282 (1.00) |
0.879 (1.00) |
0.0475 (1.00) |
0.613 (1.00) |
1 (1.00) |
0.598 (1.00) |
| 7q gain | 5 (24%) | 16 |
0.187 (1.00) |
0.282 (1.00) |
0.879 (1.00) |
0.0475 (1.00) |
0.613 (1.00) |
1 (1.00) |
0.598 (1.00) |
| 8p gain | 3 (14%) | 18 |
0.0319 (1.00) |
1 (1.00) |
0.404 (1.00) |
0.0421 (1.00) |
1 (1.00) |
0.605 (1.00) |
1 (1.00) |
| 8q gain | 4 (19%) | 17 |
0.0319 (1.00) |
0.56 (1.00) |
0.119 (1.00) |
0.253 (1.00) |
1 (1.00) |
1 (1.00) |
1 (1.00) |
| 12p gain | 5 (24%) | 16 |
0.492 (1.00) |
0.385 (1.00) |
0.368 (1.00) |
0.325 (1.00) |
0.613 (1.00) |
1 (1.00) |
1 (1.00) |
| 12q gain | 5 (24%) | 16 |
0.492 (1.00) |
0.385 (1.00) |
0.371 (1.00) |
0.325 (1.00) |
0.613 (1.00) |
1 (1.00) |
1 (1.00) |
| 16p gain | 5 (24%) | 16 |
0.412 (1.00) |
0.741 (1.00) |
0.55 (1.00) |
1 (1.00) |
0.549 (1.00) |
1 (1.00) |
0.598 (1.00) |
| 16q gain | 6 (29%) | 15 |
0.143 (1.00) |
0.483 (1.00) |
0.503 (1.00) |
0.631 (1.00) |
0.613 (1.00) |
1 (1.00) |
0.291 (1.00) |
| 1p loss | 3 (14%) | 18 |
0.6 (1.00) |
1 (1.00) |
0.085 (1.00) |
0.257 (1.00) |
0.521 (1.00) |
1 (1.00) |
1 (1.00) |
| 2q loss | 3 (14%) | 18 |
0.0342 (1.00) |
0.481 (1.00) |
1 (1.00) |
0.531 (1.00) |
0.521 (1.00) |
0.603 (1.00) |
0.015 (1.00) |
| 4p loss | 8 (38%) | 13 |
0.555 (1.00) |
0.856 (1.00) |
0.769 (1.00) |
0.646 (1.00) |
0.325 (1.00) |
1 (1.00) |
0.146 (1.00) |
| 4q loss | 7 (33%) | 14 |
0.416 (1.00) |
0.477 (1.00) |
0.916 (1.00) |
0.346 (1.00) |
0.354 (1.00) |
0.744 (1.00) |
0.12 (1.00) |
| 6q loss | 10 (48%) | 11 |
0.721 (1.00) |
0.916 (1.00) |
0.0302 (1.00) |
0.659 (1.00) |
0.157 (1.00) |
1 (1.00) |
0.635 (1.00) |
| 8p loss | 3 (14%) | 18 |
0.0754 (1.00) |
0.131 (1.00) |
0.0841 (1.00) |
0.257 (1.00) |
0.521 (1.00) |
1 (1.00) |
1 (1.00) |
| 9p loss | 6 (29%) | 15 |
0.153 (1.00) |
0.725 (1.00) |
0.501 (1.00) |
0.146 (1.00) |
1 (1.00) |
0.723 (1.00) |
0.123 (1.00) |
| 9q loss | 6 (29%) | 15 |
0.223 (1.00) |
1 (1.00) |
0.637 (1.00) |
0.631 (1.00) |
1 (1.00) |
0.721 (1.00) |
0.623 (1.00) |
| 10p loss | 6 (29%) | 15 |
0.284 (1.00) |
0.558 (1.00) |
0.501 (1.00) |
0.631 (1.00) |
1 (1.00) |
0.253 (1.00) |
0.623 (1.00) |
| 10q loss | 5 (24%) | 16 |
0.177 (1.00) |
0.591 (1.00) |
0.369 (1.00) |
1 (1.00) |
0.267 (1.00) |
0.115 (1.00) |
1 (1.00) |
| 13q loss | 13 (62%) | 8 |
0.0333 (1.00) |
0.384 (1.00) |
0.623 (1.00) |
0.085 (1.00) |
0.613 (1.00) |
0.111 (1.00) |
1 (1.00) |
| 14q loss | 7 (33%) | 14 |
0.354 (1.00) |
0.167 (1.00) |
0.914 (1.00) |
0.346 (1.00) |
1 (1.00) |
0.74 (1.00) |
0.12 (1.00) |
| 15q loss | 4 (19%) | 17 |
0.0808 (1.00) |
0.964 (1.00) |
0.588 (1.00) |
0.618 (1.00) |
0.521 (1.00) |
0.393 (1.00) |
1 (1.00) |
| 17p loss | 4 (19%) | 17 |
0.419 (1.00) |
0.858 (1.00) |
0.164 (1.00) |
0.618 (1.00) |
1 (1.00) |
0.389 (1.00) |
1 (1.00) |
| 17q loss | 3 (14%) | 18 |
0.54 (1.00) |
1 (1.00) |
0.322 (1.00) |
1 (1.00) |
0.262 (1.00) |
1 (1.00) |
|
| 18p loss | 4 (19%) | 17 |
0.214 (1.00) |
0.822 (1.00) |
0.312 (1.00) |
1 (1.00) |
0.267 (1.00) |
1 (1.00) |
1 (1.00) |
| 18q loss | 4 (19%) | 17 |
0.214 (1.00) |
0.822 (1.00) |
0.309 (1.00) |
1 (1.00) |
0.267 (1.00) |
1 (1.00) |
1 (1.00) |
| 19q loss | 3 (14%) | 18 |
0.161 (1.00) |
0.724 (1.00) |
0.0703 (1.00) |
0.257 (1.00) |
0.0143 (1.00) |
0.526 (1.00) |
|
| 20p loss | 4 (19%) | 17 |
0.251 (1.00) |
0.445 (1.00) |
0.584 (1.00) |
0.618 (1.00) |
1 (1.00) |
0.393 (1.00) |
1 (1.00) |
| 21q loss | 3 (14%) | 18 |
0.32 (1.00) |
0.65 (1.00) |
0.32 (1.00) |
1 (1.00) |
0.262 (1.00) |
1 (1.00) |
|
| 22q loss | 15 (71%) | 6 |
0.674 (1.00) |
1 (1.00) |
0.5 (1.00) |
1 (1.00) |
0.303 (1.00) |
1 (1.00) |
1 (1.00) |
| xq loss | 4 (19%) | 17 |
0.44 (1.00) |
0.858 (1.00) |
0.585 (1.00) |
1 (1.00) |
0.267 (1.00) |
0.219 (1.00) |
1 (1.00) |
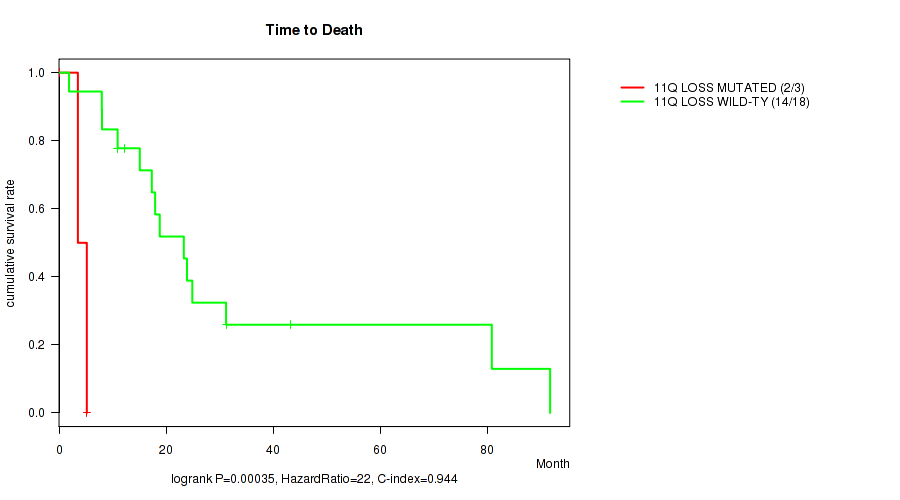
P value = 0.00035 (logrank test), Q value = 0.087
Table S1. Gene #24: '11q loss' versus Clinical Feature #1: 'Time to Death'
| nPatients | nDeath | Duration Range (Median), Month | |
|---|---|---|---|
| ALL | 21 | 16 | 0.2 - 91.7 (17.3) |
| 11Q LOSS MUTATED | 3 | 2 | 0.2 - 5.2 (3.5) |
| 11Q LOSS WILD-TYPE | 18 | 14 | 1.9 - 91.7 (18.4) |
Figure S1. Get High-res Image Gene #24: '11q loss' versus Clinical Feature #1: 'Time to Death'
-
Copy number data file = transformed.cor.cli.txt
-
Clinical data file = MESO-TP.merged_data.txt
-
Number of patients = 21
-
Number of significantly arm-level cnvs = 36
-
Number of selected clinical features = 7
-
Exclude regions that fewer than K tumors have mutations, K = 3
For survival clinical features, the Kaplan-Meier survival curves of tumors with and without gene mutations were plotted and the statistical significance P values were estimated by logrank test (Bland and Altman 2004) using the 'survdiff' function in R
For binary or multi-class clinical features (nominal or ordinal), two-tailed Fisher's exact tests (Fisher 1922) were used to estimate the P values using the 'fisher.test' function in R
For multiple hypothesis correction, Q value is the False Discovery Rate (FDR) analogue of the P value (Benjamini and Hochberg 1995), defined as the minimum FDR at which the test may be called significant. We used the 'Benjamini and Hochberg' method of 'p.adjust' function in R to convert P values into Q values.
In addition to the links below, the full results of the analysis summarized in this report can also be downloaded programmatically using firehose_get, or interactively from either the Broad GDAC website or TCGA Data Coordination Center Portal.