This pipeline computes the correlation between significant copy number variation (cnv focal) genes and selected clinical features.
Testing the association between copy number variation 21 focal events and 7 clinical features across 21 patients, one significant finding detected with Q value < 0.25.
-
del_10p15.1 cnv correlated to 'Time to Death'.
Table 1. Get Full Table Overview of the association between significant copy number variation of 21 focal events and 7 clinical features. Shown in the table are P values (Q values). Thresholded by Q value < 0.25, one significant finding detected.
|
Clinical Features |
Time to Death |
AGE |
NEOPLASM DISEASESTAGE |
PATHOLOGY T STAGE |
PATHOLOGY N STAGE |
PATHOLOGY M STAGE |
GENDER | ||
| nCNV (%) | nWild-Type | logrank test | Wilcoxon-test | Fisher's exact test | Fisher's exact test | Fisher's exact test | Fisher's exact test | Fisher's exact test | |
| del 10p15 1 | 7 (33%) | 14 |
0.000607 (0.0886) |
0.97 (1.00) |
0.399 (1.00) |
0.0555 (1.00) |
0.115 (1.00) |
1 (1.00) |
1 (1.00) |
| amp 12p11 21 | 7 (33%) | 14 |
0.894 (1.00) |
0.525 (1.00) |
0.226 (1.00) |
0.346 (1.00) |
1 (1.00) |
1 (1.00) |
1 (1.00) |
| amp 17q24 3 | 7 (33%) | 14 |
0.211 (1.00) |
0.262 (1.00) |
0.263 (1.00) |
1 (1.00) |
1 (1.00) |
0.397 (1.00) |
0.0609 (1.00) |
| amp 20p12 1 | 3 (14%) | 18 |
0.358 (1.00) |
0.45 (1.00) |
0.0697 (1.00) |
0.257 (1.00) |
1 (1.00) |
0.526 (1.00) |
|
| del 1p36 23 | 8 (38%) | 13 |
0.0673 (1.00) |
0.384 (1.00) |
0.409 (1.00) |
0.646 (1.00) |
0.325 (1.00) |
0.755 (1.00) |
0.631 (1.00) |
| del 1p22 1 | 8 (38%) | 13 |
0.634 (1.00) |
0.245 (1.00) |
0.41 (1.00) |
0.4 (1.00) |
0.325 (1.00) |
0.302 (1.00) |
1 (1.00) |
| del 2q35 | 4 (19%) | 17 |
0.123 (1.00) |
0.822 (1.00) |
1 (1.00) |
0.253 (1.00) |
0.267 (1.00) |
0.622 (1.00) |
0.00251 (0.363) |
| del 3p21 1 | 15 (71%) | 6 |
0.294 (1.00) |
0.185 (1.00) |
1 (1.00) |
0.336 (1.00) |
0.303 (1.00) |
0.723 (1.00) |
0.291 (1.00) |
| del 4q26 | 11 (52%) | 10 |
0.108 (1.00) |
0.916 (1.00) |
0.132 (1.00) |
0.0237 (1.00) |
0.336 (1.00) |
0.454 (1.00) |
0.149 (1.00) |
| del 5q23 2 | 3 (14%) | 18 |
0.199 (1.00) |
0.763 (1.00) |
0.501 (1.00) |
1 (1.00) |
0.521 (1.00) |
0.0702 (1.00) |
0.526 (1.00) |
| del 6q22 31 | 13 (62%) | 8 |
0.739 (1.00) |
0.611 (1.00) |
0.0304 (1.00) |
0.164 (1.00) |
0.161 (1.00) |
0.756 (1.00) |
0.631 (1.00) |
| del 9p21 3 | 12 (57%) | 9 |
0.0182 (1.00) |
1 (1.00) |
0.798 (1.00) |
0.0669 (1.00) |
1 (1.00) |
0.223 (1.00) |
1 (1.00) |
| del 10q22 3 | 4 (19%) | 17 |
0.342 (1.00) |
0.858 (1.00) |
0.586 (1.00) |
0.618 (1.00) |
0.521 (1.00) |
0.394 (1.00) |
1 (1.00) |
| del 10q24 1 | 6 (29%) | 15 |
0.0342 (1.00) |
0.668 (1.00) |
0.5 (1.00) |
0.631 (1.00) |
0.26 (1.00) |
0.253 (1.00) |
0.623 (1.00) |
| del 13q13 3 | 15 (71%) | 6 |
0.148 (1.00) |
0.149 (1.00) |
0.633 (1.00) |
0.0456 (1.00) |
0.131 (1.00) |
0.0112 (1.00) |
1 (1.00) |
| del 14q11 2 | 7 (33%) | 14 |
0.354 (1.00) |
0.167 (1.00) |
0.915 (1.00) |
0.346 (1.00) |
1 (1.00) |
0.744 (1.00) |
0.12 (1.00) |
| del 14q32 31 | 8 (38%) | 13 |
0.961 (1.00) |
0.102 (1.00) |
0.767 (1.00) |
0.646 (1.00) |
1 (1.00) |
1 (1.00) |
0.146 (1.00) |
| del 15q15 1 | 8 (38%) | 13 |
0.285 (1.00) |
1 (1.00) |
0.237 (1.00) |
0.646 (1.00) |
0.613 (1.00) |
0.593 (1.00) |
1 (1.00) |
| del 16q21 | 6 (29%) | 15 |
0.108 (1.00) |
0.242 (1.00) |
1 (1.00) |
0.631 (1.00) |
0.613 (1.00) |
1 (1.00) |
0.623 (1.00) |
| del 16q24 1 | 6 (29%) | 15 |
0.221 (1.00) |
0.119 (1.00) |
1 (1.00) |
0.631 (1.00) |
1 (1.00) |
1 (1.00) |
0.623 (1.00) |
| del 22q12 2 | 15 (71%) | 6 |
0.674 (1.00) |
1 (1.00) |
0.501 (1.00) |
1 (1.00) |
0.303 (1.00) |
1 (1.00) |
1 (1.00) |
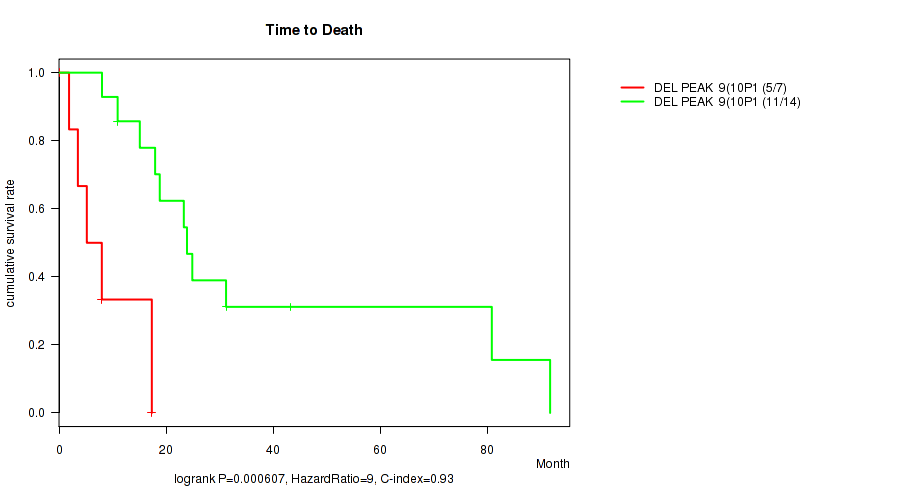
P value = 0.000607 (logrank test), Q value = 0.089
Table S1. Gene #12: 'del_10p15.1' versus Clinical Feature #1: 'Time to Death'
| nPatients | nDeath | Duration Range (Median), Month | |
|---|---|---|---|
| ALL | 21 | 16 | 0.2 - 91.7 (17.3) |
| DEL PEAK 9(10P15.1) MUTATED | 7 | 5 | 0.2 - 17.3 (5.2) |
| DEL PEAK 9(10P15.1) WILD-TYPE | 14 | 11 | 8.0 - 91.7 (23.6) |
Figure S1. Get High-res Image Gene #12: 'del_10p15.1' versus Clinical Feature #1: 'Time to Death'
-
Copy number data file = transformed.cor.cli.txt
-
Clinical data file = MESO-TP.merged_data.txt
-
Number of patients = 21
-
Number of significantly focal cnvs = 21
-
Number of selected clinical features = 7
-
Exclude genes that fewer than K tumors have mutations, K = 3
For survival clinical features, the Kaplan-Meier survival curves of tumors with and without gene mutations were plotted and the statistical significance P values were estimated by logrank test (Bland and Altman 2004) using the 'survdiff' function in R
For binary or multi-class clinical features (nominal or ordinal), two-tailed Fisher's exact tests (Fisher 1922) were used to estimate the P values using the 'fisher.test' function in R
For multiple hypothesis correction, Q value is the False Discovery Rate (FDR) analogue of the P value (Benjamini and Hochberg 1995), defined as the minimum FDR at which the test may be called significant. We used the 'Benjamini and Hochberg' method of 'p.adjust' function in R to convert P values into Q values.
In addition to the links below, the full results of the analysis summarized in this report can also be downloaded programmatically using firehose_get, or interactively from either the Broad GDAC website or TCGA Data Coordination Center Portal.