This pipeline computes the correlation between significant arm-level copy number variations (cnvs) and molecular subtypes.
Testing the association between copy number variation 76 arm-level events and 8 molecular subtypes across 102 patients, 26 significant findings detected with P value < 0.05 and Q value < 0.25.
-
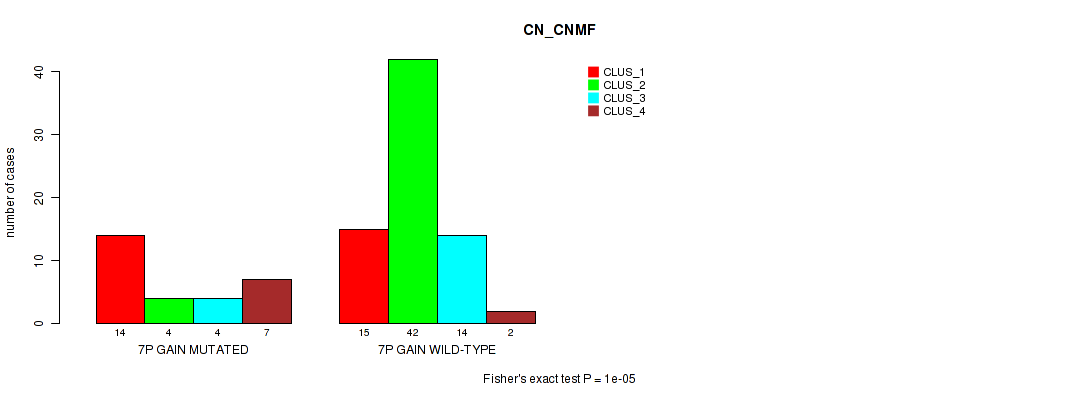
7p gain cnv correlated to 'CN_CNMF'.
-
7q gain cnv correlated to 'CN_CNMF'.
-
8q gain cnv correlated to 'MIRSEQ_CHIERARCHICAL'.
-
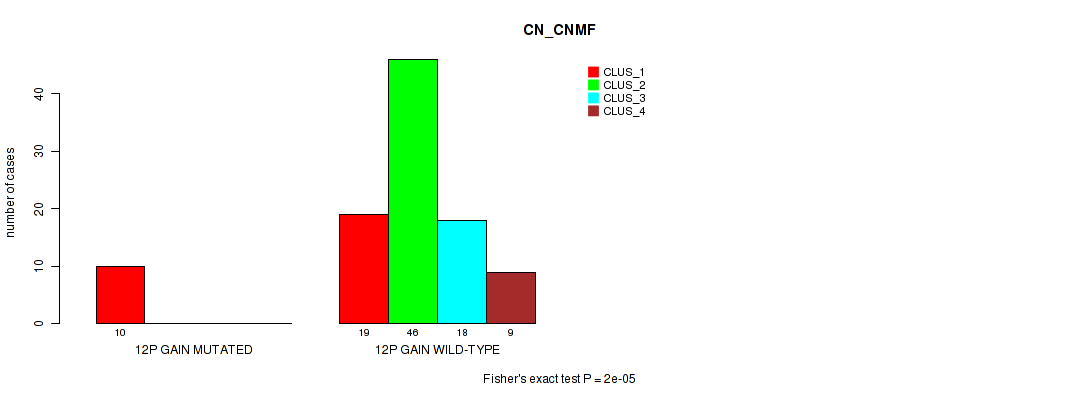
12p gain cnv correlated to 'CN_CNMF'.
-
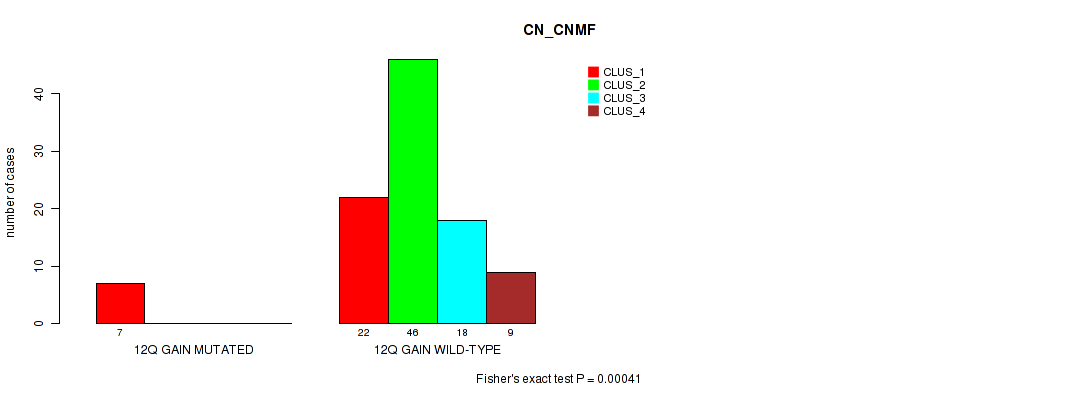
12q gain cnv correlated to 'CN_CNMF'.
-
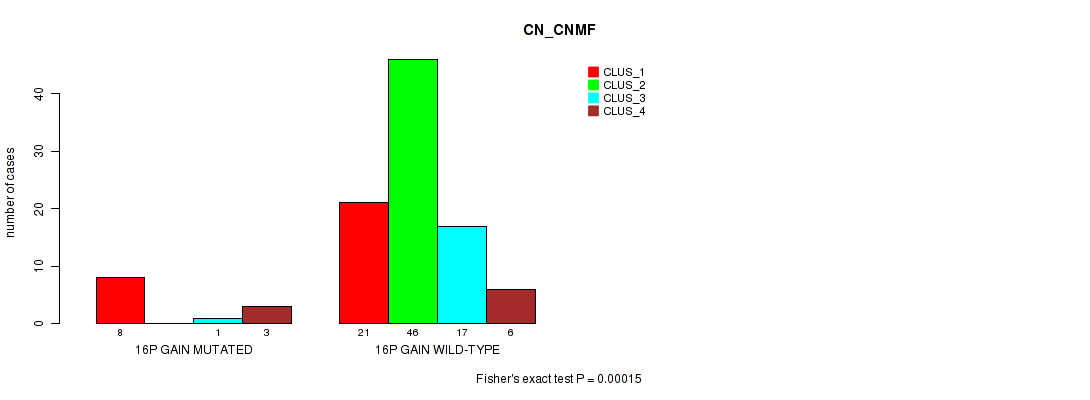
16p gain cnv correlated to 'CN_CNMF'.
-
16q gain cnv correlated to 'CN_CNMF'.
-
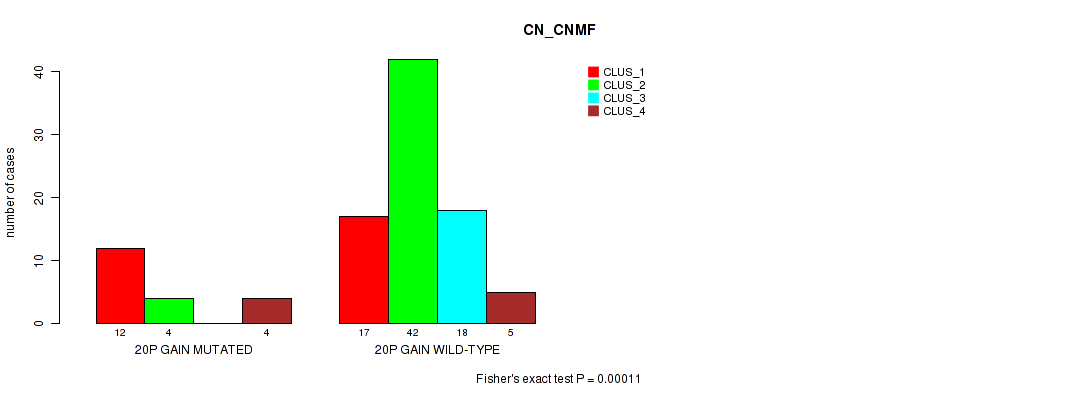
20p gain cnv correlated to 'CN_CNMF'.
-
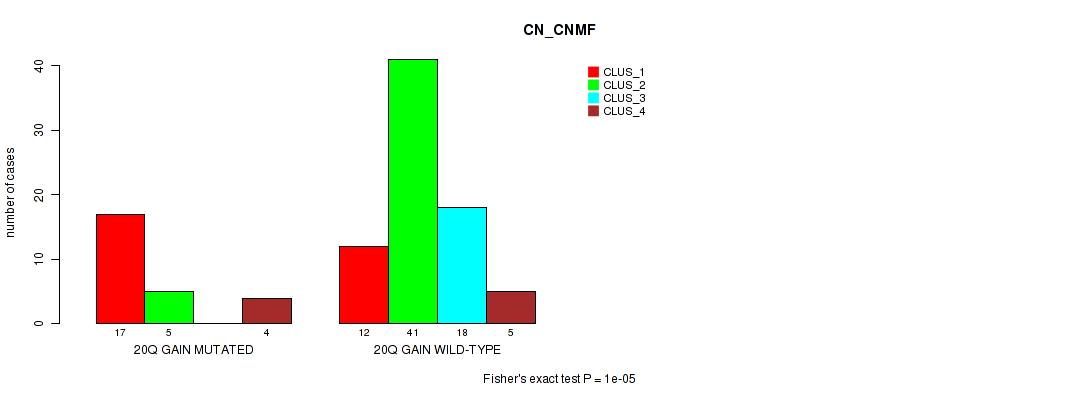
20q gain cnv correlated to 'CN_CNMF'.
-
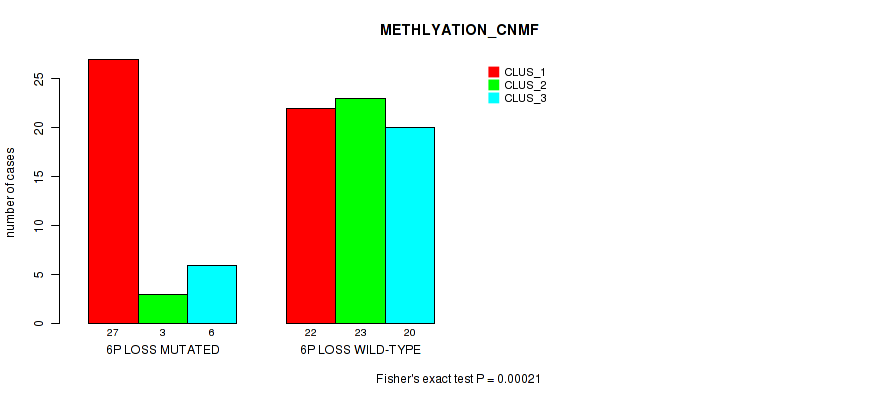
6p loss cnv correlated to 'METHLYATION_CNMF'.
-
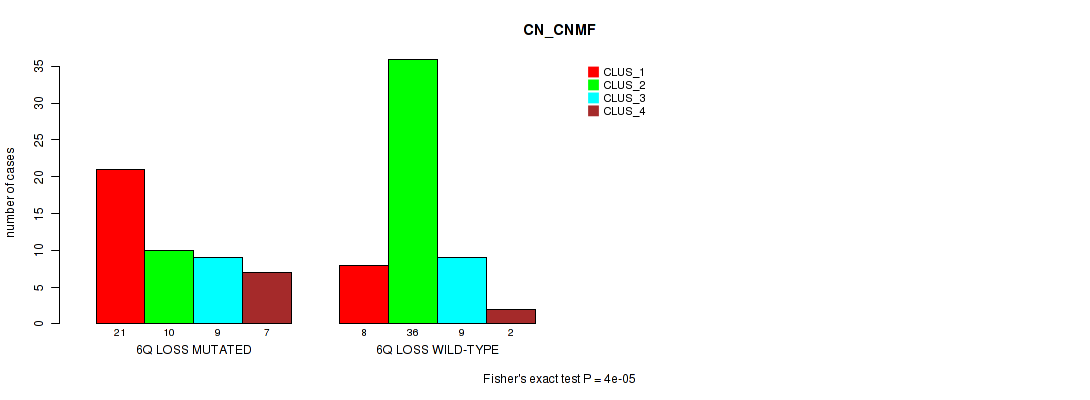
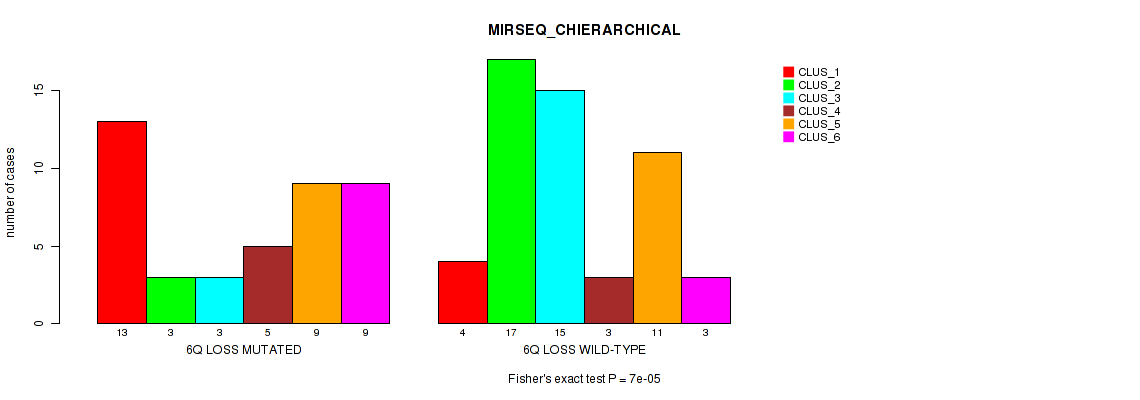
6q loss cnv correlated to 'CN_CNMF', 'METHLYATION_CNMF', 'MIRSEQ_CHIERARCHICAL', and 'MIRSEQ_MATURE_CHIERARCHICAL'.
-
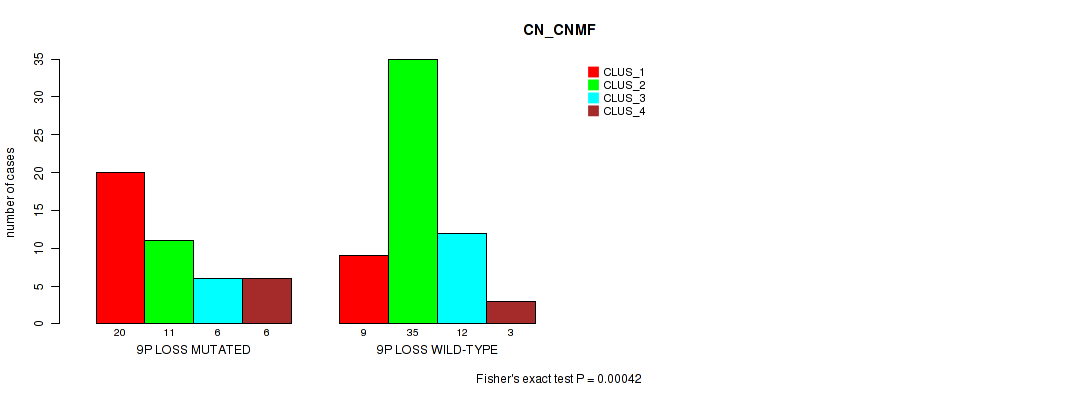
9p loss cnv correlated to 'CN_CNMF'.
-
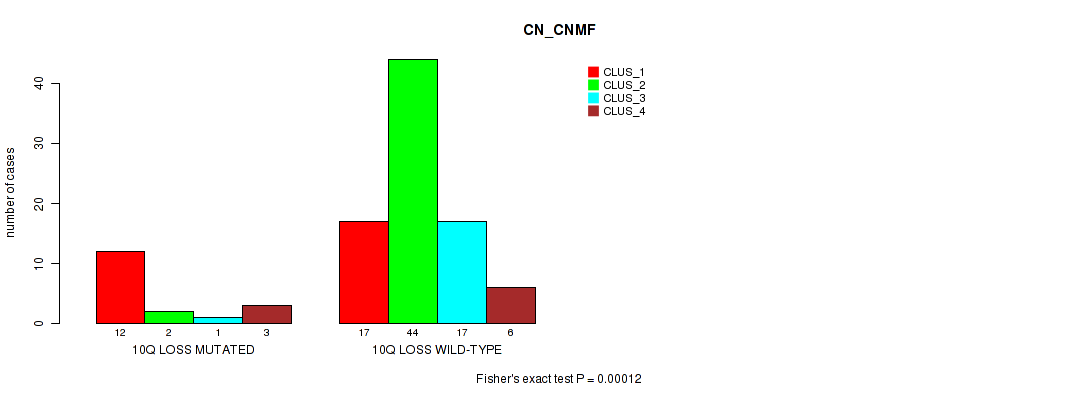
10q loss cnv correlated to 'CN_CNMF'.
-
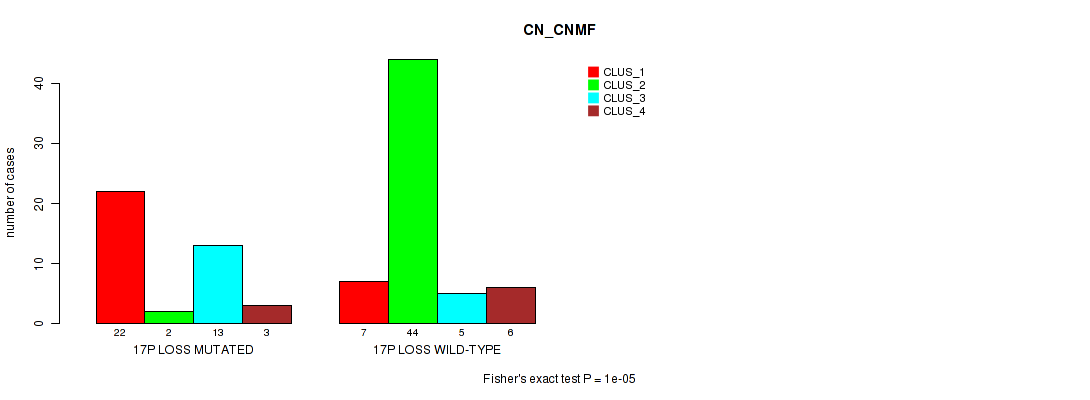
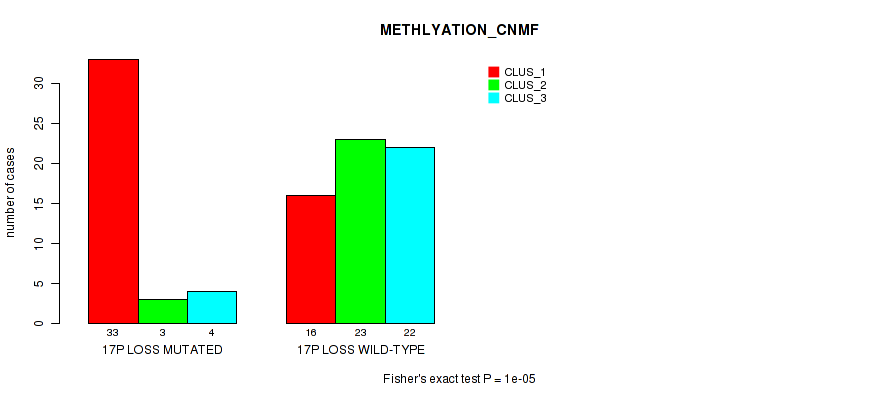
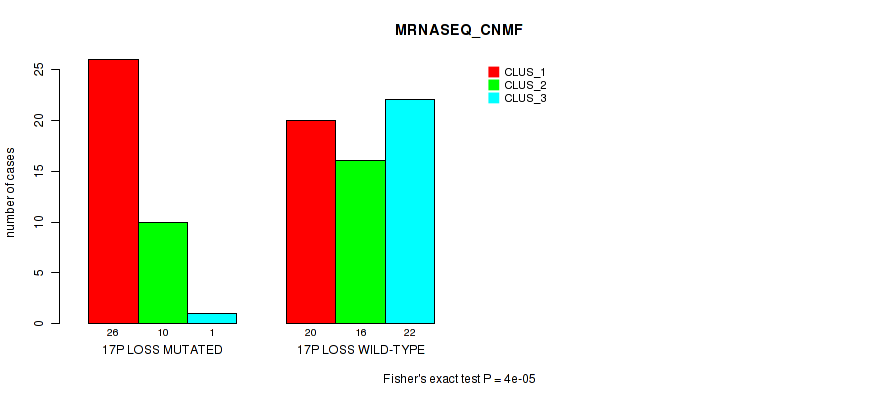
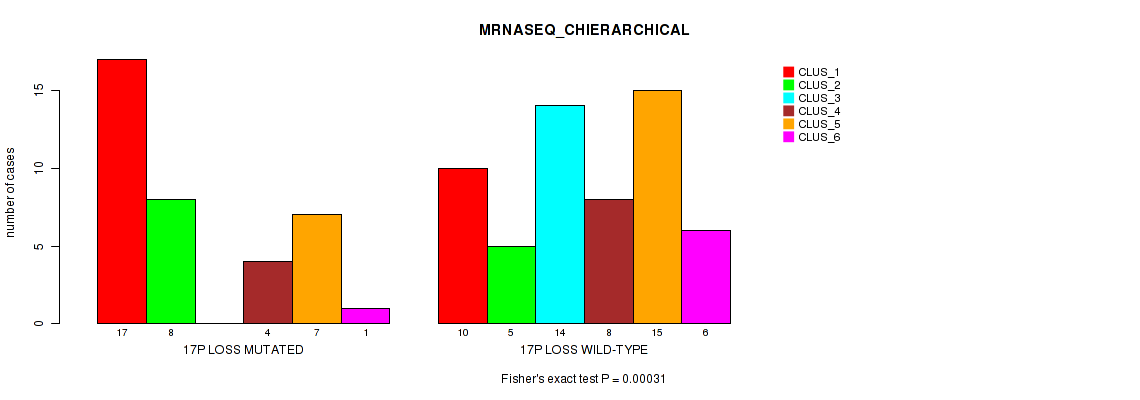
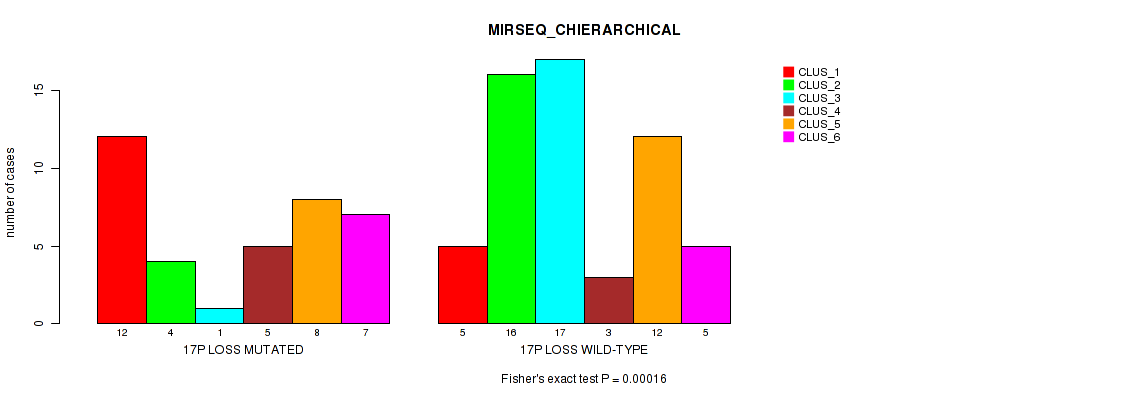
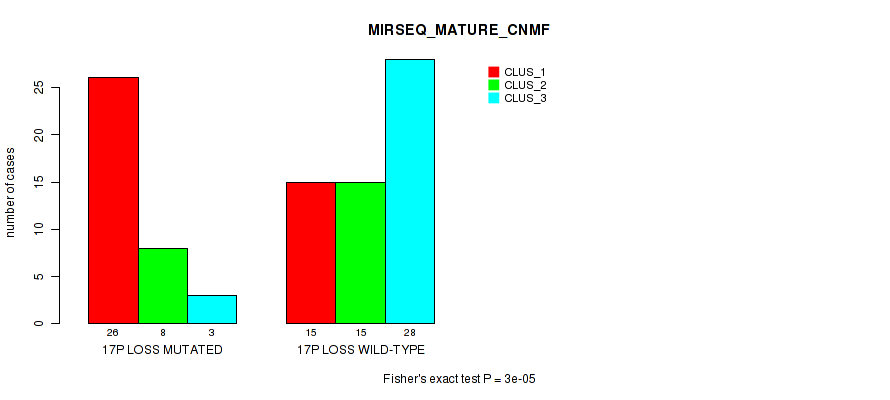
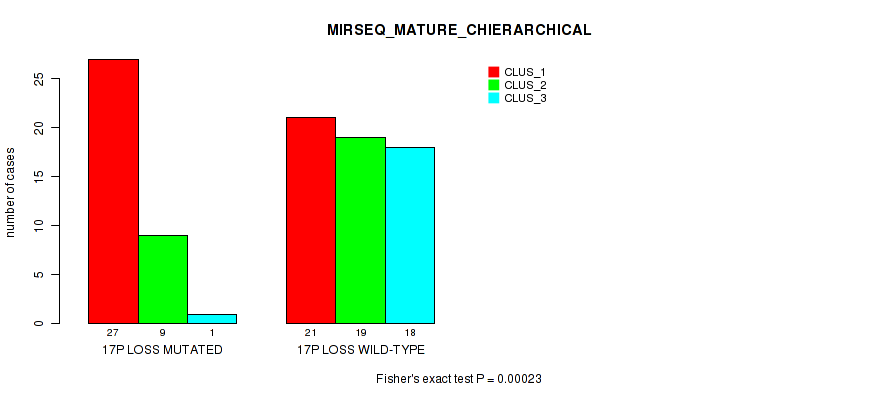
17p loss cnv correlated to 'CN_CNMF', 'METHLYATION_CNMF', 'MRNASEQ_CNMF', 'MRNASEQ_CHIERARCHICAL', 'MIRSEQ_CNMF', 'MIRSEQ_CHIERARCHICAL', 'MIRSEQ_MATURE_CNMF', and 'MIRSEQ_MATURE_CHIERARCHICAL'.
-
17q loss cnv correlated to 'CN_CNMF'.
-
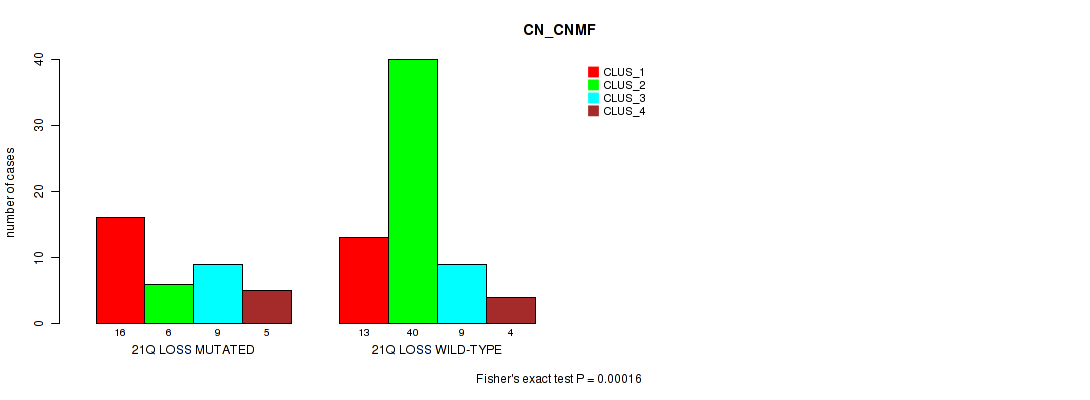
21q loss cnv correlated to 'CN_CNMF'.
Table 1. Get Full Table Overview of the association between significant copy number variation of 76 arm-level events and 8 molecular subtypes. Shown in the table are P values (Q values). Thresholded by P value < 0.05 and Q value < 0.25, 26 significant findings detected.
|
Clinical Features |
CN CNMF |
METHLYATION CNMF |
MRNASEQ CNMF |
MRNASEQ CHIERARCHICAL |
MIRSEQ CNMF |
MIRSEQ CHIERARCHICAL |
MIRSEQ MATURE CNMF |
MIRSEQ MATURE CHIERARCHICAL |
||
| nCNV (%) | nWild-Type | Fisher's exact test | Fisher's exact test | Fisher's exact test | Fisher's exact test | Fisher's exact test | Fisher's exact test | Fisher's exact test | Fisher's exact test | |
| 17p loss | 40 (39%) | 62 |
1e-05 (0.00608) |
1e-05 (0.00608) |
4e-05 (0.024) |
0.00031 (0.181) |
1e-05 (0.00608) |
0.00016 (0.0946) |
3e-05 (0.0181) |
0.00023 (0.135) |
| 6q loss | 47 (46%) | 55 |
4e-05 (0.024) |
3e-05 (0.0181) |
0.00377 (1.00) |
0.00369 (1.00) |
0.013 (1.00) |
7e-05 (0.0419) |
0.0182 (1.00) |
0.0001 (0.0596) |
| 7p gain | 29 (28%) | 73 |
1e-05 (0.00608) |
0.00546 (1.00) |
0.0116 (1.00) |
0.123 (1.00) |
0.211 (1.00) |
0.041 (1.00) |
0.0156 (1.00) |
0.00538 (1.00) |
| 7q gain | 25 (25%) | 77 |
0.00016 (0.0946) |
0.0516 (1.00) |
0.0497 (1.00) |
0.323 (1.00) |
0.398 (1.00) |
0.157 (1.00) |
0.0329 (1.00) |
0.0446 (1.00) |
| 8q gain | 26 (25%) | 76 |
0.00075 (0.431) |
0.00557 (1.00) |
0.533 (1.00) |
0.107 (1.00) |
0.767 (1.00) |
0.00012 (0.0713) |
0.242 (1.00) |
0.144 (1.00) |
| 12p gain | 10 (10%) | 92 |
2e-05 (0.0121) |
0.0251 (1.00) |
0.662 (1.00) |
0.581 (1.00) |
0.959 (1.00) |
0.00053 (0.306) |
0.486 (1.00) |
0.334 (1.00) |
| 12q gain | 7 (7%) | 95 |
0.00041 (0.239) |
0.0324 (1.00) |
0.176 (1.00) |
0.685 (1.00) |
0.857 (1.00) |
0.00732 (1.00) |
0.365 (1.00) |
0.507 (1.00) |
| 16p gain | 12 (12%) | 90 |
0.00015 (0.0888) |
0.0603 (1.00) |
0.791 (1.00) |
0.436 (1.00) |
0.169 (1.00) |
0.0849 (1.00) |
0.213 (1.00) |
0.0461 (1.00) |
| 16q gain | 13 (13%) | 89 |
0.00019 (0.112) |
0.0239 (1.00) |
0.684 (1.00) |
0.332 (1.00) |
0.121 (1.00) |
0.0151 (1.00) |
0.146 (1.00) |
0.0225 (1.00) |
| 20p gain | 20 (20%) | 82 |
0.00011 (0.0654) |
0.0668 (1.00) |
0.354 (1.00) |
0.568 (1.00) |
0.951 (1.00) |
0.025 (1.00) |
0.577 (1.00) |
0.0876 (1.00) |
| 20q gain | 26 (25%) | 76 |
1e-05 (0.00608) |
0.0921 (1.00) |
0.326 (1.00) |
0.558 (1.00) |
0.851 (1.00) |
0.00596 (1.00) |
0.243 (1.00) |
0.071 (1.00) |
| 6p loss | 37 (36%) | 65 |
0.00053 (0.306) |
0.00021 (0.123) |
0.133 (1.00) |
0.316 (1.00) |
0.344 (1.00) |
0.0116 (1.00) |
0.273 (1.00) |
0.0236 (1.00) |
| 9p loss | 43 (42%) | 59 |
0.00042 (0.245) |
0.59 (1.00) |
0.0283 (1.00) |
0.0737 (1.00) |
0.0944 (1.00) |
0.118 (1.00) |
0.00109 (0.622) |
0.0262 (1.00) |
| 10q loss | 18 (18%) | 84 |
0.00012 (0.0713) |
0.15 (1.00) |
0.0876 (1.00) |
0.0215 (1.00) |
0.676 (1.00) |
0.0033 (1.00) |
0.299 (1.00) |
0.021 (1.00) |
| 17q loss | 15 (15%) | 87 |
9e-05 (0.0537) |
0.0345 (1.00) |
0.345 (1.00) |
0.588 (1.00) |
0.537 (1.00) |
0.159 (1.00) |
0.379 (1.00) |
0.576 (1.00) |
| 21q loss | 36 (35%) | 66 |
0.00016 (0.0946) |
0.00071 (0.409) |
0.0368 (1.00) |
0.0398 (1.00) |
0.26 (1.00) |
0.00825 (1.00) |
0.0789 (1.00) |
0.0345 (1.00) |
| 1p gain | 8 (8%) | 94 |
0.552 (1.00) |
0.577 (1.00) |
0.598 (1.00) |
0.775 (1.00) |
0.332 (1.00) |
0.169 (1.00) |
0.274 (1.00) |
0.589 (1.00) |
| 1q gain | 29 (28%) | 73 |
0.00924 (1.00) |
0.116 (1.00) |
0.0352 (1.00) |
0.471 (1.00) |
0.159 (1.00) |
0.0623 (1.00) |
0.0113 (1.00) |
0.162 (1.00) |
| 2p gain | 7 (7%) | 95 |
0.0885 (1.00) |
0.0329 (1.00) |
0.887 (1.00) |
0.0132 (1.00) |
1 (1.00) |
0.00808 (1.00) |
1 (1.00) |
0.183 (1.00) |
| 2q gain | 8 (8%) | 94 |
0.261 (1.00) |
0.0956 (1.00) |
0.725 (1.00) |
0.0281 (1.00) |
1 (1.00) |
0.0343 (1.00) |
1 (1.00) |
0.493 (1.00) |
| 3p gain | 5 (5%) | 97 |
0.431 (1.00) |
0.442 (1.00) |
1 (1.00) |
1 (1.00) |
0.0419 (1.00) |
0.0341 (1.00) |
0.437 (1.00) |
0.839 (1.00) |
| 3q gain | 10 (10%) | 92 |
0.0356 (1.00) |
0.0253 (1.00) |
0.35 (1.00) |
0.137 (1.00) |
0.555 (1.00) |
0.027 (1.00) |
0.635 (1.00) |
0.493 (1.00) |
| 4p gain | 3 (3%) | 99 |
0.382 (1.00) |
0.8 (1.00) |
0.216 (1.00) |
0.102 (1.00) |
0.0361 (1.00) |
0.163 (1.00) |
0.332 (1.00) |
0.77 (1.00) |
| 4q gain | 3 (3%) | 99 |
0.379 (1.00) |
0.803 (1.00) |
0.216 (1.00) |
0.101 (1.00) |
0.0352 (1.00) |
0.16 (1.00) |
0.327 (1.00) |
0.773 (1.00) |
| 5p gain | 13 (13%) | 89 |
0.0132 (1.00) |
0.203 (1.00) |
0.685 (1.00) |
0.741 (1.00) |
0.538 (1.00) |
0.0976 (1.00) |
0.147 (1.00) |
0.789 (1.00) |
| 5q gain | 10 (10%) | 92 |
0.0226 (1.00) |
0.574 (1.00) |
0.831 (1.00) |
0.342 (1.00) |
0.822 (1.00) |
0.355 (1.00) |
0.585 (1.00) |
0.905 (1.00) |
| 8p gain | 14 (14%) | 88 |
0.00523 (1.00) |
0.105 (1.00) |
0.796 (1.00) |
0.367 (1.00) |
0.975 (1.00) |
0.00871 (1.00) |
1 (1.00) |
0.578 (1.00) |
| 9p gain | 3 (3%) | 99 |
0.212 (1.00) |
0.434 (1.00) |
0.802 (1.00) |
0.94 (1.00) |
0.152 (1.00) |
0.0427 (1.00) |
0.333 (1.00) |
1 (1.00) |
| 9q gain | 4 (4%) | 98 |
0.139 (1.00) |
0.177 (1.00) |
0.466 (1.00) |
0.933 (1.00) |
0.558 (1.00) |
0.208 (1.00) |
0.815 (1.00) |
0.811 (1.00) |
| 10p gain | 5 (5%) | 97 |
0.0999 (1.00) |
0.442 (1.00) |
0.464 (1.00) |
0.932 (1.00) |
0.682 (1.00) |
0.426 (1.00) |
0.276 (1.00) |
0.812 (1.00) |
| 10q gain | 7 (7%) | 95 |
0.0773 (1.00) |
0.343 (1.00) |
0.593 (1.00) |
0.604 (1.00) |
0.598 (1.00) |
0.37 (1.00) |
0.247 (1.00) |
0.588 (1.00) |
| 11p gain | 10 (10%) | 92 |
0.0157 (1.00) |
0.14 (1.00) |
0.834 (1.00) |
0.838 (1.00) |
0.707 (1.00) |
0.427 (1.00) |
0.532 (1.00) |
0.407 (1.00) |
| 11q gain | 8 (8%) | 94 |
0.0801 (1.00) |
0.17 (1.00) |
0.89 (1.00) |
0.612 (1.00) |
0.954 (1.00) |
0.437 (1.00) |
0.645 (1.00) |
0.492 (1.00) |
| 13q gain | 11 (11%) | 91 |
0.615 (1.00) |
0.755 (1.00) |
0.313 (1.00) |
0.286 (1.00) |
0.316 (1.00) |
0.316 (1.00) |
0.695 (1.00) |
0.197 (1.00) |
| 14q gain | 13 (13%) | 89 |
0.00707 (1.00) |
0.206 (1.00) |
0.503 (1.00) |
0.0883 (1.00) |
0.112 (1.00) |
0.491 (1.00) |
0.438 (1.00) |
0.788 (1.00) |
| 15q gain | 8 (8%) | 94 |
0.259 (1.00) |
0.343 (1.00) |
0.303 (1.00) |
0.0571 (1.00) |
0.706 (1.00) |
0.74 (1.00) |
0.605 (1.00) |
0.446 (1.00) |
| 17q gain | 5 (5%) | 97 |
0.14 (1.00) |
1 (1.00) |
0.509 (1.00) |
0.394 (1.00) |
0.854 (1.00) |
0.0869 (1.00) |
0.848 (1.00) |
0.589 (1.00) |
| 18p gain | 15 (15%) | 87 |
0.00144 (0.819) |
0.0128 (1.00) |
0.00133 (0.758) |
0.117 (1.00) |
0.0113 (1.00) |
0.00568 (1.00) |
0.00249 (1.00) |
0.00242 (1.00) |
| 18q gain | 5 (5%) | 97 |
0.0646 (1.00) |
0.182 (1.00) |
0.18 (1.00) |
0.614 (1.00) |
0.451 (1.00) |
0.301 (1.00) |
0.56 (1.00) |
0.241 (1.00) |
| 19p gain | 5 (5%) | 97 |
0.21 (1.00) |
0.44 (1.00) |
1 (1.00) |
0.0271 (1.00) |
0.641 (1.00) |
0.53 (1.00) |
0.847 (1.00) |
0.589 (1.00) |
| 19q gain | 13 (13%) | 89 |
0.0767 (1.00) |
0.107 (1.00) |
0.688 (1.00) |
0.273 (1.00) |
0.534 (1.00) |
0.544 (1.00) |
0.327 (1.00) |
0.578 (1.00) |
| 22q gain | 6 (6%) | 96 |
0.00293 (1.00) |
0.0749 (1.00) |
0.0746 (1.00) |
0.227 (1.00) |
0.856 (1.00) |
0.0875 (1.00) |
0.846 (1.00) |
0.59 (1.00) |
| xq gain | 4 (4%) | 98 |
1 (1.00) |
0.367 (1.00) |
0.36 (1.00) |
0.596 (1.00) |
0.503 (1.00) |
0.194 (1.00) |
0.68 (1.00) |
0.313 (1.00) |
| 1p loss | 19 (19%) | 83 |
0.0263 (1.00) |
0.0265 (1.00) |
0.0173 (1.00) |
0.071 (1.00) |
0.119 (1.00) |
0.0291 (1.00) |
0.0837 (1.00) |
0.306 (1.00) |
| 1q loss | 5 (5%) | 97 |
0.208 (1.00) |
0.44 (1.00) |
0.466 (1.00) |
0.932 (1.00) |
0.819 (1.00) |
0.429 (1.00) |
1 (1.00) |
0.809 (1.00) |
| 2p loss | 7 (7%) | 95 |
0.177 (1.00) |
0.677 (1.00) |
0.6 (1.00) |
0.677 (1.00) |
0.819 (1.00) |
0.726 (1.00) |
0.785 (1.00) |
0.592 (1.00) |
| 2q loss | 3 (3%) | 99 |
0.0764 (1.00) |
0.433 (1.00) |
0.433 (1.00) |
0.595 (1.00) |
0.747 (1.00) |
0.367 (1.00) |
0.789 (1.00) |
0.302 (1.00) |
| 3p loss | 17 (17%) | 85 |
0.0179 (1.00) |
0.7 (1.00) |
0.491 (1.00) |
0.811 (1.00) |
0.875 (1.00) |
0.166 (1.00) |
0.137 (1.00) |
0.254 (1.00) |
| 3q loss | 13 (13%) | 89 |
0.263 (1.00) |
0.642 (1.00) |
0.407 (1.00) |
0.863 (1.00) |
0.657 (1.00) |
0.361 (1.00) |
0.127 (1.00) |
0.513 (1.00) |
| 4p loss | 13 (13%) | 89 |
0.285 (1.00) |
0.317 (1.00) |
0.185 (1.00) |
0.546 (1.00) |
0.326 (1.00) |
0.266 (1.00) |
0.214 (1.00) |
0.208 (1.00) |
| 4q loss | 13 (13%) | 89 |
0.285 (1.00) |
0.048 (1.00) |
0.131 (1.00) |
0.0997 (1.00) |
0.359 (1.00) |
0.472 (1.00) |
0.191 (1.00) |
0.0307 (1.00) |
| 5p loss | 6 (6%) | 96 |
0.0146 (1.00) |
0.0318 (1.00) |
0.475 (1.00) |
0.514 (1.00) |
0.198 (1.00) |
0.311 (1.00) |
0.0874 (1.00) |
0.33 (1.00) |
| 5q loss | 9 (9%) | 93 |
0.00051 (0.296) |
0.00431 (1.00) |
0.221 (1.00) |
0.687 (1.00) |
0.417 (1.00) |
0.0684 (1.00) |
0.0122 (1.00) |
0.209 (1.00) |
| 7p loss | 3 (3%) | 99 |
0.0735 (1.00) |
0.437 (1.00) |
0.801 (1.00) |
0.94 (1.00) |
0.562 (1.00) |
0.00762 (1.00) |
0.177 (1.00) |
0.433 (1.00) |
| 7q loss | 4 (4%) | 98 |
0.0248 (1.00) |
0.181 (1.00) |
0.808 (1.00) |
0.933 (1.00) |
0.681 (1.00) |
0.0561 (1.00) |
0.277 (1.00) |
0.658 (1.00) |
| 8p loss | 19 (19%) | 83 |
0.0333 (1.00) |
0.0672 (1.00) |
0.0949 (1.00) |
0.268 (1.00) |
0.337 (1.00) |
0.0497 (1.00) |
0.102 (1.00) |
0.0477 (1.00) |
| 8q loss | 7 (7%) | 95 |
0.528 (1.00) |
0.679 (1.00) |
0.344 (1.00) |
0.291 (1.00) |
0.675 (1.00) |
0.683 (1.00) |
0.367 (1.00) |
0.589 (1.00) |
| 9q loss | 28 (27%) | 74 |
0.0808 (1.00) |
0.805 (1.00) |
0.372 (1.00) |
0.892 (1.00) |
0.252 (1.00) |
0.521 (1.00) |
0.066 (1.00) |
0.7 (1.00) |
| 10p loss | 19 (19%) | 83 |
0.00646 (1.00) |
0.102 (1.00) |
0.161 (1.00) |
0.322 (1.00) |
0.382 (1.00) |
0.00052 (0.301) |
0.126 (1.00) |
0.0686 (1.00) |
| 11p loss | 9 (9%) | 93 |
0.213 (1.00) |
0.133 (1.00) |
0.0433 (1.00) |
0.196 (1.00) |
0.0716 (1.00) |
0.251 (1.00) |
0.18 (1.00) |
0.0971 (1.00) |
| 11q loss | 11 (11%) | 91 |
0.465 (1.00) |
0.653 (1.00) |
0.227 (1.00) |
0.292 (1.00) |
0.821 (1.00) |
0.564 (1.00) |
0.755 (1.00) |
0.751 (1.00) |
| 12p loss | 9 (9%) | 93 |
0.0184 (1.00) |
0.0432 (1.00) |
0.0834 (1.00) |
0.104 (1.00) |
0.469 (1.00) |
0.227 (1.00) |
0.901 (1.00) |
0.0574 (1.00) |
| 12q loss | 12 (12%) | 90 |
0.0182 (1.00) |
0.561 (1.00) |
0.388 (1.00) |
0.361 (1.00) |
0.963 (1.00) |
0.495 (1.00) |
0.53 (1.00) |
0.493 (1.00) |
| 13q loss | 13 (13%) | 89 |
0.0024 (1.00) |
0.0239 (1.00) |
0.00573 (1.00) |
0.12 (1.00) |
0.106 (1.00) |
0.0421 (1.00) |
0.0713 (1.00) |
0.00991 (1.00) |
| 14q loss | 8 (8%) | 94 |
1 (1.00) |
0.575 (1.00) |
0.643 (1.00) |
0.611 (1.00) |
0.646 (1.00) |
0.838 (1.00) |
0.804 (1.00) |
0.341 (1.00) |
| 15q loss | 17 (17%) | 85 |
0.00084 (0.481) |
0.00076 (0.436) |
0.0106 (1.00) |
0.00532 (1.00) |
0.0495 (1.00) |
0.00919 (1.00) |
0.055 (1.00) |
0.0025 (1.00) |
| 16p loss | 5 (5%) | 97 |
0.0585 (1.00) |
0.074 (1.00) |
0.508 (1.00) |
0.771 (1.00) |
0.418 (1.00) |
0.312 (1.00) |
0.2 (1.00) |
0.589 (1.00) |
| 16q loss | 5 (5%) | 97 |
0.0578 (1.00) |
0.074 (1.00) |
0.508 (1.00) |
0.771 (1.00) |
0.417 (1.00) |
0.371 (1.00) |
0.198 (1.00) |
0.591 (1.00) |
| 18p loss | 34 (33%) | 68 |
0.353 (1.00) |
0.0983 (1.00) |
0.426 (1.00) |
0.802 (1.00) |
0.559 (1.00) |
0.495 (1.00) |
0.0569 (1.00) |
0.151 (1.00) |
| 18q loss | 58 (57%) | 44 |
0.00432 (1.00) |
0.104 (1.00) |
0.116 (1.00) |
0.166 (1.00) |
0.257 (1.00) |
0.59 (1.00) |
0.192 (1.00) |
0.405 (1.00) |
| 19p loss | 14 (14%) | 88 |
0.00044 (0.256) |
0.00103 (0.589) |
0.0191 (1.00) |
0.0573 (1.00) |
0.346 (1.00) |
0.00049 (0.285) |
0.0872 (1.00) |
0.0845 (1.00) |
| 19q loss | 9 (9%) | 93 |
0.0324 (1.00) |
0.0426 (1.00) |
0.0487 (1.00) |
0.0539 (1.00) |
0.232 (1.00) |
0.0236 (1.00) |
0.483 (1.00) |
0.0608 (1.00) |
| 20p loss | 12 (12%) | 90 |
0.0139 (1.00) |
0.174 (1.00) |
0.119 (1.00) |
0.244 (1.00) |
0.0168 (1.00) |
0.0893 (1.00) |
0.0094 (1.00) |
0.227 (1.00) |
| 20q loss | 5 (5%) | 97 |
0.058 (1.00) |
0.0738 (1.00) |
0.506 (1.00) |
0.495 (1.00) |
0.415 (1.00) |
0.131 (1.00) |
0.2 (1.00) |
0.588 (1.00) |
| 22q loss | 26 (25%) | 76 |
0.00178 (1.00) |
0.0166 (1.00) |
0.107 (1.00) |
0.11 (1.00) |
0.301 (1.00) |
0.00449 (1.00) |
0.183 (1.00) |
0.189 (1.00) |
| xq loss | 9 (9%) | 93 |
0.00657 (1.00) |
0.11 (1.00) |
0.275 (1.00) |
0.5 (1.00) |
0.241 (1.00) |
0.383 (1.00) |
0.0652 (1.00) |
0.385 (1.00) |
P value = 1e-05 (Fisher's exact test), Q value = 0.0061
Table S1. Gene #11: '7p gain' versus Molecular Subtype #1: 'CN_CNMF'
| nPatients | CLUS_1 | CLUS_2 | CLUS_3 | CLUS_4 |
|---|---|---|---|---|
| ALL | 29 | 46 | 18 | 9 |
| 7P GAIN MUTATED | 14 | 4 | 4 | 7 |
| 7P GAIN WILD-TYPE | 15 | 42 | 14 | 2 |
Figure S1. Get High-res Image Gene #11: '7p gain' versus Molecular Subtype #1: 'CN_CNMF'
P value = 0.00016 (Fisher's exact test), Q value = 0.095
Table S2. Gene #12: '7q gain' versus Molecular Subtype #1: 'CN_CNMF'
| nPatients | CLUS_1 | CLUS_2 | CLUS_3 | CLUS_4 |
|---|---|---|---|---|
| ALL | 29 | 46 | 18 | 9 |
| 7Q GAIN MUTATED | 12 | 4 | 3 | 6 |
| 7Q GAIN WILD-TYPE | 17 | 42 | 15 | 3 |
Figure S2. Get High-res Image Gene #12: '7q gain' versus Molecular Subtype #1: 'CN_CNMF'

P value = 0.00012 (Fisher's exact test), Q value = 0.071
Table S3. Gene #14: '8q gain' versus Molecular Subtype #6: 'MIRSEQ_CHIERARCHICAL'
| nPatients | CLUS_1 | CLUS_2 | CLUS_3 | CLUS_4 | CLUS_5 | CLUS_6 |
|---|---|---|---|---|---|---|
| ALL | 17 | 20 | 18 | 8 | 20 | 12 |
| 8Q GAIN MUTATED | 7 | 0 | 2 | 6 | 4 | 5 |
| 8Q GAIN WILD-TYPE | 10 | 20 | 16 | 2 | 16 | 7 |
Figure S3. Get High-res Image Gene #14: '8q gain' versus Molecular Subtype #6: 'MIRSEQ_CHIERARCHICAL'

P value = 2e-05 (Fisher's exact test), Q value = 0.012
Table S4. Gene #21: '12p gain' versus Molecular Subtype #1: 'CN_CNMF'
| nPatients | CLUS_1 | CLUS_2 | CLUS_3 | CLUS_4 |
|---|---|---|---|---|
| ALL | 29 | 46 | 18 | 9 |
| 12P GAIN MUTATED | 10 | 0 | 0 | 0 |
| 12P GAIN WILD-TYPE | 19 | 46 | 18 | 9 |
Figure S4. Get High-res Image Gene #21: '12p gain' versus Molecular Subtype #1: 'CN_CNMF'
P value = 0.00041 (Fisher's exact test), Q value = 0.24
Table S5. Gene #22: '12q gain' versus Molecular Subtype #1: 'CN_CNMF'
| nPatients | CLUS_1 | CLUS_2 | CLUS_3 | CLUS_4 |
|---|---|---|---|---|
| ALL | 29 | 46 | 18 | 9 |
| 12Q GAIN MUTATED | 7 | 0 | 0 | 0 |
| 12Q GAIN WILD-TYPE | 22 | 46 | 18 | 9 |
Figure S5. Get High-res Image Gene #22: '12q gain' versus Molecular Subtype #1: 'CN_CNMF'
P value = 0.00015 (Fisher's exact test), Q value = 0.089
Table S6. Gene #26: '16p gain' versus Molecular Subtype #1: 'CN_CNMF'
| nPatients | CLUS_1 | CLUS_2 | CLUS_3 | CLUS_4 |
|---|---|---|---|---|
| ALL | 29 | 46 | 18 | 9 |
| 16P GAIN MUTATED | 8 | 0 | 1 | 3 |
| 16P GAIN WILD-TYPE | 21 | 46 | 17 | 6 |
Figure S6. Get High-res Image Gene #26: '16p gain' versus Molecular Subtype #1: 'CN_CNMF'
P value = 0.00019 (Fisher's exact test), Q value = 0.11
Table S7. Gene #27: '16q gain' versus Molecular Subtype #1: 'CN_CNMF'
| nPatients | CLUS_1 | CLUS_2 | CLUS_3 | CLUS_4 |
|---|---|---|---|---|
| ALL | 29 | 46 | 18 | 9 |
| 16Q GAIN MUTATED | 8 | 0 | 2 | 3 |
| 16Q GAIN WILD-TYPE | 21 | 46 | 16 | 6 |
Figure S7. Get High-res Image Gene #27: '16q gain' versus Molecular Subtype #1: 'CN_CNMF'

P value = 0.00011 (Fisher's exact test), Q value = 0.065
Table S8. Gene #33: '20p gain' versus Molecular Subtype #1: 'CN_CNMF'
| nPatients | CLUS_1 | CLUS_2 | CLUS_3 | CLUS_4 |
|---|---|---|---|---|
| ALL | 29 | 46 | 18 | 9 |
| 20P GAIN MUTATED | 12 | 4 | 0 | 4 |
| 20P GAIN WILD-TYPE | 17 | 42 | 18 | 5 |
Figure S8. Get High-res Image Gene #33: '20p gain' versus Molecular Subtype #1: 'CN_CNMF'
P value = 1e-05 (Fisher's exact test), Q value = 0.0061
Table S9. Gene #34: '20q gain' versus Molecular Subtype #1: 'CN_CNMF'
| nPatients | CLUS_1 | CLUS_2 | CLUS_3 | CLUS_4 |
|---|---|---|---|---|
| ALL | 29 | 46 | 18 | 9 |
| 20Q GAIN MUTATED | 17 | 5 | 0 | 4 |
| 20Q GAIN WILD-TYPE | 12 | 41 | 18 | 5 |
Figure S9. Get High-res Image Gene #34: '20q gain' versus Molecular Subtype #1: 'CN_CNMF'
P value = 0.00021 (Fisher's exact test), Q value = 0.12
Table S10. Gene #47: '6p loss' versus Molecular Subtype #2: 'METHLYATION_CNMF'
| nPatients | CLUS_1 | CLUS_2 | CLUS_3 |
|---|---|---|---|
| ALL | 49 | 26 | 26 |
| 6P LOSS MUTATED | 27 | 3 | 6 |
| 6P LOSS WILD-TYPE | 22 | 23 | 20 |
Figure S10. Get High-res Image Gene #47: '6p loss' versus Molecular Subtype #2: 'METHLYATION_CNMF'
P value = 4e-05 (Fisher's exact test), Q value = 0.024
Table S11. Gene #48: '6q loss' versus Molecular Subtype #1: 'CN_CNMF'
| nPatients | CLUS_1 | CLUS_2 | CLUS_3 | CLUS_4 |
|---|---|---|---|---|
| ALL | 29 | 46 | 18 | 9 |
| 6Q LOSS MUTATED | 21 | 10 | 9 | 7 |
| 6Q LOSS WILD-TYPE | 8 | 36 | 9 | 2 |
Figure S11. Get High-res Image Gene #48: '6q loss' versus Molecular Subtype #1: 'CN_CNMF'
P value = 3e-05 (Fisher's exact test), Q value = 0.018
Table S12. Gene #48: '6q loss' versus Molecular Subtype #2: 'METHLYATION_CNMF'
| nPatients | CLUS_1 | CLUS_2 | CLUS_3 |
|---|---|---|---|
| ALL | 49 | 26 | 26 |
| 6Q LOSS MUTATED | 33 | 4 | 9 |
| 6Q LOSS WILD-TYPE | 16 | 22 | 17 |
Figure S12. Get High-res Image Gene #48: '6q loss' versus Molecular Subtype #2: 'METHLYATION_CNMF'

P value = 7e-05 (Fisher's exact test), Q value = 0.042
Table S13. Gene #48: '6q loss' versus Molecular Subtype #6: 'MIRSEQ_CHIERARCHICAL'
| nPatients | CLUS_1 | CLUS_2 | CLUS_3 | CLUS_4 | CLUS_5 | CLUS_6 |
|---|---|---|---|---|---|---|
| ALL | 17 | 20 | 18 | 8 | 20 | 12 |
| 6Q LOSS MUTATED | 13 | 3 | 3 | 5 | 9 | 9 |
| 6Q LOSS WILD-TYPE | 4 | 17 | 15 | 3 | 11 | 3 |
Figure S13. Get High-res Image Gene #48: '6q loss' versus Molecular Subtype #6: 'MIRSEQ_CHIERARCHICAL'
P value = 1e-04 (Fisher's exact test), Q value = 0.06
Table S14. Gene #48: '6q loss' versus Molecular Subtype #8: 'MIRSEQ_MATURE_CHIERARCHICAL'
| nPatients | CLUS_1 | CLUS_2 | CLUS_3 |
|---|---|---|---|
| ALL | 48 | 28 | 19 |
| 6Q LOSS MUTATED | 31 | 8 | 3 |
| 6Q LOSS WILD-TYPE | 17 | 20 | 16 |
Figure S14. Get High-res Image Gene #48: '6q loss' versus Molecular Subtype #8: 'MIRSEQ_MATURE_CHIERARCHICAL'

P value = 0.00042 (Fisher's exact test), Q value = 0.24
Table S15. Gene #53: '9p loss' versus Molecular Subtype #1: 'CN_CNMF'
| nPatients | CLUS_1 | CLUS_2 | CLUS_3 | CLUS_4 |
|---|---|---|---|---|
| ALL | 29 | 46 | 18 | 9 |
| 9P LOSS MUTATED | 20 | 11 | 6 | 6 |
| 9P LOSS WILD-TYPE | 9 | 35 | 12 | 3 |
Figure S15. Get High-res Image Gene #53: '9p loss' versus Molecular Subtype #1: 'CN_CNMF'
P value = 0.00012 (Fisher's exact test), Q value = 0.071
Table S16. Gene #56: '10q loss' versus Molecular Subtype #1: 'CN_CNMF'
| nPatients | CLUS_1 | CLUS_2 | CLUS_3 | CLUS_4 |
|---|---|---|---|---|
| ALL | 29 | 46 | 18 | 9 |
| 10Q LOSS MUTATED | 12 | 2 | 1 | 3 |
| 10Q LOSS WILD-TYPE | 17 | 44 | 17 | 6 |
Figure S16. Get High-res Image Gene #56: '10q loss' versus Molecular Subtype #1: 'CN_CNMF'
P value = 1e-05 (Fisher's exact test), Q value = 0.0061
Table S17. Gene #66: '17p loss' versus Molecular Subtype #1: 'CN_CNMF'
| nPatients | CLUS_1 | CLUS_2 | CLUS_3 | CLUS_4 |
|---|---|---|---|---|
| ALL | 29 | 46 | 18 | 9 |
| 17P LOSS MUTATED | 22 | 2 | 13 | 3 |
| 17P LOSS WILD-TYPE | 7 | 44 | 5 | 6 |
Figure S17. Get High-res Image Gene #66: '17p loss' versus Molecular Subtype #1: 'CN_CNMF'
P value = 1e-05 (Fisher's exact test), Q value = 0.0061
Table S18. Gene #66: '17p loss' versus Molecular Subtype #2: 'METHLYATION_CNMF'
| nPatients | CLUS_1 | CLUS_2 | CLUS_3 |
|---|---|---|---|
| ALL | 49 | 26 | 26 |
| 17P LOSS MUTATED | 33 | 3 | 4 |
| 17P LOSS WILD-TYPE | 16 | 23 | 22 |
Figure S18. Get High-res Image Gene #66: '17p loss' versus Molecular Subtype #2: 'METHLYATION_CNMF'
P value = 4e-05 (Fisher's exact test), Q value = 0.024
Table S19. Gene #66: '17p loss' versus Molecular Subtype #3: 'MRNASEQ_CNMF'
| nPatients | CLUS_1 | CLUS_2 | CLUS_3 |
|---|---|---|---|
| ALL | 46 | 26 | 23 |
| 17P LOSS MUTATED | 26 | 10 | 1 |
| 17P LOSS WILD-TYPE | 20 | 16 | 22 |
Figure S19. Get High-res Image Gene #66: '17p loss' versus Molecular Subtype #3: 'MRNASEQ_CNMF'
P value = 0.00031 (Fisher's exact test), Q value = 0.18
Table S20. Gene #66: '17p loss' versus Molecular Subtype #4: 'MRNASEQ_CHIERARCHICAL'
| nPatients | CLUS_1 | CLUS_2 | CLUS_3 | CLUS_4 | CLUS_5 | CLUS_6 |
|---|---|---|---|---|---|---|
| ALL | 27 | 13 | 14 | 12 | 22 | 7 |
| 17P LOSS MUTATED | 17 | 8 | 0 | 4 | 7 | 1 |
| 17P LOSS WILD-TYPE | 10 | 5 | 14 | 8 | 15 | 6 |
Figure S20. Get High-res Image Gene #66: '17p loss' versus Molecular Subtype #4: 'MRNASEQ_CHIERARCHICAL'
P value = 1e-05 (Fisher's exact test), Q value = 0.0061
Table S21. Gene #66: '17p loss' versus Molecular Subtype #5: 'MIRSEQ_CNMF'
| nPatients | CLUS_1 | CLUS_2 | CLUS_3 | CLUS_4 |
|---|---|---|---|---|
| ALL | 37 | 25 | 13 | 20 |
| 17P LOSS MUTATED | 26 | 8 | 1 | 2 |
| 17P LOSS WILD-TYPE | 11 | 17 | 12 | 18 |
Figure S21. Get High-res Image Gene #66: '17p loss' versus Molecular Subtype #5: 'MIRSEQ_CNMF'

P value = 0.00016 (Fisher's exact test), Q value = 0.095
Table S22. Gene #66: '17p loss' versus Molecular Subtype #6: 'MIRSEQ_CHIERARCHICAL'
| nPatients | CLUS_1 | CLUS_2 | CLUS_3 | CLUS_4 | CLUS_5 | CLUS_6 |
|---|---|---|---|---|---|---|
| ALL | 17 | 20 | 18 | 8 | 20 | 12 |
| 17P LOSS MUTATED | 12 | 4 | 1 | 5 | 8 | 7 |
| 17P LOSS WILD-TYPE | 5 | 16 | 17 | 3 | 12 | 5 |
Figure S22. Get High-res Image Gene #66: '17p loss' versus Molecular Subtype #6: 'MIRSEQ_CHIERARCHICAL'
P value = 3e-05 (Fisher's exact test), Q value = 0.018
Table S23. Gene #66: '17p loss' versus Molecular Subtype #7: 'MIRSEQ_MATURE_CNMF'
| nPatients | CLUS_1 | CLUS_2 | CLUS_3 |
|---|---|---|---|
| ALL | 41 | 23 | 31 |
| 17P LOSS MUTATED | 26 | 8 | 3 |
| 17P LOSS WILD-TYPE | 15 | 15 | 28 |
Figure S23. Get High-res Image Gene #66: '17p loss' versus Molecular Subtype #7: 'MIRSEQ_MATURE_CNMF'
P value = 0.00023 (Fisher's exact test), Q value = 0.13
Table S24. Gene #66: '17p loss' versus Molecular Subtype #8: 'MIRSEQ_MATURE_CHIERARCHICAL'
| nPatients | CLUS_1 | CLUS_2 | CLUS_3 |
|---|---|---|---|
| ALL | 48 | 28 | 19 |
| 17P LOSS MUTATED | 27 | 9 | 1 |
| 17P LOSS WILD-TYPE | 21 | 19 | 18 |
Figure S24. Get High-res Image Gene #66: '17p loss' versus Molecular Subtype #8: 'MIRSEQ_MATURE_CHIERARCHICAL'
P value = 9e-05 (Fisher's exact test), Q value = 0.054
Table S25. Gene #67: '17q loss' versus Molecular Subtype #1: 'CN_CNMF'
| nPatients | CLUS_1 | CLUS_2 | CLUS_3 | CLUS_4 |
|---|---|---|---|---|
| ALL | 29 | 46 | 18 | 9 |
| 17Q LOSS MUTATED | 10 | 0 | 3 | 2 |
| 17Q LOSS WILD-TYPE | 19 | 46 | 15 | 7 |
Figure S25. Get High-res Image Gene #67: '17q loss' versus Molecular Subtype #1: 'CN_CNMF'

P value = 0.00016 (Fisher's exact test), Q value = 0.095
Table S26. Gene #74: '21q loss' versus Molecular Subtype #1: 'CN_CNMF'
| nPatients | CLUS_1 | CLUS_2 | CLUS_3 | CLUS_4 |
|---|---|---|---|---|
| ALL | 29 | 46 | 18 | 9 |
| 21Q LOSS MUTATED | 16 | 6 | 9 | 5 |
| 21Q LOSS WILD-TYPE | 13 | 40 | 9 | 4 |
Figure S26. Get High-res Image Gene #74: '21q loss' versus Molecular Subtype #1: 'CN_CNMF'
-
Copy number data file = transformed.cor.cli.txt
-
Molecular subtypes file = PAAD-TP.transferedmergedcluster.txt
-
Number of patients = 102
-
Number of significantly arm-level cnvs = 76
-
Number of molecular subtypes = 8
-
Exclude genes that fewer than K tumors have mutations, K = 3
For binary or multi-class clinical features (nominal or ordinal), two-tailed Fisher's exact tests (Fisher 1922) were used to estimate the P values using the 'fisher.test' function in R
For multiple hypothesis correction, Q value is the False Discovery Rate (FDR) analogue of the P value (Benjamini and Hochberg 1995), defined as the minimum FDR at which the test may be called significant. We used the 'Benjamini and Hochberg' method of 'p.adjust' function in R to convert P values into Q values.
In addition to the links below, the full results of the analysis summarized in this report can also be downloaded programmatically using firehose_get, or interactively from either the Broad GDAC website or TCGA Data Coordination Center Portal.