This report serves to describe the mutational landscape and properties of a given individual set, as well as rank genes and genesets according to mutational significance. MutSig 2CV v3.1 was used to generate the results found in this report.
-
Working with individual set: PAAD-TP
-
Number of patients in set: 41
The input for this pipeline is a set of individuals with the following files associated for each:
-
An annotated .maf file describing the mutations called for the respective individual, and their properties.
-
A .wig file that contains information about the coverage of the sample.
-
MAF used for this analysis:PAAD-TP.final_analysis_set.maf
-
Blacklist used for this analysis: pancan_mutation_blacklist.v14.hg19.txt
-
Significantly mutated genes (q ≤ 0.1): 141
The mutation spectrum is depicted in the lego plots below in which the 96 possible mutation types are subdivided into six large blocks, color-coded to reflect the base substitution type. Each large block is further subdivided into the 16 possible pairs of 5' and 3' neighbors, as listed in the 4x4 trinucleotide context legend. The height of each block corresponds to the mutation frequency for that kind of mutation (counts of mutations normalized by the base coverage in a given bin). The shape of the spectrum is a signature for dominant mutational mechanisms in different tumor types.
Figure 1. Get High-res Image SNV Mutation rate lego plot for entire set. Each bin is normalized by base coverage for that bin. Colors represent the six SNV types on the upper right. The three-base context for each mutation is labeled in the 4x4 legend on the lower right. The fractional breakdown of SNV counts is shown in the pie chart on the upper left. If this figure is blank, not enough information was provided in the MAF to generate it.
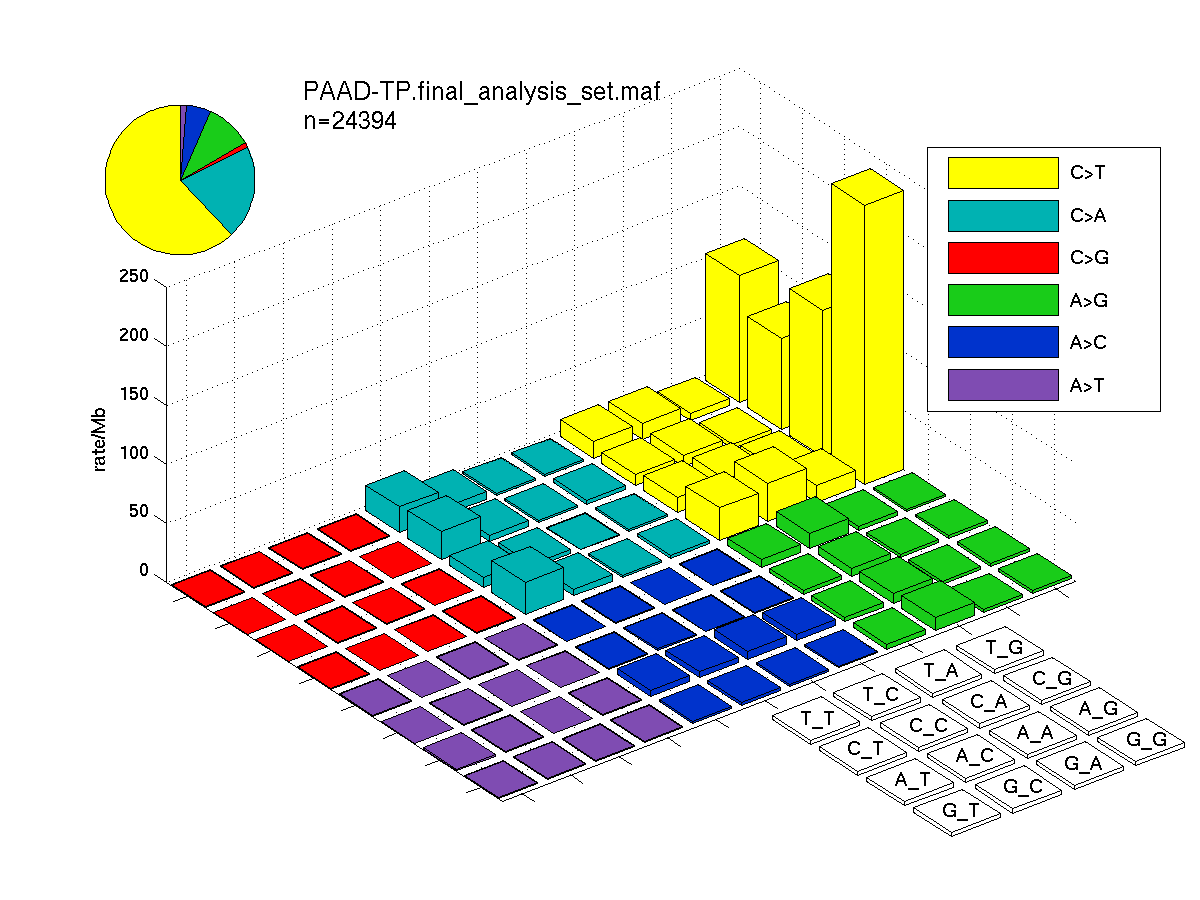
Figure 2. Get High-res Image SNV Mutation rate lego plots for 4 slices of mutation allele fraction (0<=AF<0.1, 0.1<=AF<0.25, 0.25<=AF<0.5, & 0.5<=AF) . The color code and three-base context legends are the same as the previous figure. If this figure is blank, not enough information was provided in the MAF to generate it.
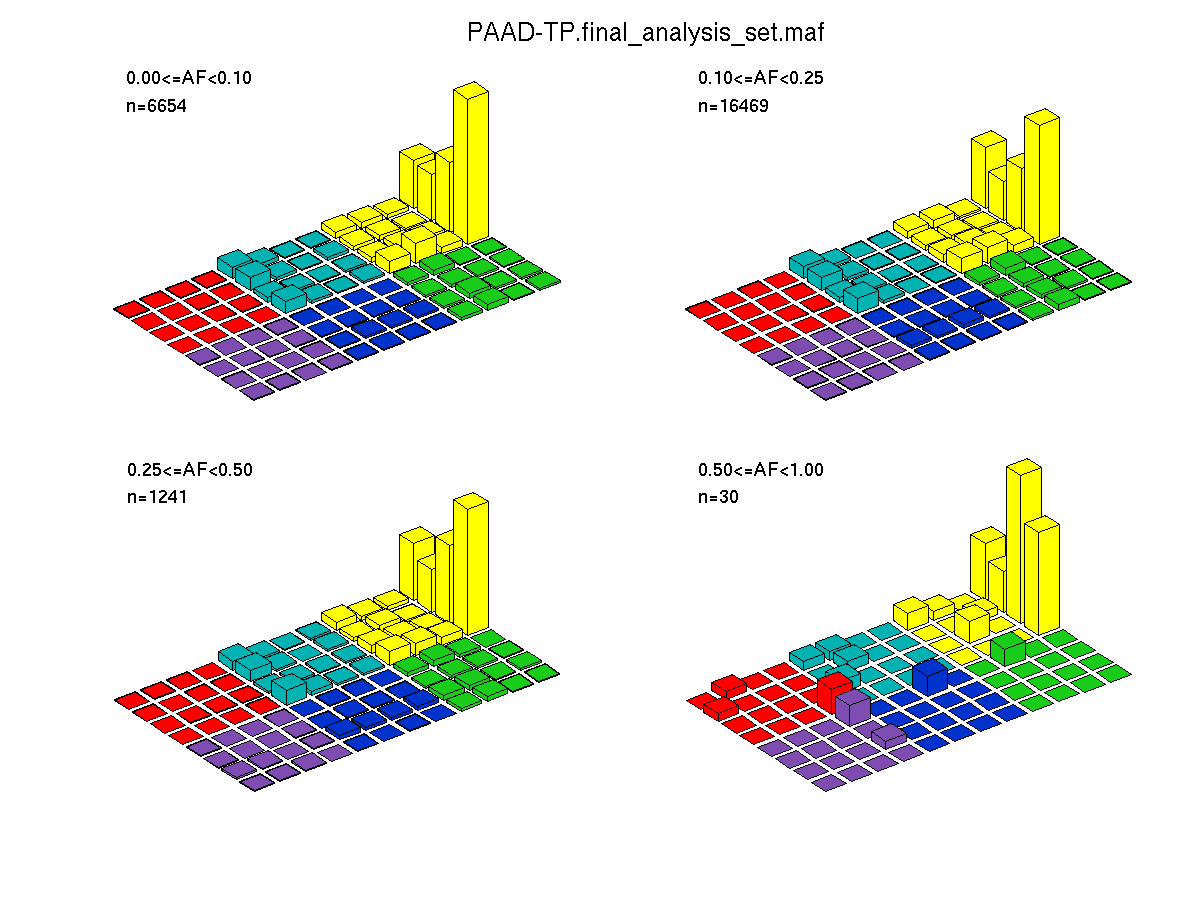
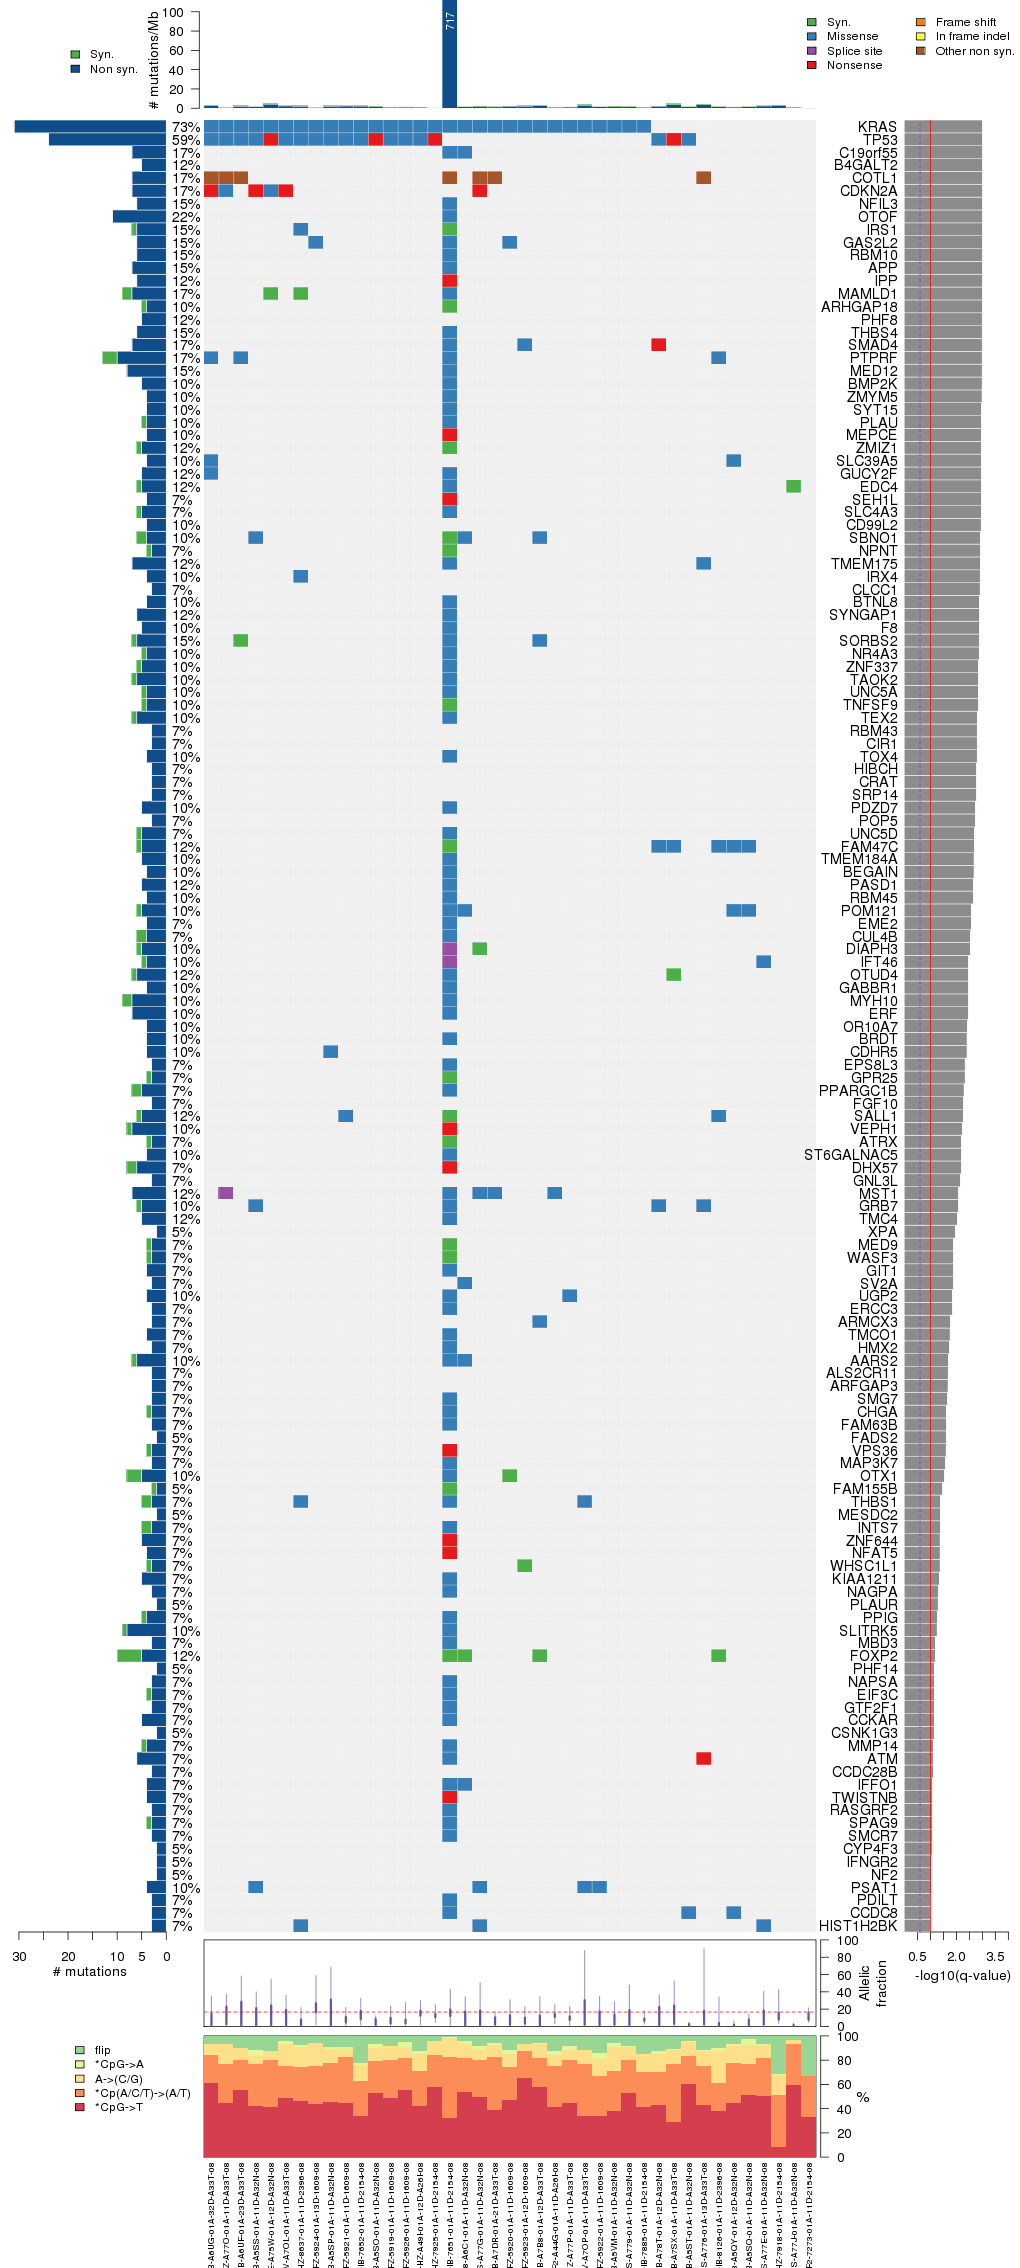
Figure 3. Get High-res Image The matrix in the center of the figure represents individual mutations in patient samples, color-coded by type of mutation, for the significantly mutated genes. The rate of synonymous and non-synonymous mutations is displayed at the top of the matrix. The barplot on the left of the matrix shows the number of mutations in each gene. The percentages represent the fraction of tumors with at least one mutation in the specified gene. The barplot to the right of the matrix displays the q-values for the most significantly mutated genes. The purple boxplots below the matrix (only displayed if required columns are present in the provided MAF) represent the distributions of allelic fractions observed in each sample. The plot at the bottom represents the base substitution distribution of individual samples, using the same categories that were used to calculate significance.
Column Descriptions:
-
nnon = number of (nonsilent) mutations in this gene across the individual set
-
npat = number of patients (individuals) with at least one nonsilent mutation
-
nsite = number of unique sites having a non-silent mutation
-
nsil = number of silent mutations in this gene across the individual set
-
p = p-value (overall)
-
q = q-value, False Discovery Rate (Benjamini-Hochberg procedure)
Table 1. Get Full Table A Ranked List of Significantly Mutated Genes. Number of significant genes found: 141. Number of genes displayed: 35. Click on a gene name to display its stick figure depicting the distribution of mutations and mutation types across the chosen gene (this feature may not be available for all significant genes).
| rank | gene | longname | codelen | nnei | nncd | nsil | nmis | nstp | nspl | nind | nnon | npat | nsite | pCV | pCL | pFN | p | q |
|---|---|---|---|---|---|---|---|---|---|---|---|---|---|---|---|---|---|---|
| 1 | KRAS | v-Ki-ras2 Kirsten rat sarcoma viral oncogene homolog | 709 | 281 | 0 | 0 | 31 | 0 | 0 | 0 | 31 | 30 | 4 | 6.9e-16 | 1e-05 | 0.00057 | 1e-16 | 9.1e-13 |
| 2 | TP53 | tumor protein p53 | 1889 | 105 | 0 | 0 | 15 | 4 | 0 | 5 | 24 | 24 | 21 | 1e-16 | 0.45 | 0.00044 | 1e-16 | 9.1e-13 |
| 3 | C19orf55 | chromosome 19 open reading frame 55 | 1321 | 90 | 0 | 0 | 2 | 0 | 0 | 5 | 7 | 7 | 3 | 3.2e-11 | 0.00024 | 0.94 | 4.1e-13 | 2.5e-09 |
| 4 | B4GALT2 | UDP-Gal:betaGlcNAc beta 1,4- galactosyltransferase, polypeptide 2 | 1561 | 3 | 0 | 0 | 0 | 0 | 0 | 5 | 5 | 5 | 1 | 9.4e-09 | 1e-05 | 1 | 2.9e-12 | 1.3e-08 |
| 5 | COTL1 | coactosin-like 1 (Dictyostelium) | 441 | 212 | 0 | 0 | 0 | 7 | 0 | 0 | 7 | 7 | 1 | 1.4e-12 | 0.072 | 1 | 7.6e-12 | 2.8e-08 |
| 6 | CDKN2A | cyclin-dependent kinase inhibitor 2A (melanoma, p16, inhibits CDK4) | 1002 | 832 | 0 | 0 | 2 | 4 | 0 | 1 | 7 | 7 | 4 | 3.9e-08 | 0.00022 | 1e-05 | 1.2e-11 | 3.5e-08 |
| 7 | NFIL3 | nuclear factor, interleukin 3 regulated | 1389 | 642 | 0 | 0 | 1 | 0 | 0 | 5 | 6 | 6 | 2 | 2.5e-07 | 1e-05 | 0.99 | 6.8e-11 | 1.8e-07 |
| 8 | OTOF | otoferlin | 6503 | 7 | 0 | 0 | 3 | 0 | 0 | 8 | 11 | 9 | 4 | 3.5e-07 | 1e-05 | 0.98 | 9.7e-11 | 2.2e-07 |
| 9 | IRS1 | insulin receptor substrate 1 | 3735 | 20 | 0 | 1 | 1 | 0 | 0 | 5 | 6 | 6 | 2 | 5.5e-07 | 1e-05 | 0.94 | 1.5e-10 | 3e-07 |
| 10 | GAS2L2 | growth arrest-specific 2 like 2 | 2665 | 43 | 0 | 0 | 3 | 0 | 0 | 3 | 6 | 6 | 3 | 7.1e-07 | 1e-05 | 0.47 | 1.9e-10 | 3.4e-07 |
| 11 | RBM10 | RNA binding motif protein 10 | 2882 | 19 | 0 | 0 | 1 | 0 | 0 | 5 | 6 | 6 | 2 | 2.8e-06 | 1e-05 | 0.48 | 7.1e-10 | 1.2e-06 |
| 12 | APP | amyloid beta (A4) precursor protein (peptidase nexin-II, Alzheimer disease) | 2381 | 33 | 0 | 0 | 2 | 0 | 0 | 5 | 7 | 6 | 3 | 4.1e-06 | 1e-05 | 0.85 | 1e-09 | 1.6e-06 |
| 13 | IPP | intracisternal A particle-promoted polypeptide | 1889 | 7 | 0 | 0 | 0 | 1 | 0 | 5 | 6 | 5 | 2 | 0.000011 | 1e-05 | 0.96 | 2.6e-09 | 3.7e-06 |
| 14 | MAMLD1 | mastermind-like domain containing 1 | 3467 | 8 | 0 | 2 | 1 | 0 | 0 | 6 | 7 | 7 | 3 | 0.000025 | 1e-05 | 0.28 | 5.7e-09 | 7e-06 |
| 15 | ARHGAP18 | Rho GTPase activating protein 18 | 2050 | 35 | 0 | 1 | 0 | 0 | 0 | 4 | 4 | 4 | 1 | 2.5e-06 | 0.0001 | 0.088 | 5.7e-09 | 7e-06 |
| 16 | PHF8 | PHD finger protein 8 | 3433 | 40 | 0 | 0 | 0 | 0 | 0 | 5 | 5 | 5 | 1 | 0.000034 | 1e-05 | 1 | 7.7e-09 | 8.8e-06 |
| 17 | THBS4 | thrombospondin 4 | 2970 | 17 | 0 | 0 | 1 | 0 | 0 | 5 | 6 | 6 | 2 | 0.000043 | 1e-05 | 1 | 9.8e-09 | 0.000011 |
| 18 | SMAD4 | SMAD family member 4 | 1699 | 111 | 0 | 0 | 2 | 1 | 0 | 4 | 7 | 7 | 7 | 4.3e-09 | 1 | 0.069 | 1.2e-08 | 0.000013 |
| 19 | PTPRF | protein tyrosine phosphatase, receptor type, F | 5852 | 70 | 0 | 3 | 5 | 0 | 0 | 5 | 10 | 7 | 6 | 2e-05 | 2e-05 | 0.98 | 1.8e-08 | 0.000017 |
| 20 | MED12 | mediator complex subunit 12 | 6710 | 8 | 0 | 0 | 2 | 0 | 0 | 6 | 8 | 6 | 4 | 0.000083 | 1e-05 | 0.99 | 1.8e-08 | 0.000017 |
| 21 | BMP2K | BMP2 inducible kinase | 3582 | 3 | 0 | 0 | 1 | 0 | 0 | 4 | 5 | 4 | 2 | 0.000024 | 2e-05 | 0.96 | 2.6e-08 | 0.000023 |
| 22 | ZMYM5 | zinc finger, MYM-type 5 | 2145 | 13 | 0 | 0 | 1 | 0 | 0 | 3 | 4 | 4 | 2 | 0.000011 | 0.0001 | 0.56 | 3.5e-08 | 0.000029 |
| 23 | SYT15 | synaptotagmin XV | 1350 | 77 | 0 | 0 | 1 | 0 | 0 | 3 | 4 | 4 | 2 | 0.000017 | 0.0001 | 0.96 | 4.7e-08 | 0.000037 |
| 24 | PLAU | plasminogen activator, urokinase | 1661 | 61 | 0 | 1 | 1 | 0 | 0 | 3 | 4 | 4 | 2 | 0.000022 | 0.0001 | 0.67 | 5.5e-08 | 0.000042 |
| 25 | MEPCE | methylphosphate capping enzyme | 2082 | 20 | 0 | 0 | 0 | 1 | 0 | 3 | 4 | 4 | 2 | 0.000028 | 0.0001 | 1 | 5.8e-08 | 0.000043 |
| 26 | ZMIZ1 | zinc finger, MIZ-type containing 1 | 3288 | 102 | 0 | 1 | 0 | 0 | 0 | 5 | 5 | 5 | 3 | 0.000049 | 5e-05 | 0.84 | 7e-08 | 0.000049 |
| 27 | SLC39A5 | solute carrier family 39 (metal ion transporter), member 5 | 1856 | 46 | 0 | 0 | 2 | 0 | 0 | 2 | 4 | 4 | 2 | 0.000039 | 0.0001 | 0.56 | 8e-08 | 0.000054 |
| 28 | GUCY2F | guanylate cyclase 2F, retinal | 3402 | 5 | 0 | 0 | 2 | 0 | 0 | 3 | 5 | 5 | 3 | 0.00047 | 1e-05 | 0.82 | 9.4e-08 | 0.000062 |
| 29 | EDC4 | enhancer of mRNA decapping 4 | 4328 | 1 | 0 | 1 | 1 | 0 | 0 | 4 | 5 | 5 | 3 | 0.00028 | 1e-05 | 0.89 | 1.1e-07 | 7e-05 |
| 30 | SEH1L | SEH1-like (S. cerevisiae) | 1313 | 132 | 0 | 0 | 0 | 1 | 0 | 3 | 4 | 3 | 2 | 0.000067 | 0.0001 | 0.89 | 1.3e-07 | 0.000081 |
| 31 | SLC4A3 | solute carrier family 4, anion exchanger, member 3 | 3872 | 24 | 0 | 1 | 2 | 0 | 0 | 3 | 5 | 3 | 3 | 0.00013 | 5e-05 | 0.76 | 1.5e-07 | 0.000088 |
| 32 | CD99L2 | CD99 molecule-like 2 | 829 | 362 | 0 | 0 | 0 | 0 | 0 | 4 | 4 | 4 | 2 | 4e-05 | 0.00024 | 0.53 | 1.9e-07 | 0.00011 |
| 33 | SBNO1 | strawberry notch homolog 1 (Drosophila) | 4302 | 60 | 0 | 2 | 3 | 0 | 0 | 1 | 4 | 4 | 2 | 0.000026 | 0.0005 | 0.32 | 2.5e-07 | 0.00014 |
| 34 | NPNT | nephronectin | 1891 | 27 | 0 | 1 | 0 | 0 | 0 | 3 | 3 | 3 | 1 | 0.000017 | 0.001 | 0.86 | 3.2e-07 | 0.00017 |
| 35 | TMEM175 | transmembrane protein 175 | 1555 | 138 | 0 | 0 | 4 | 0 | 0 | 3 | 7 | 5 | 5 | 8.7e-06 | 0.0017 | 0.31 | 3.4e-07 | 0.00018 |
Figure S1. This figure depicts the distribution of mutations and mutation types across the KRAS significant gene.
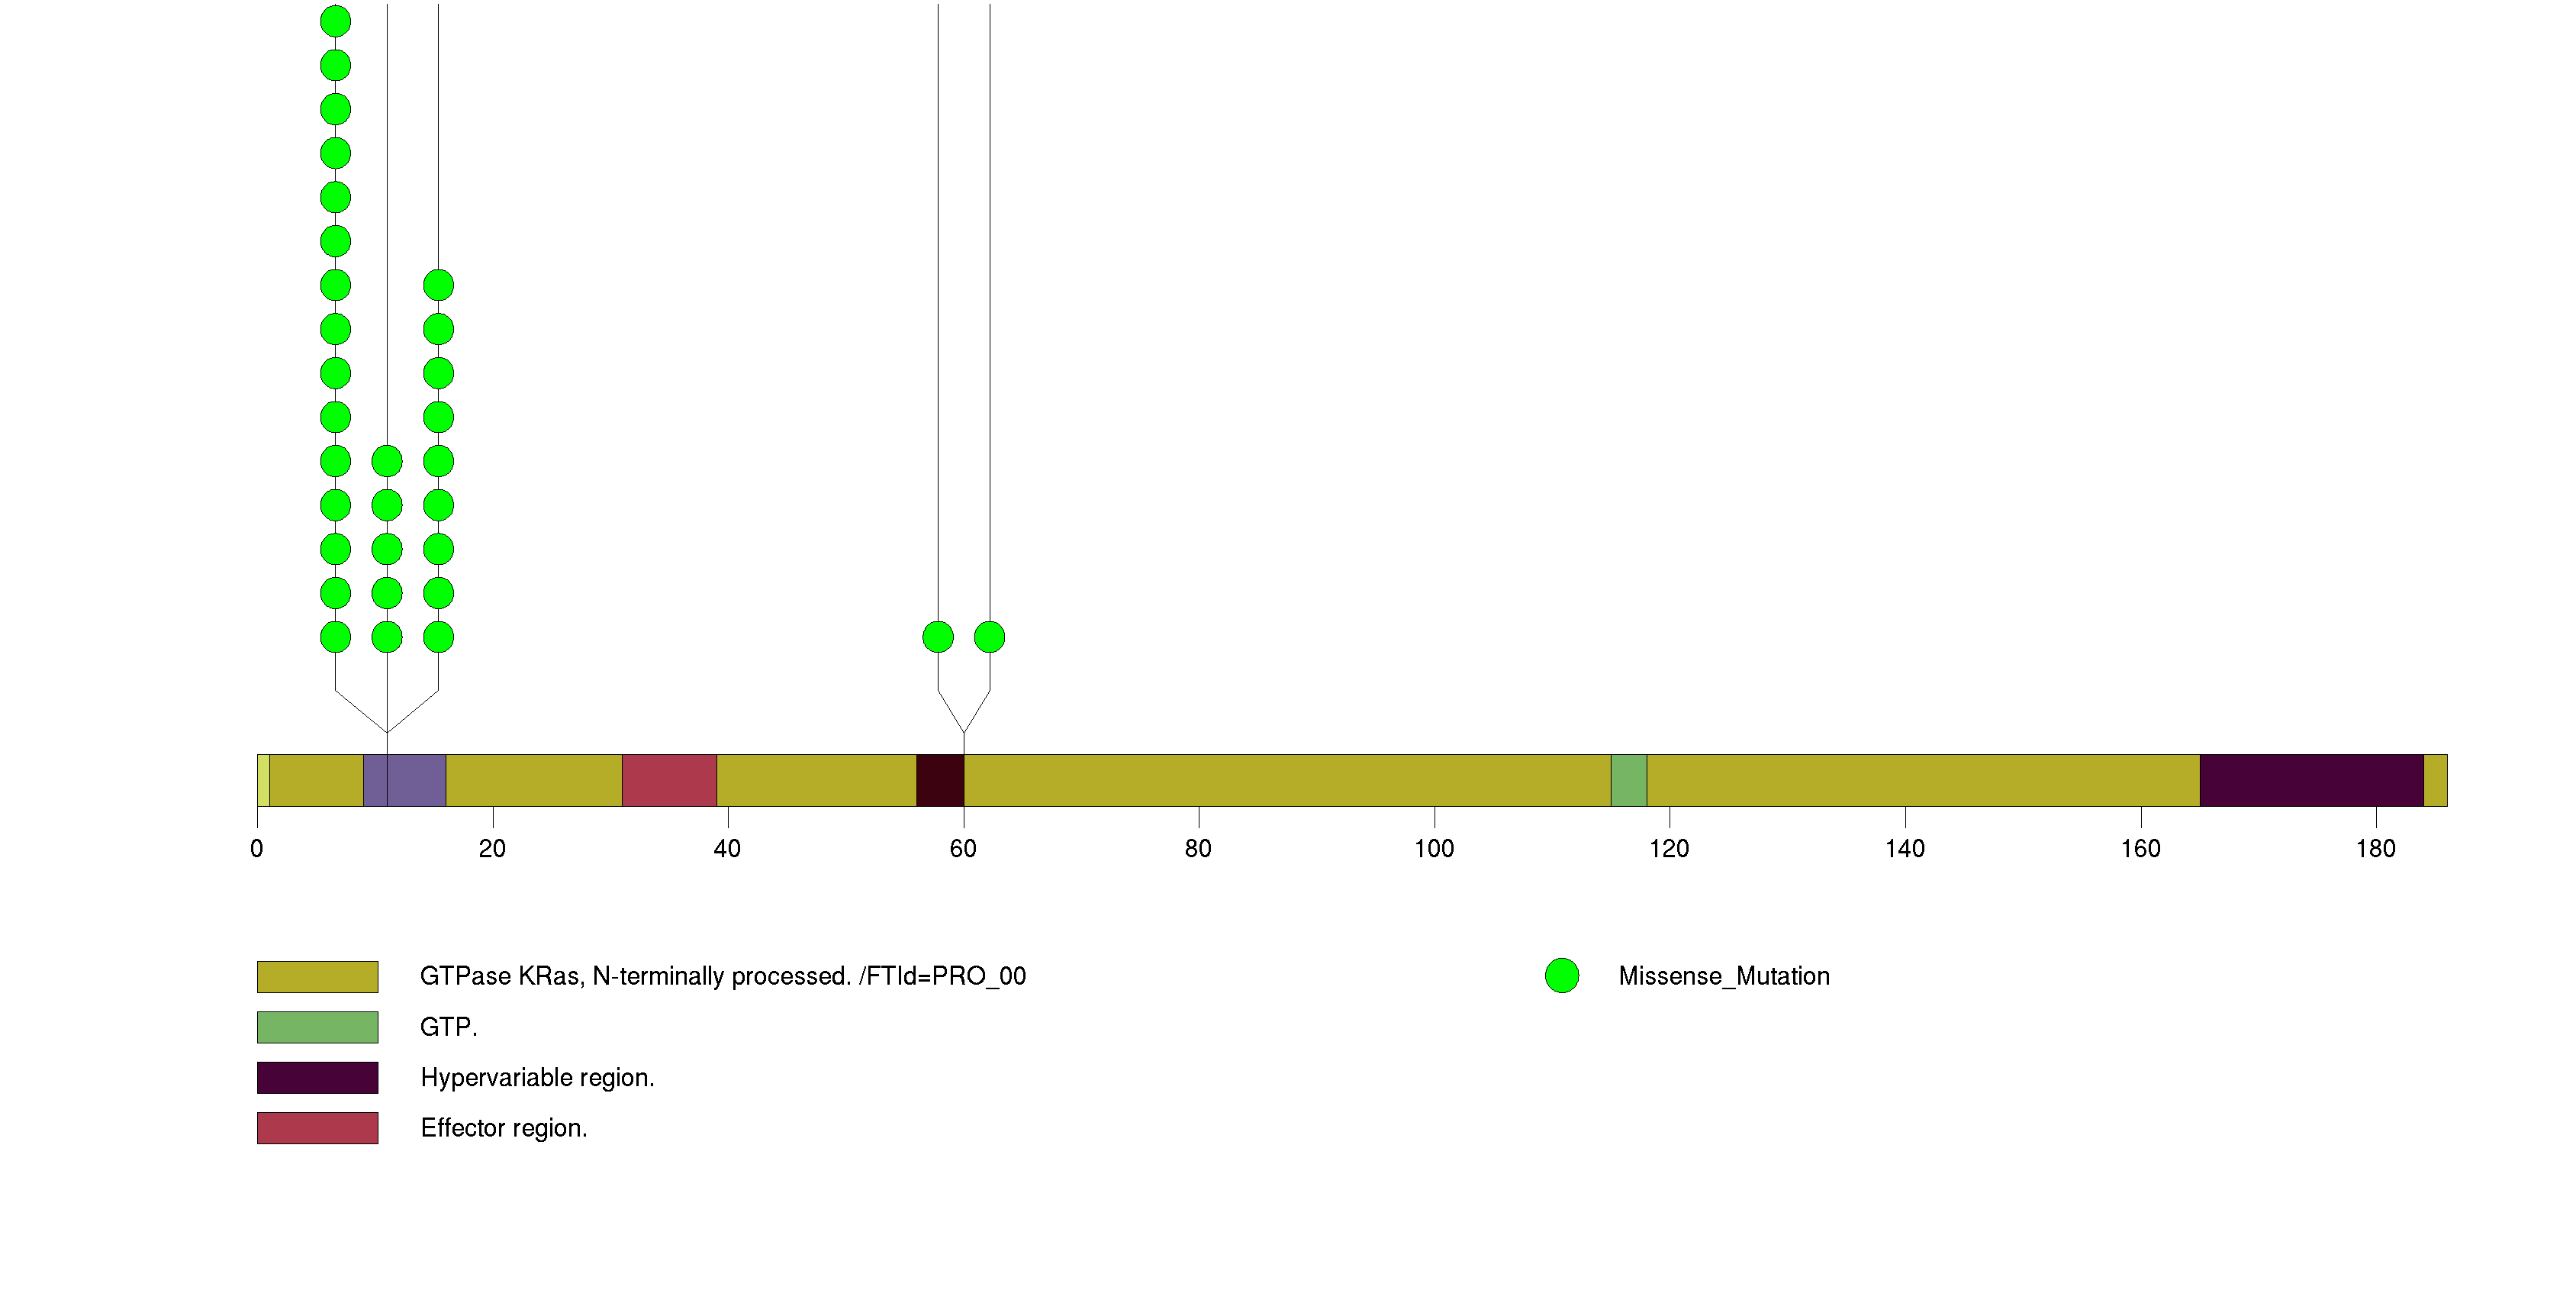
Figure S2. This figure depicts the distribution of mutations and mutation types across the TP53 significant gene.
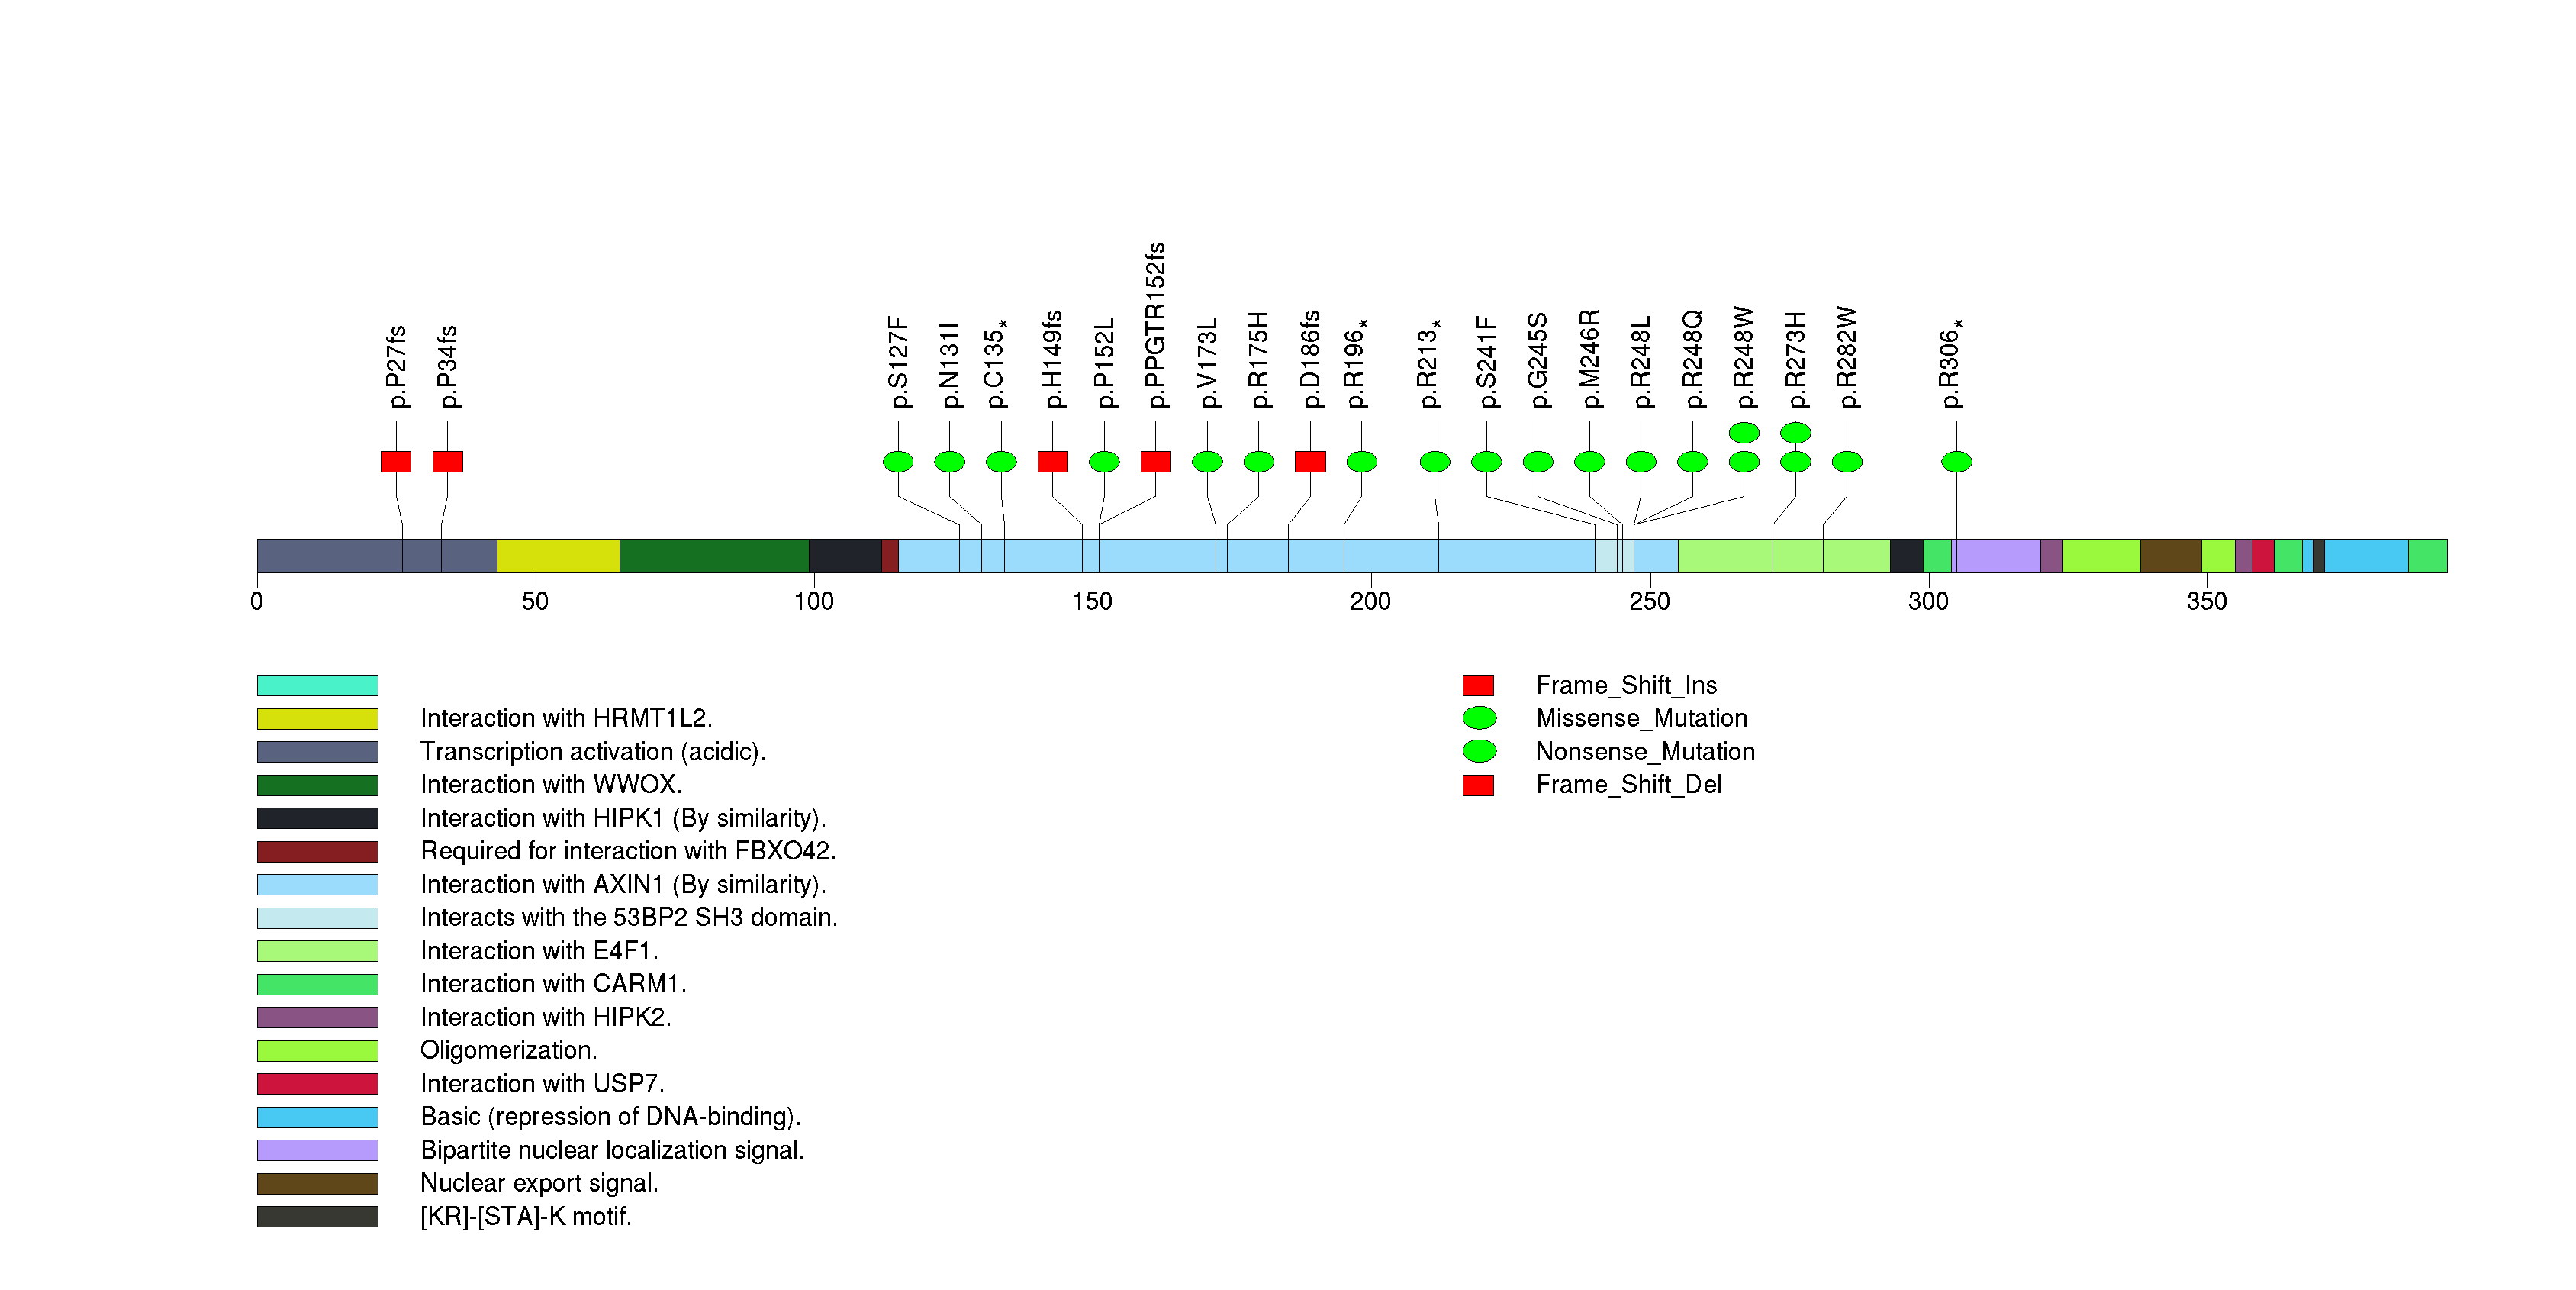
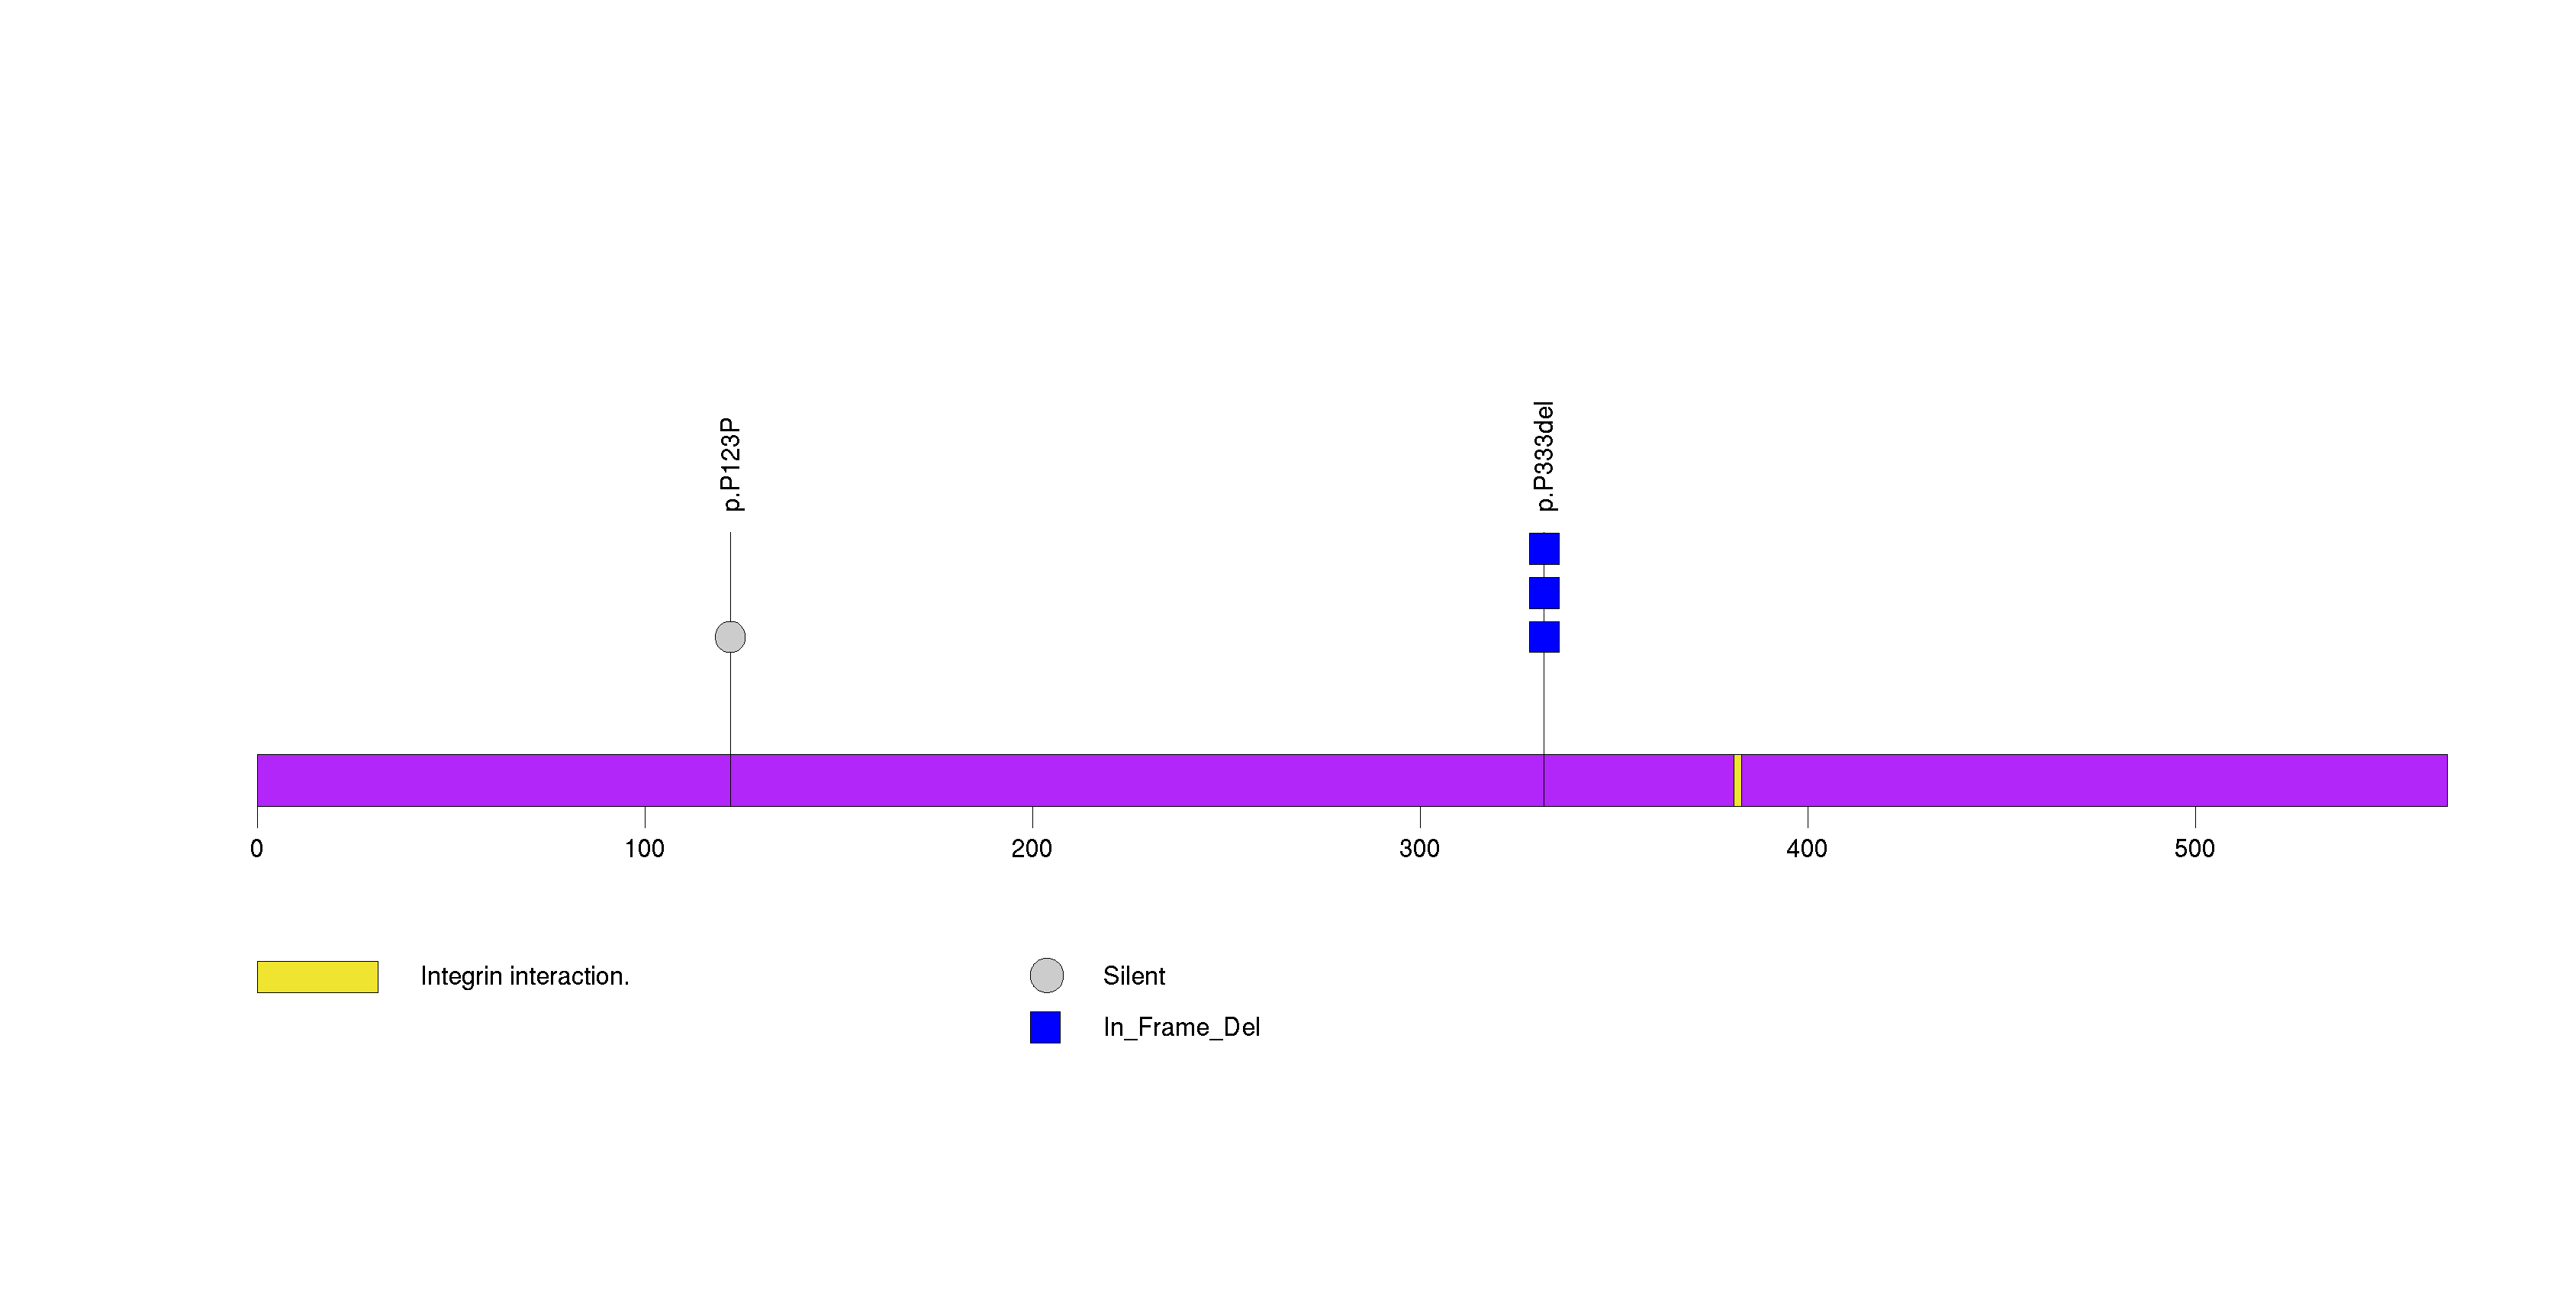
Figure S3. This figure depicts the distribution of mutations and mutation types across the C19orf55 significant gene.
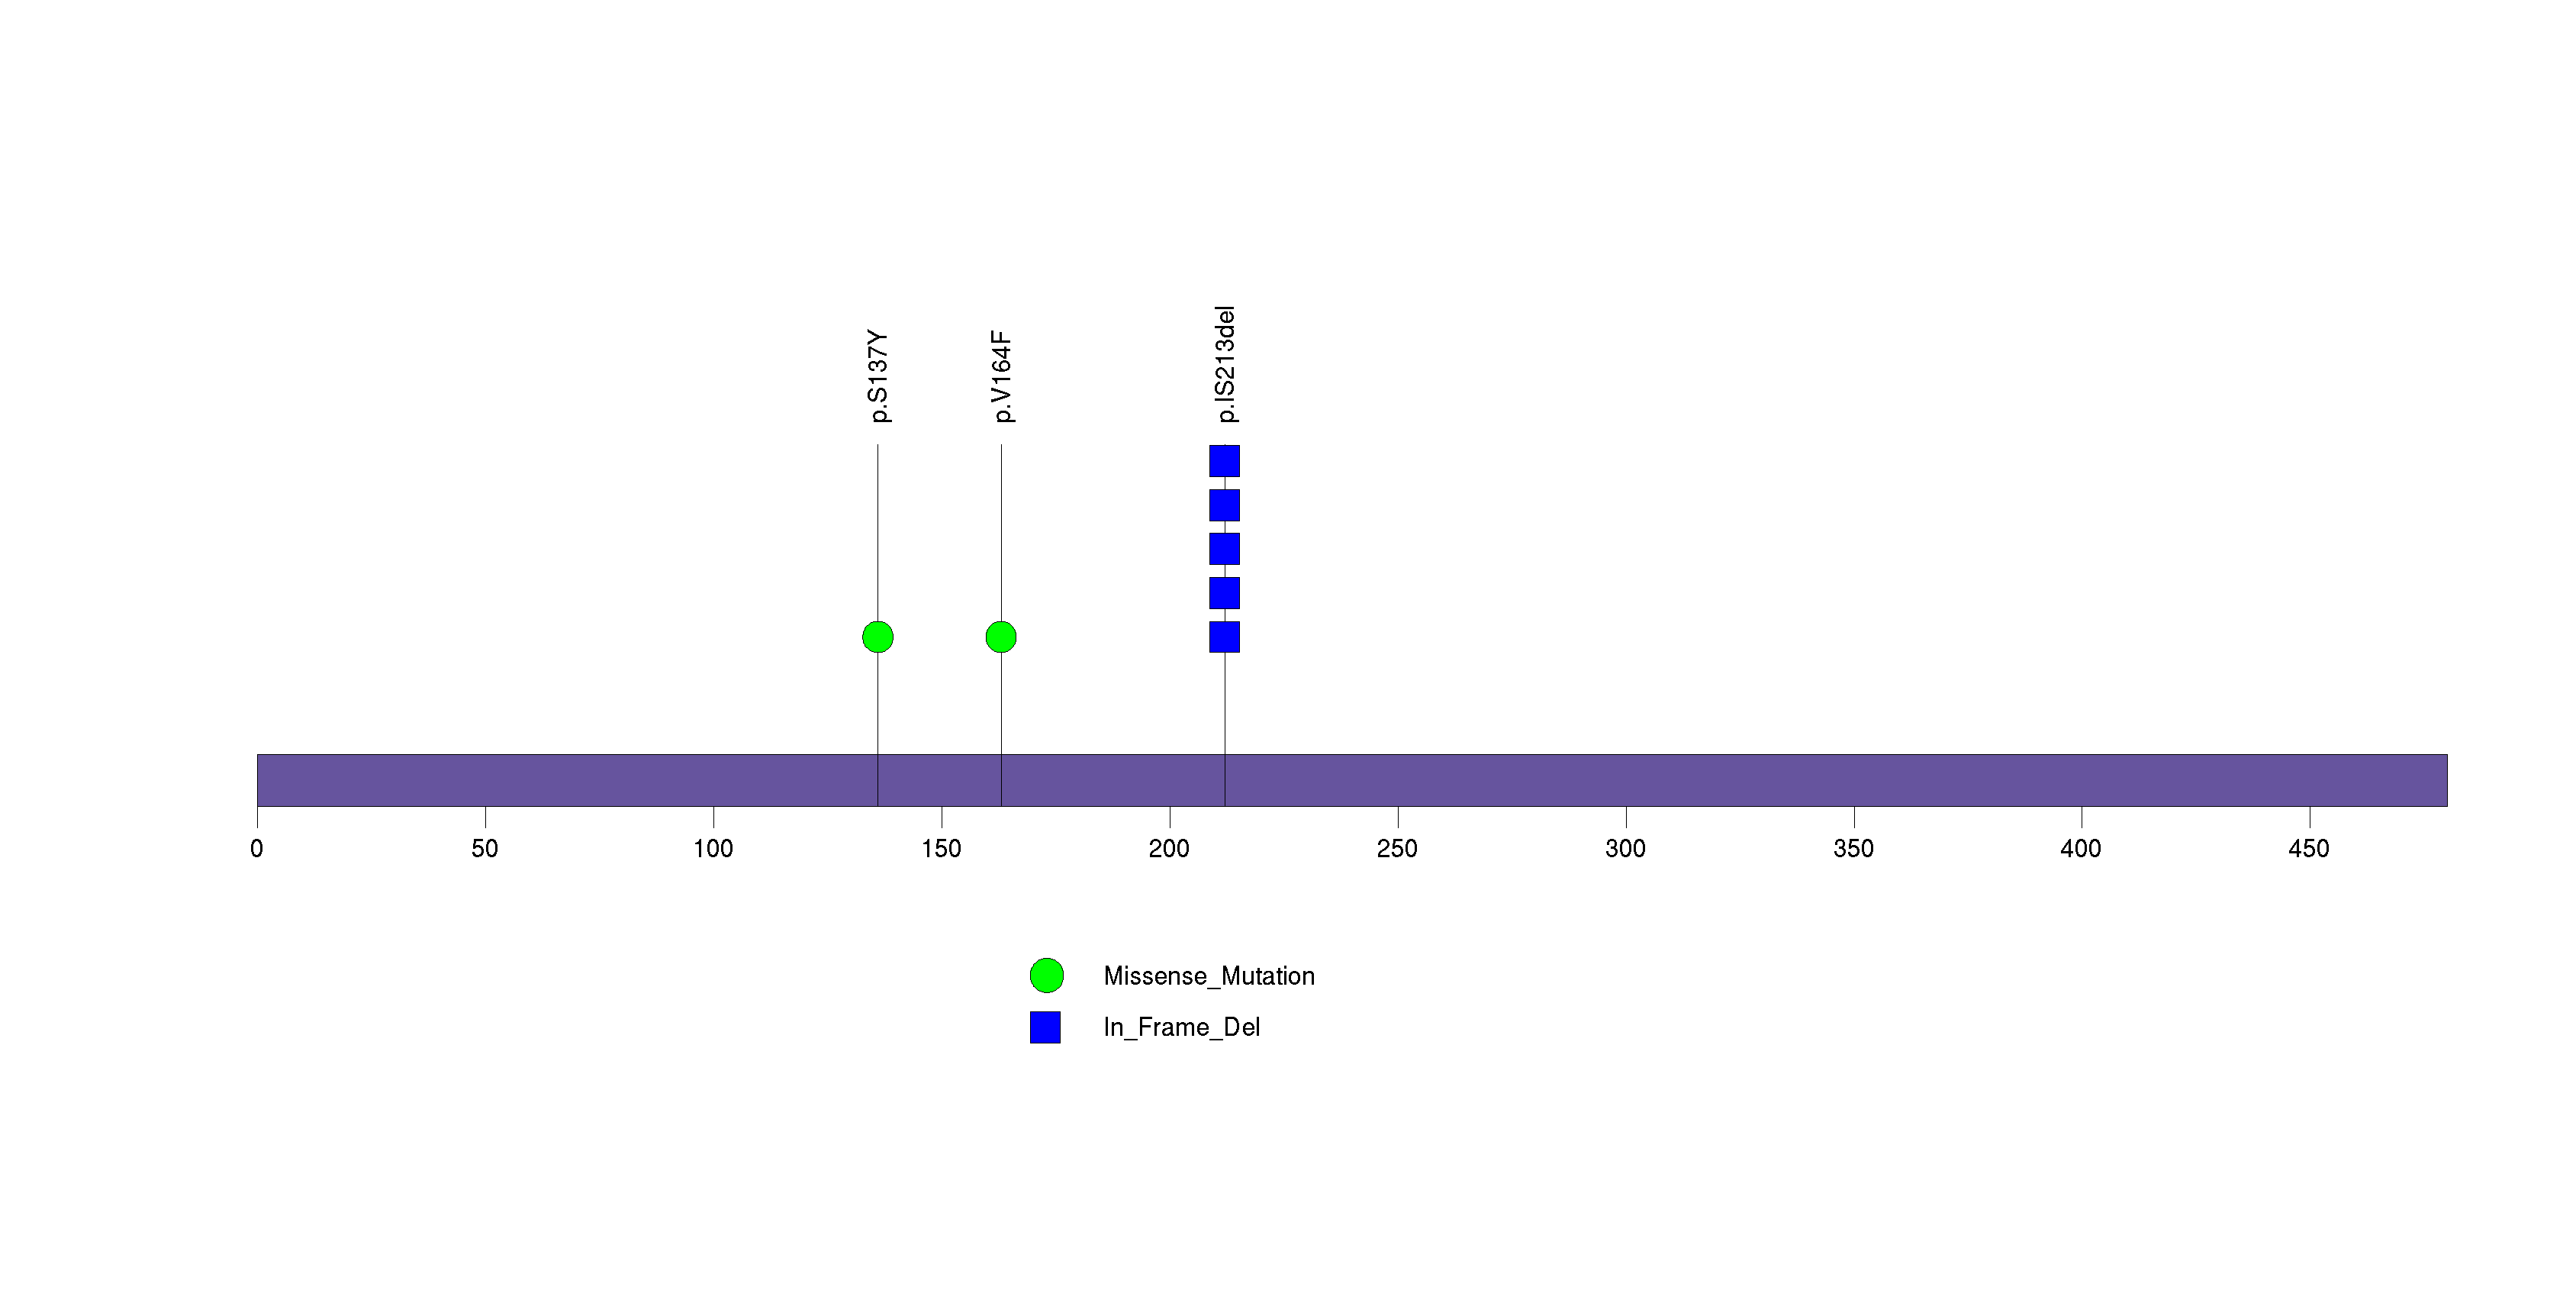
Figure S4. This figure depicts the distribution of mutations and mutation types across the B4GALT2 significant gene.
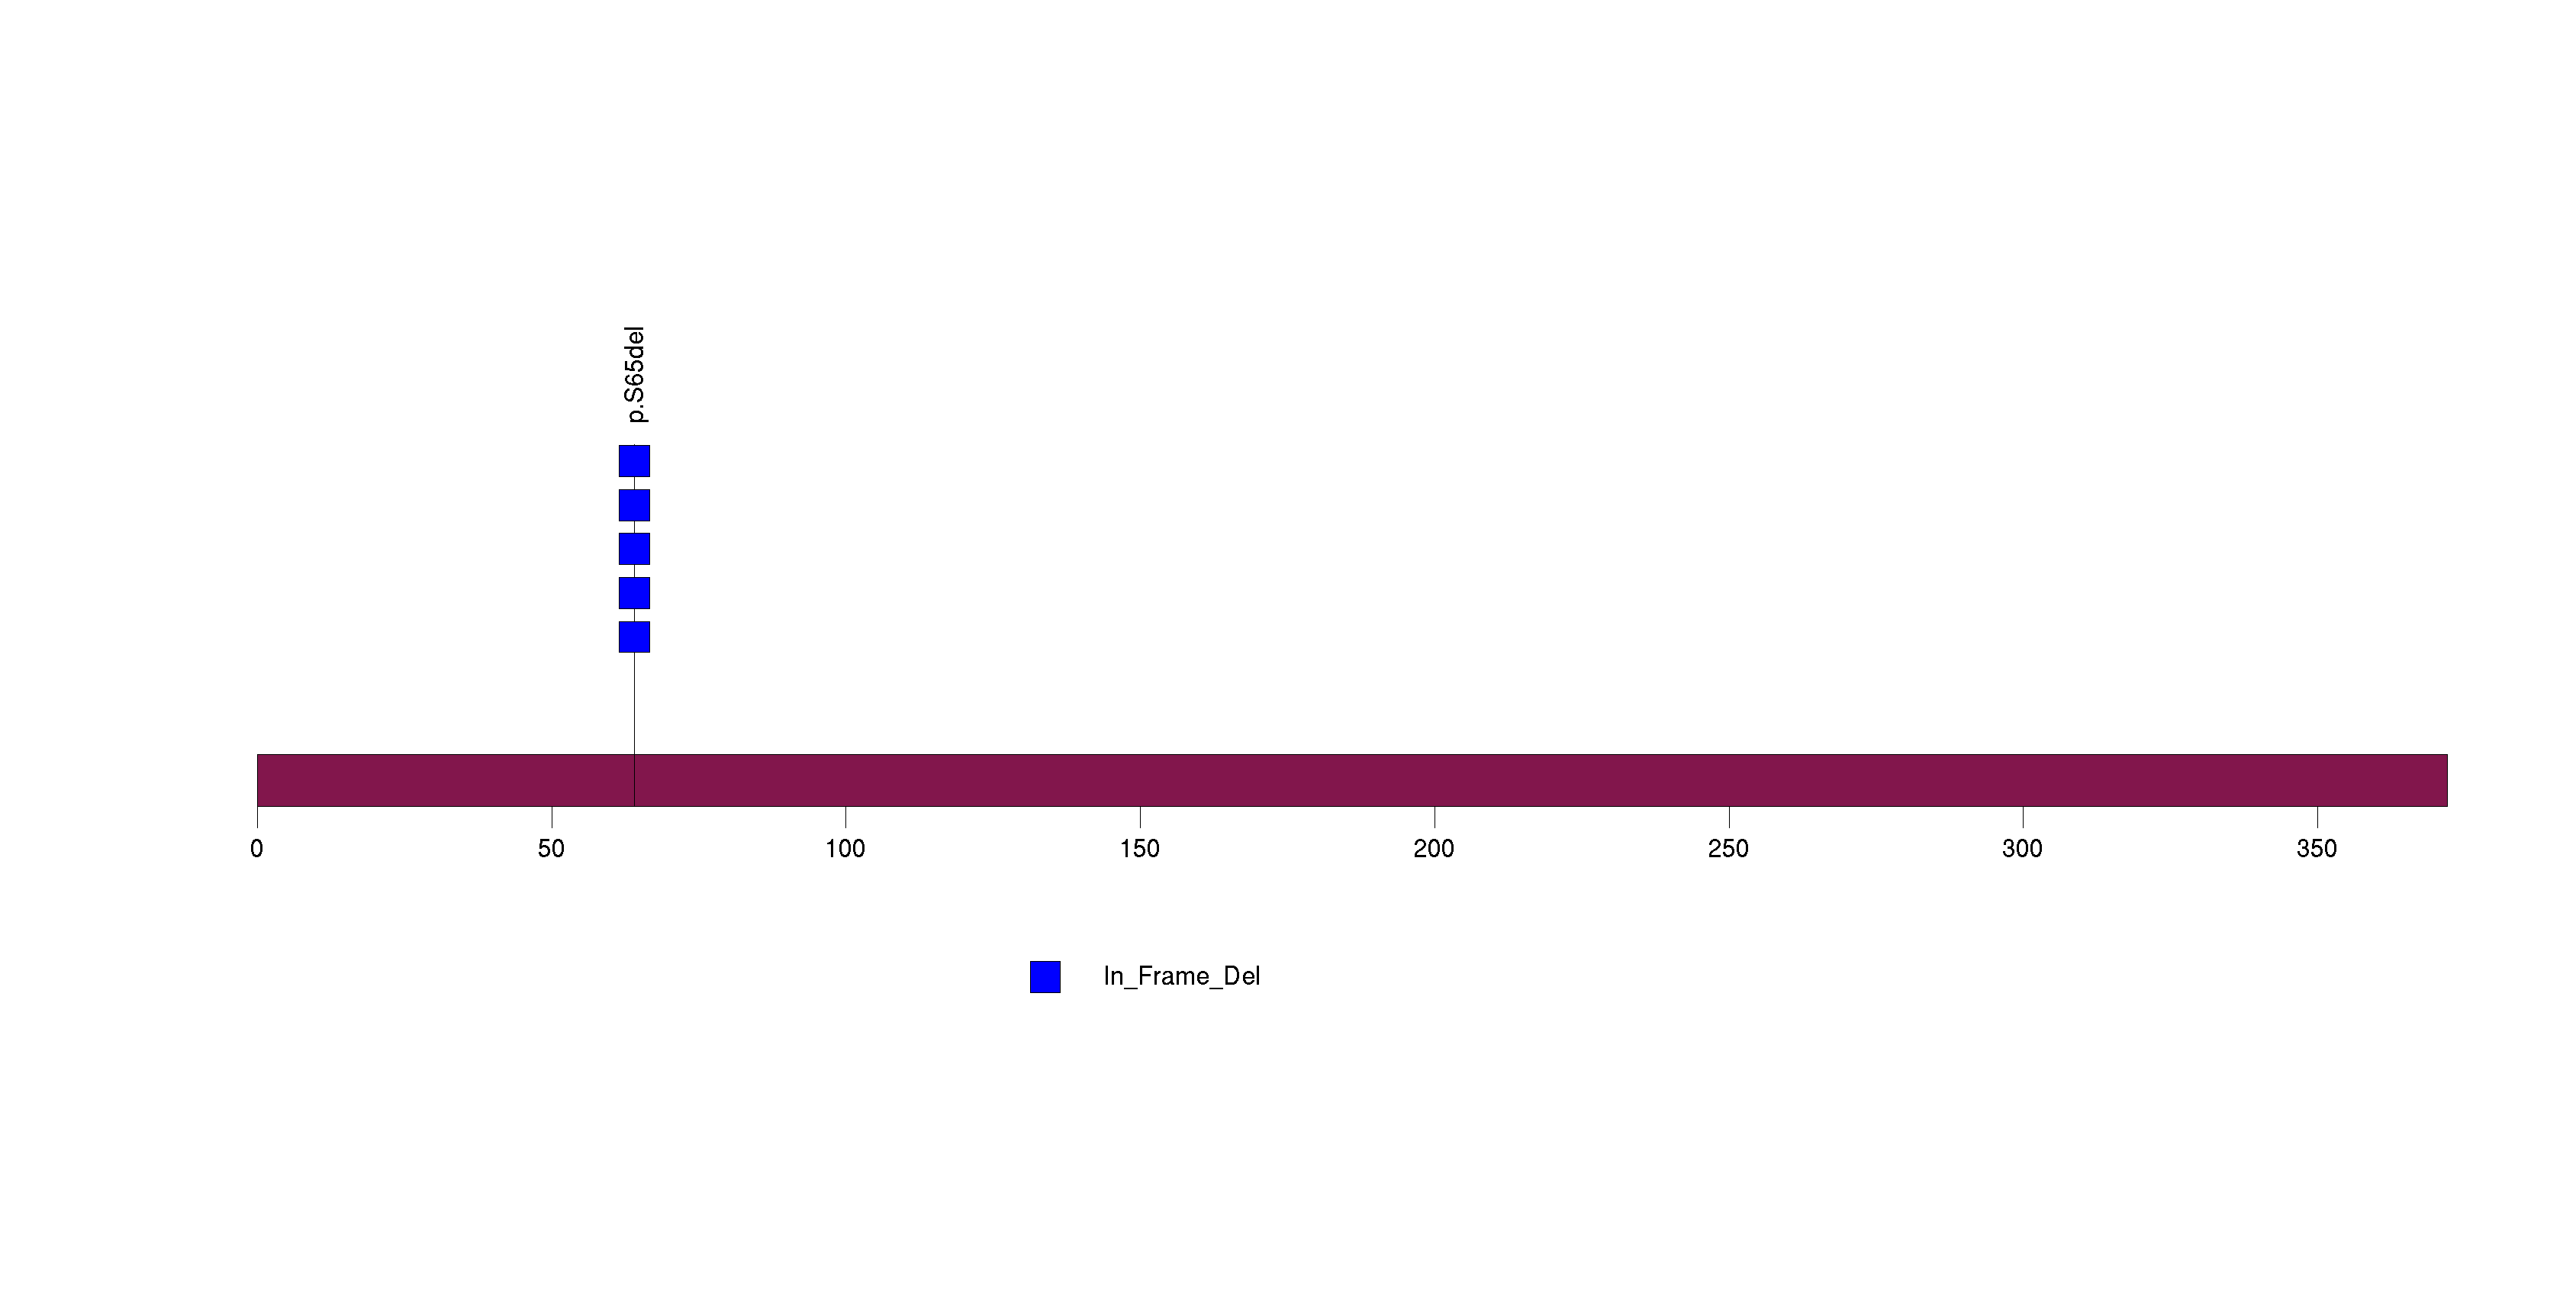
Figure S5. This figure depicts the distribution of mutations and mutation types across the COTL1 significant gene.
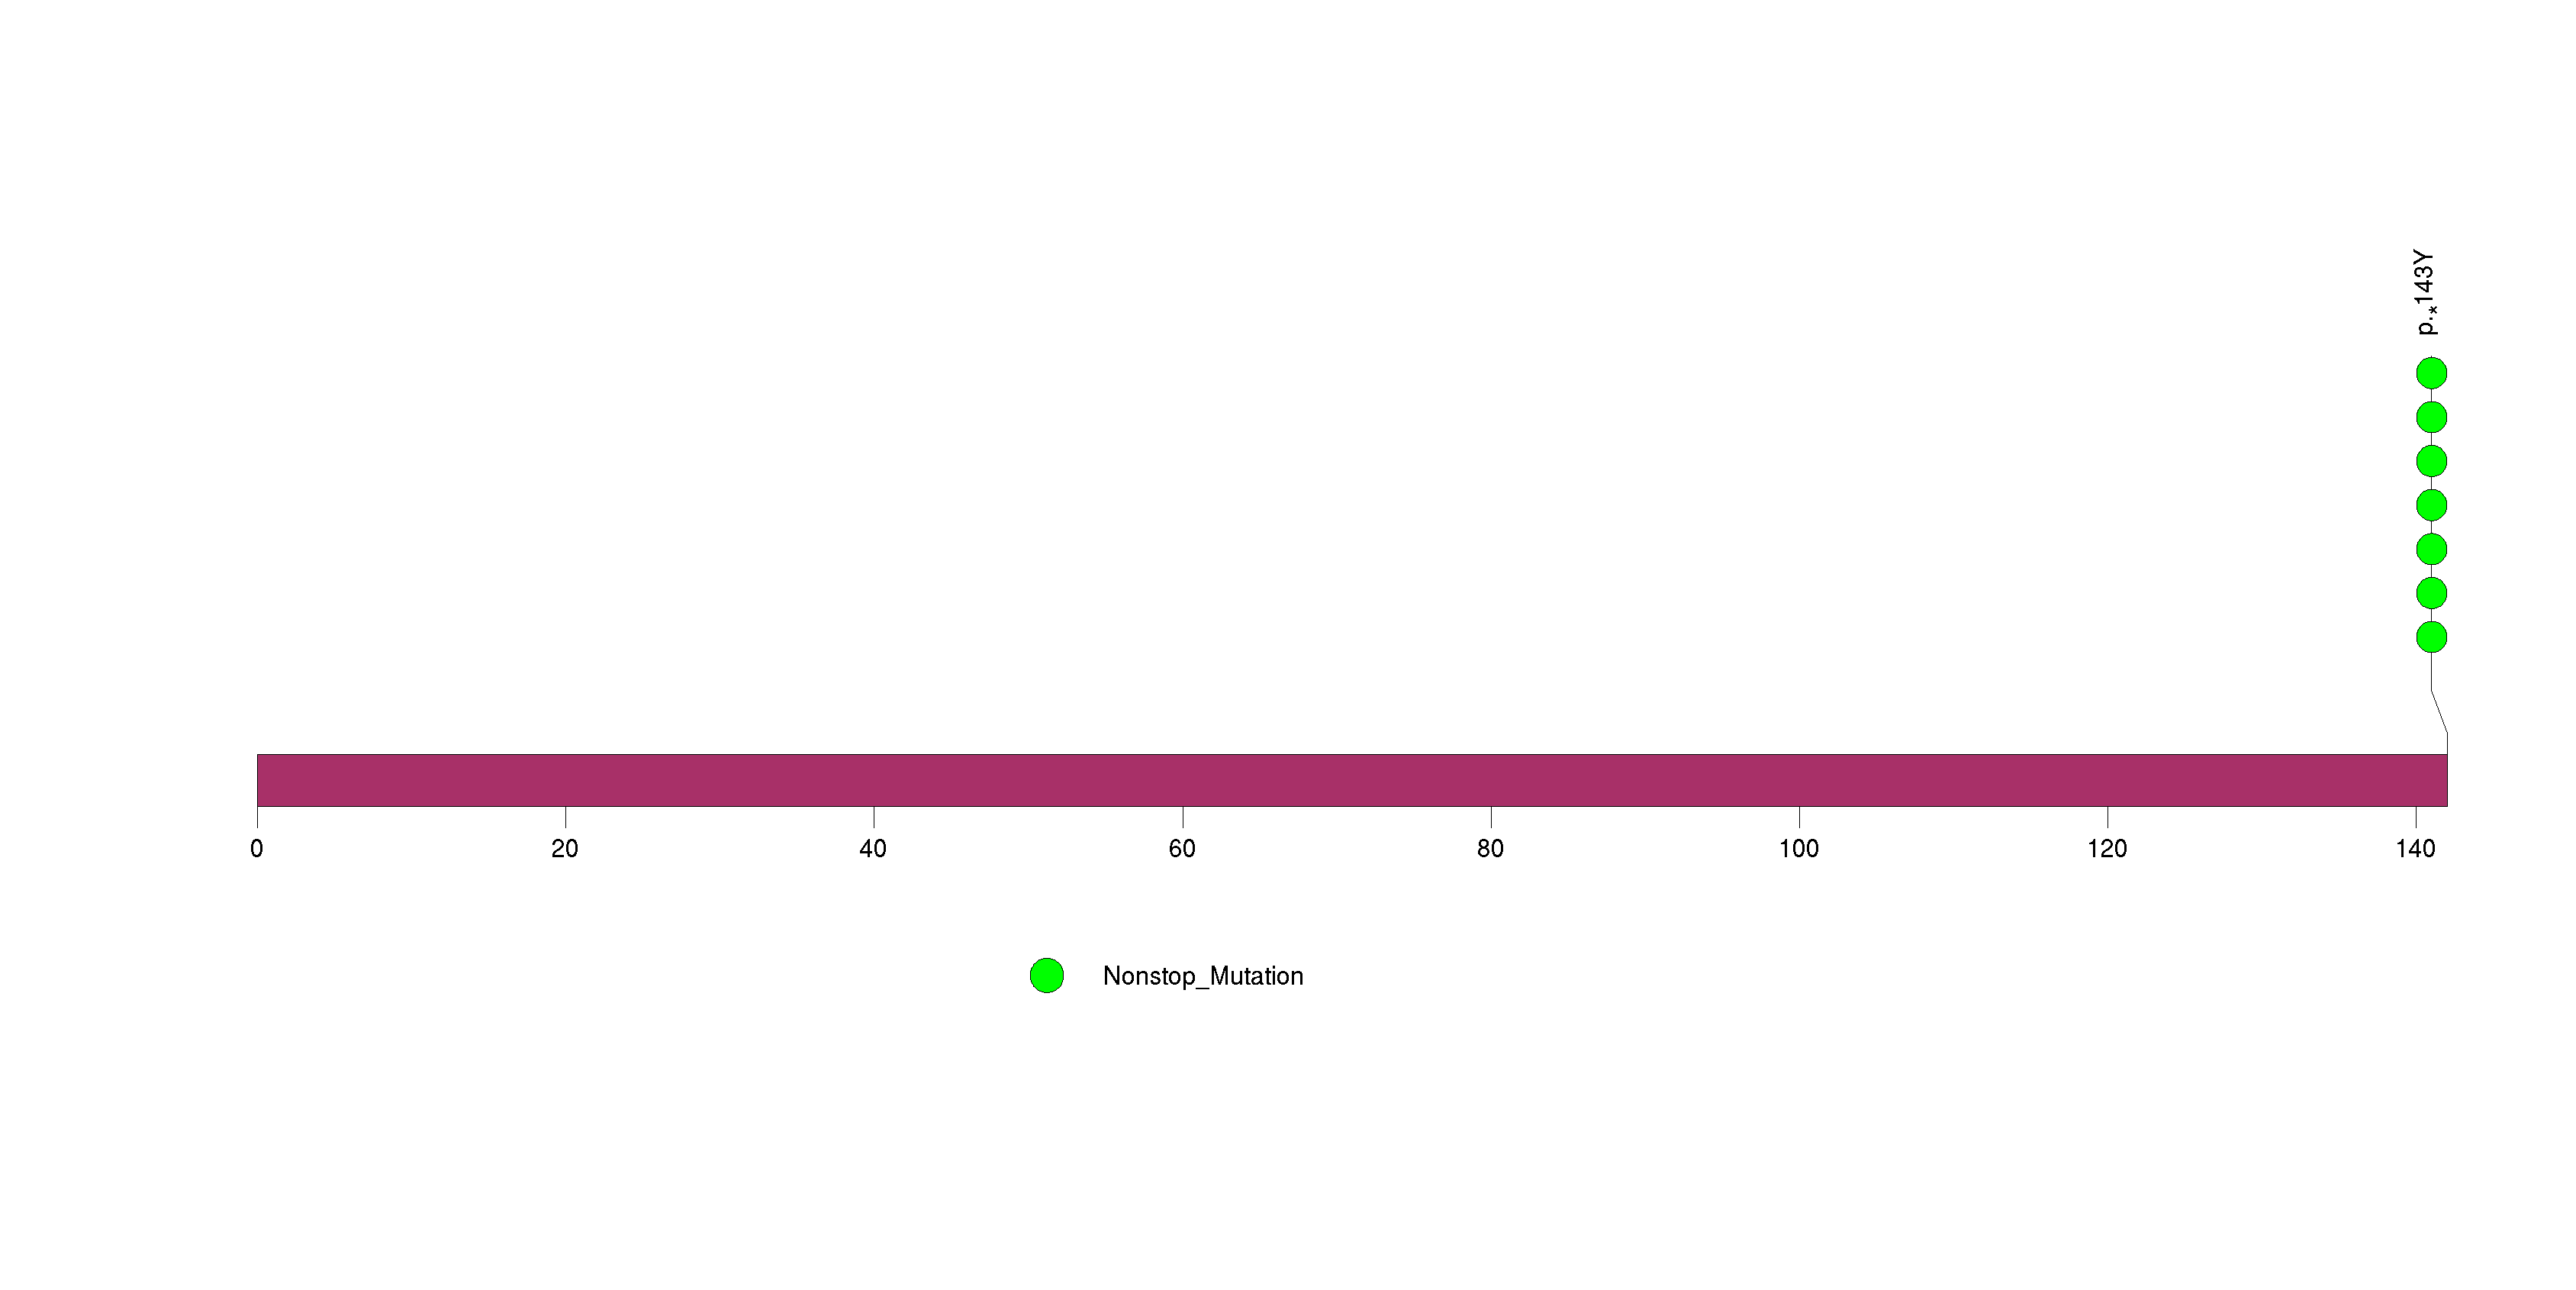
Figure S6. This figure depicts the distribution of mutations and mutation types across the CDKN2A significant gene.
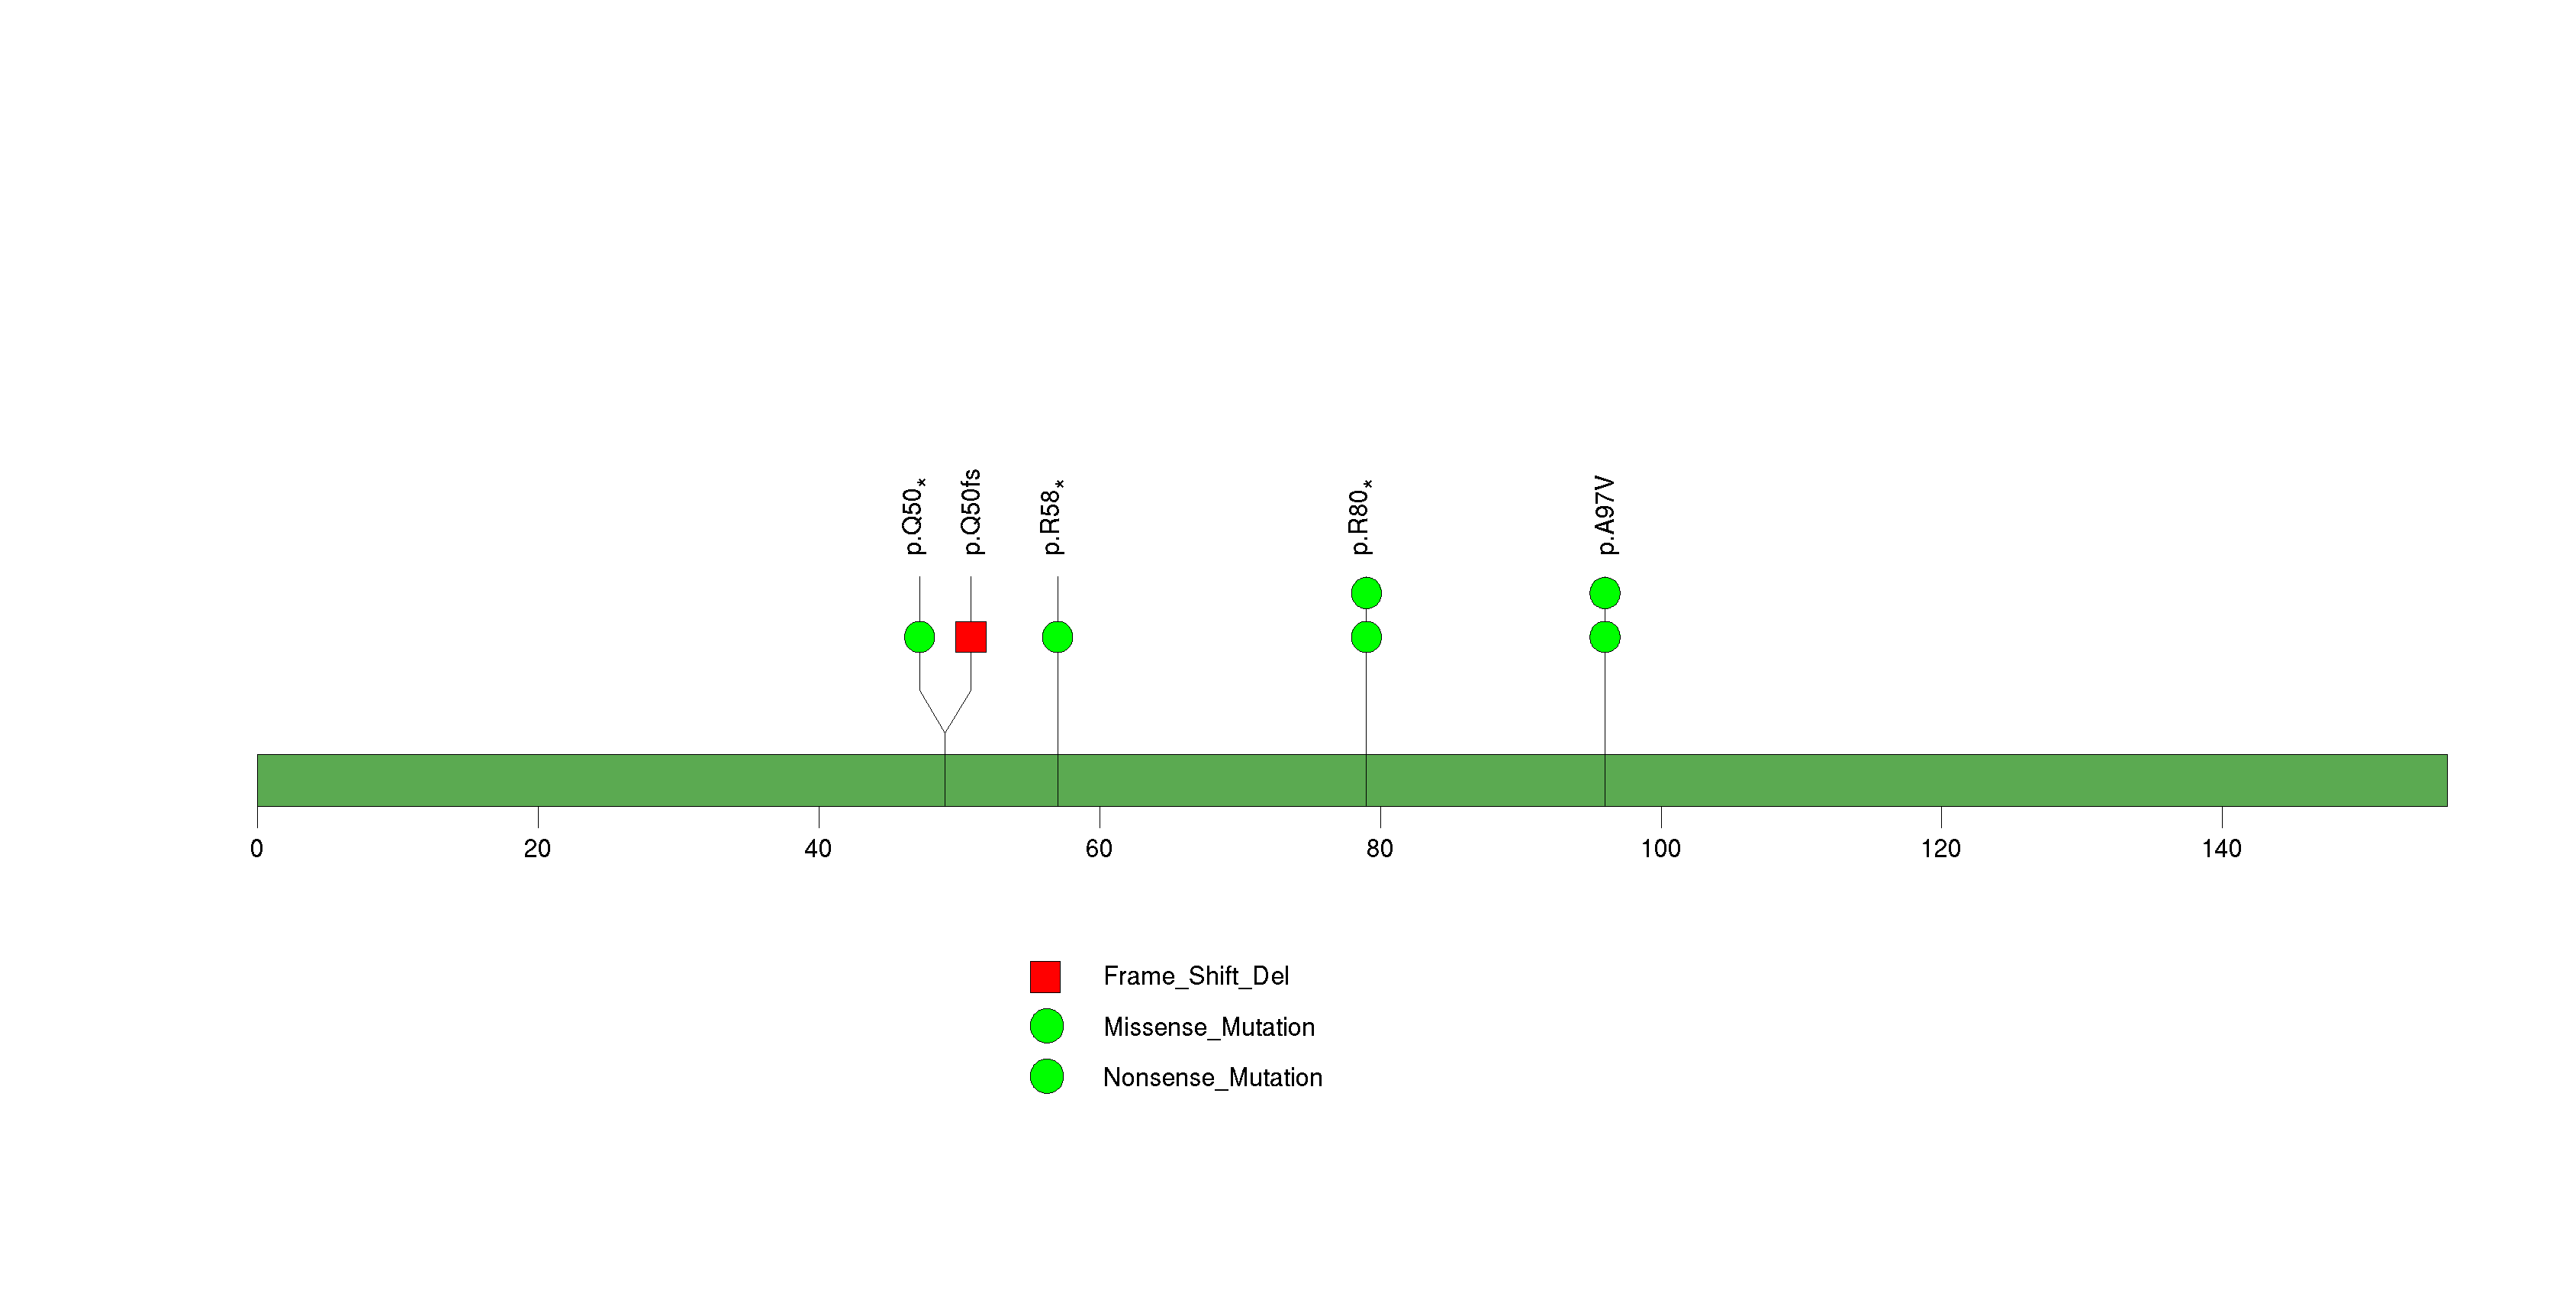
Figure S7. This figure depicts the distribution of mutations and mutation types across the NFIL3 significant gene.
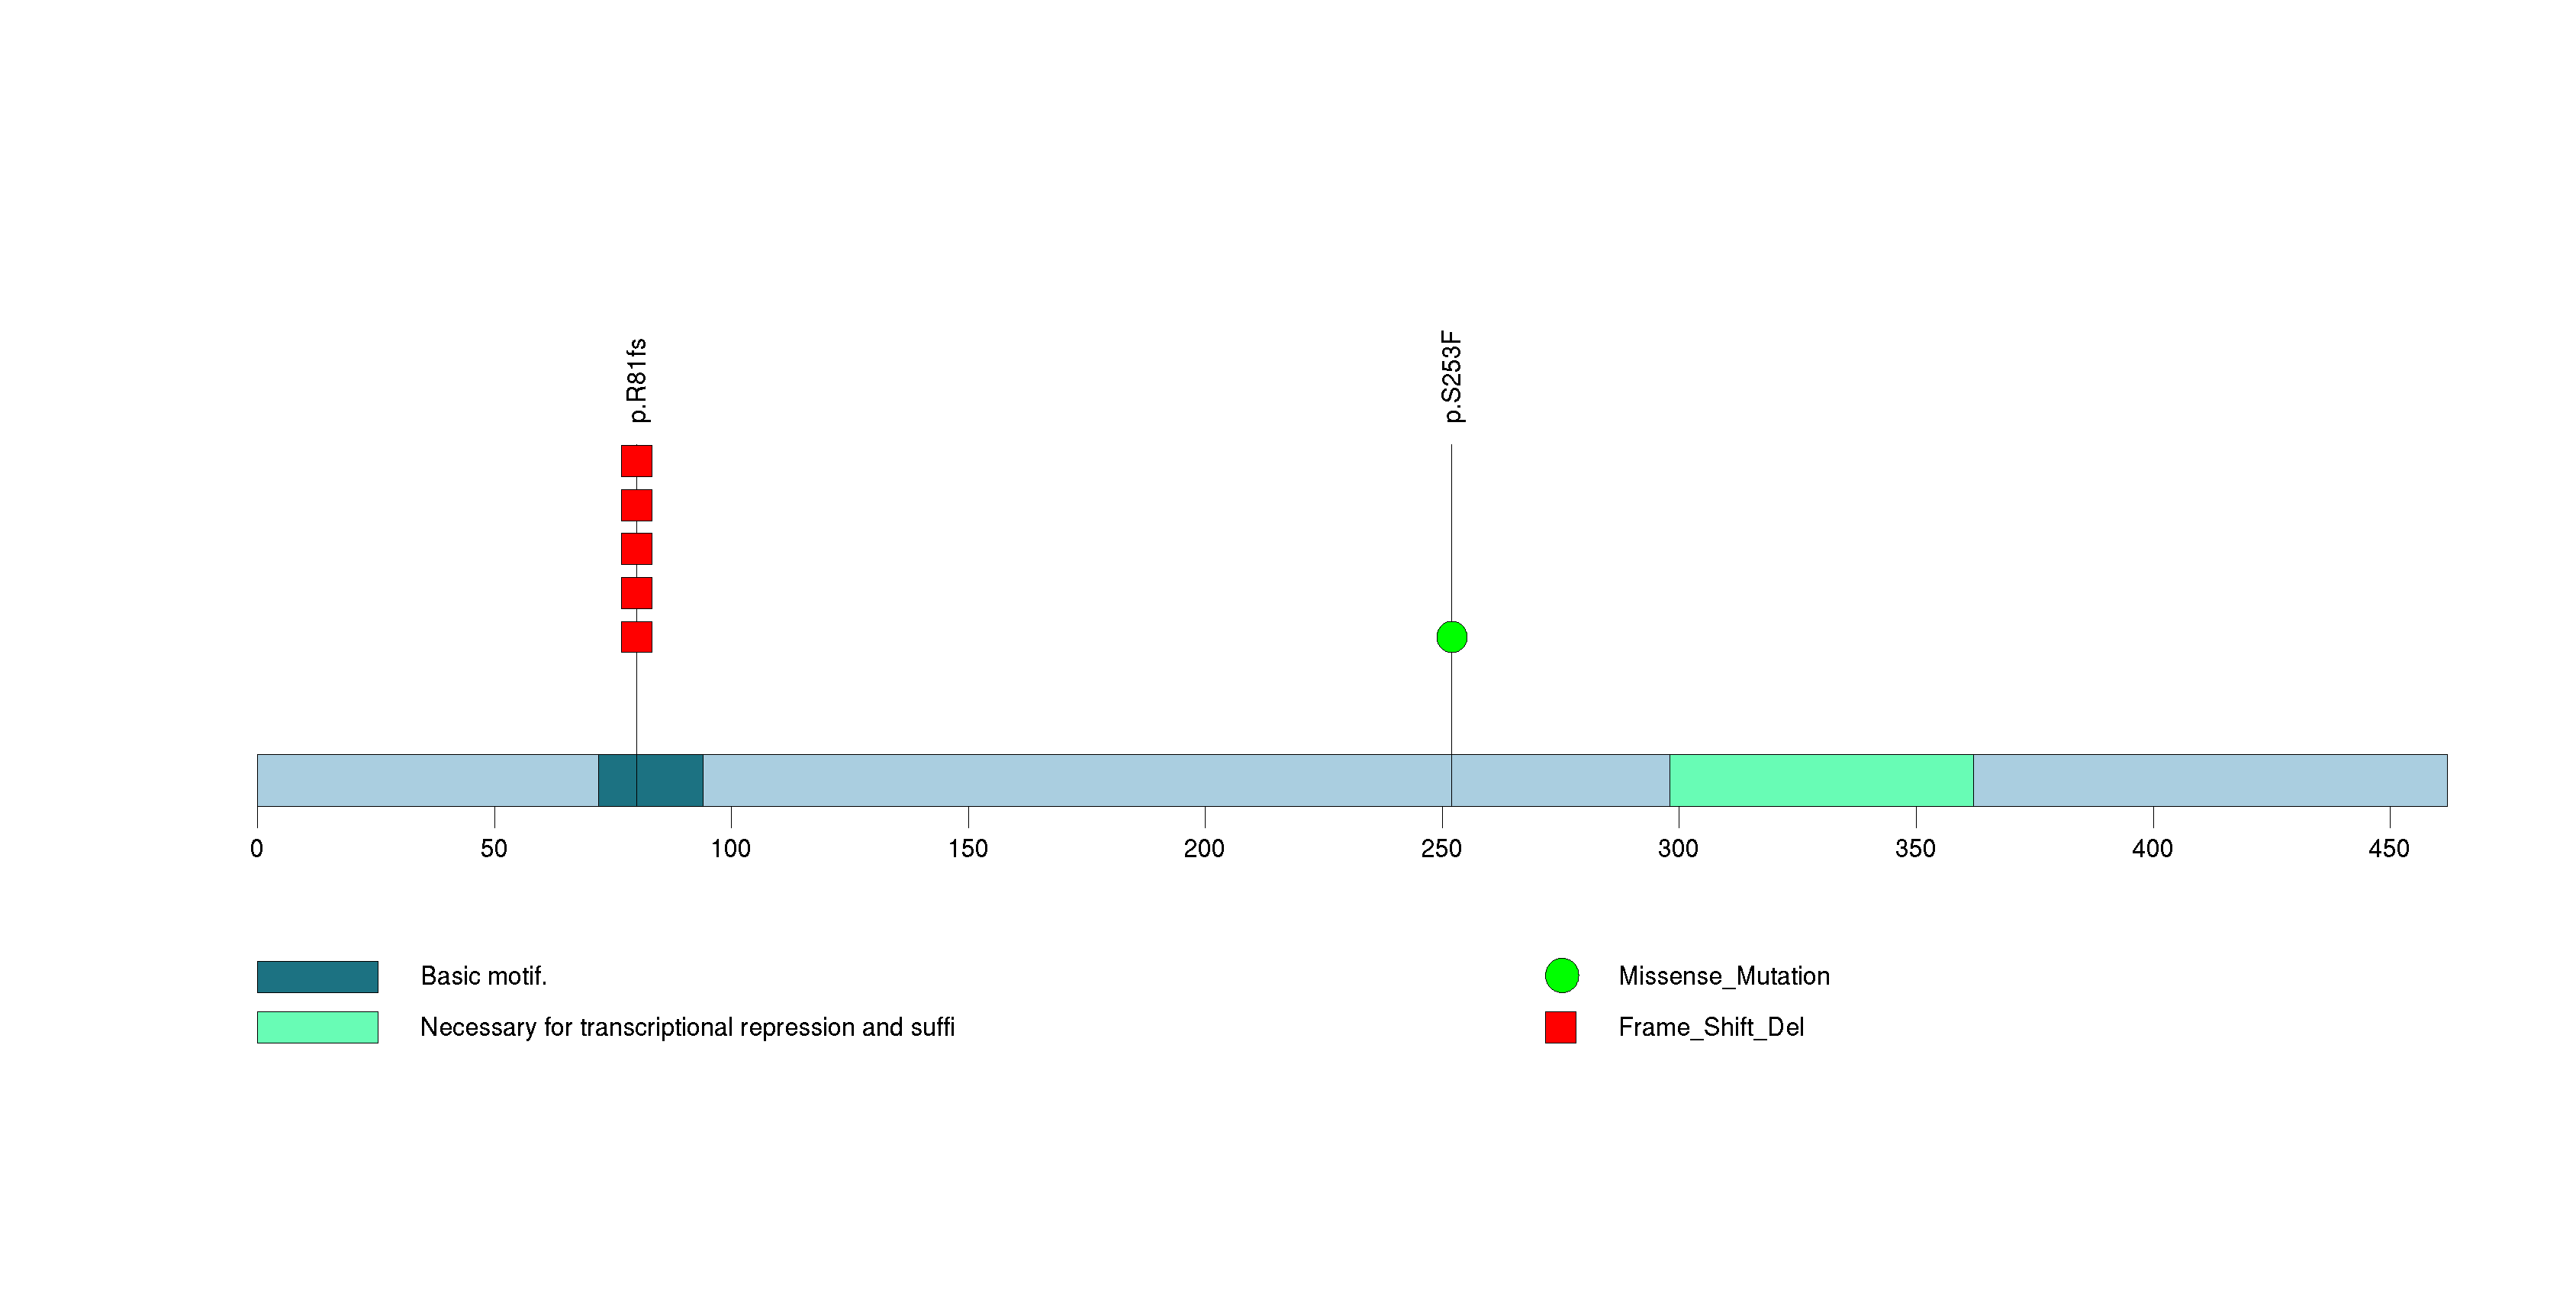
Figure S8. This figure depicts the distribution of mutations and mutation types across the OTOF significant gene.
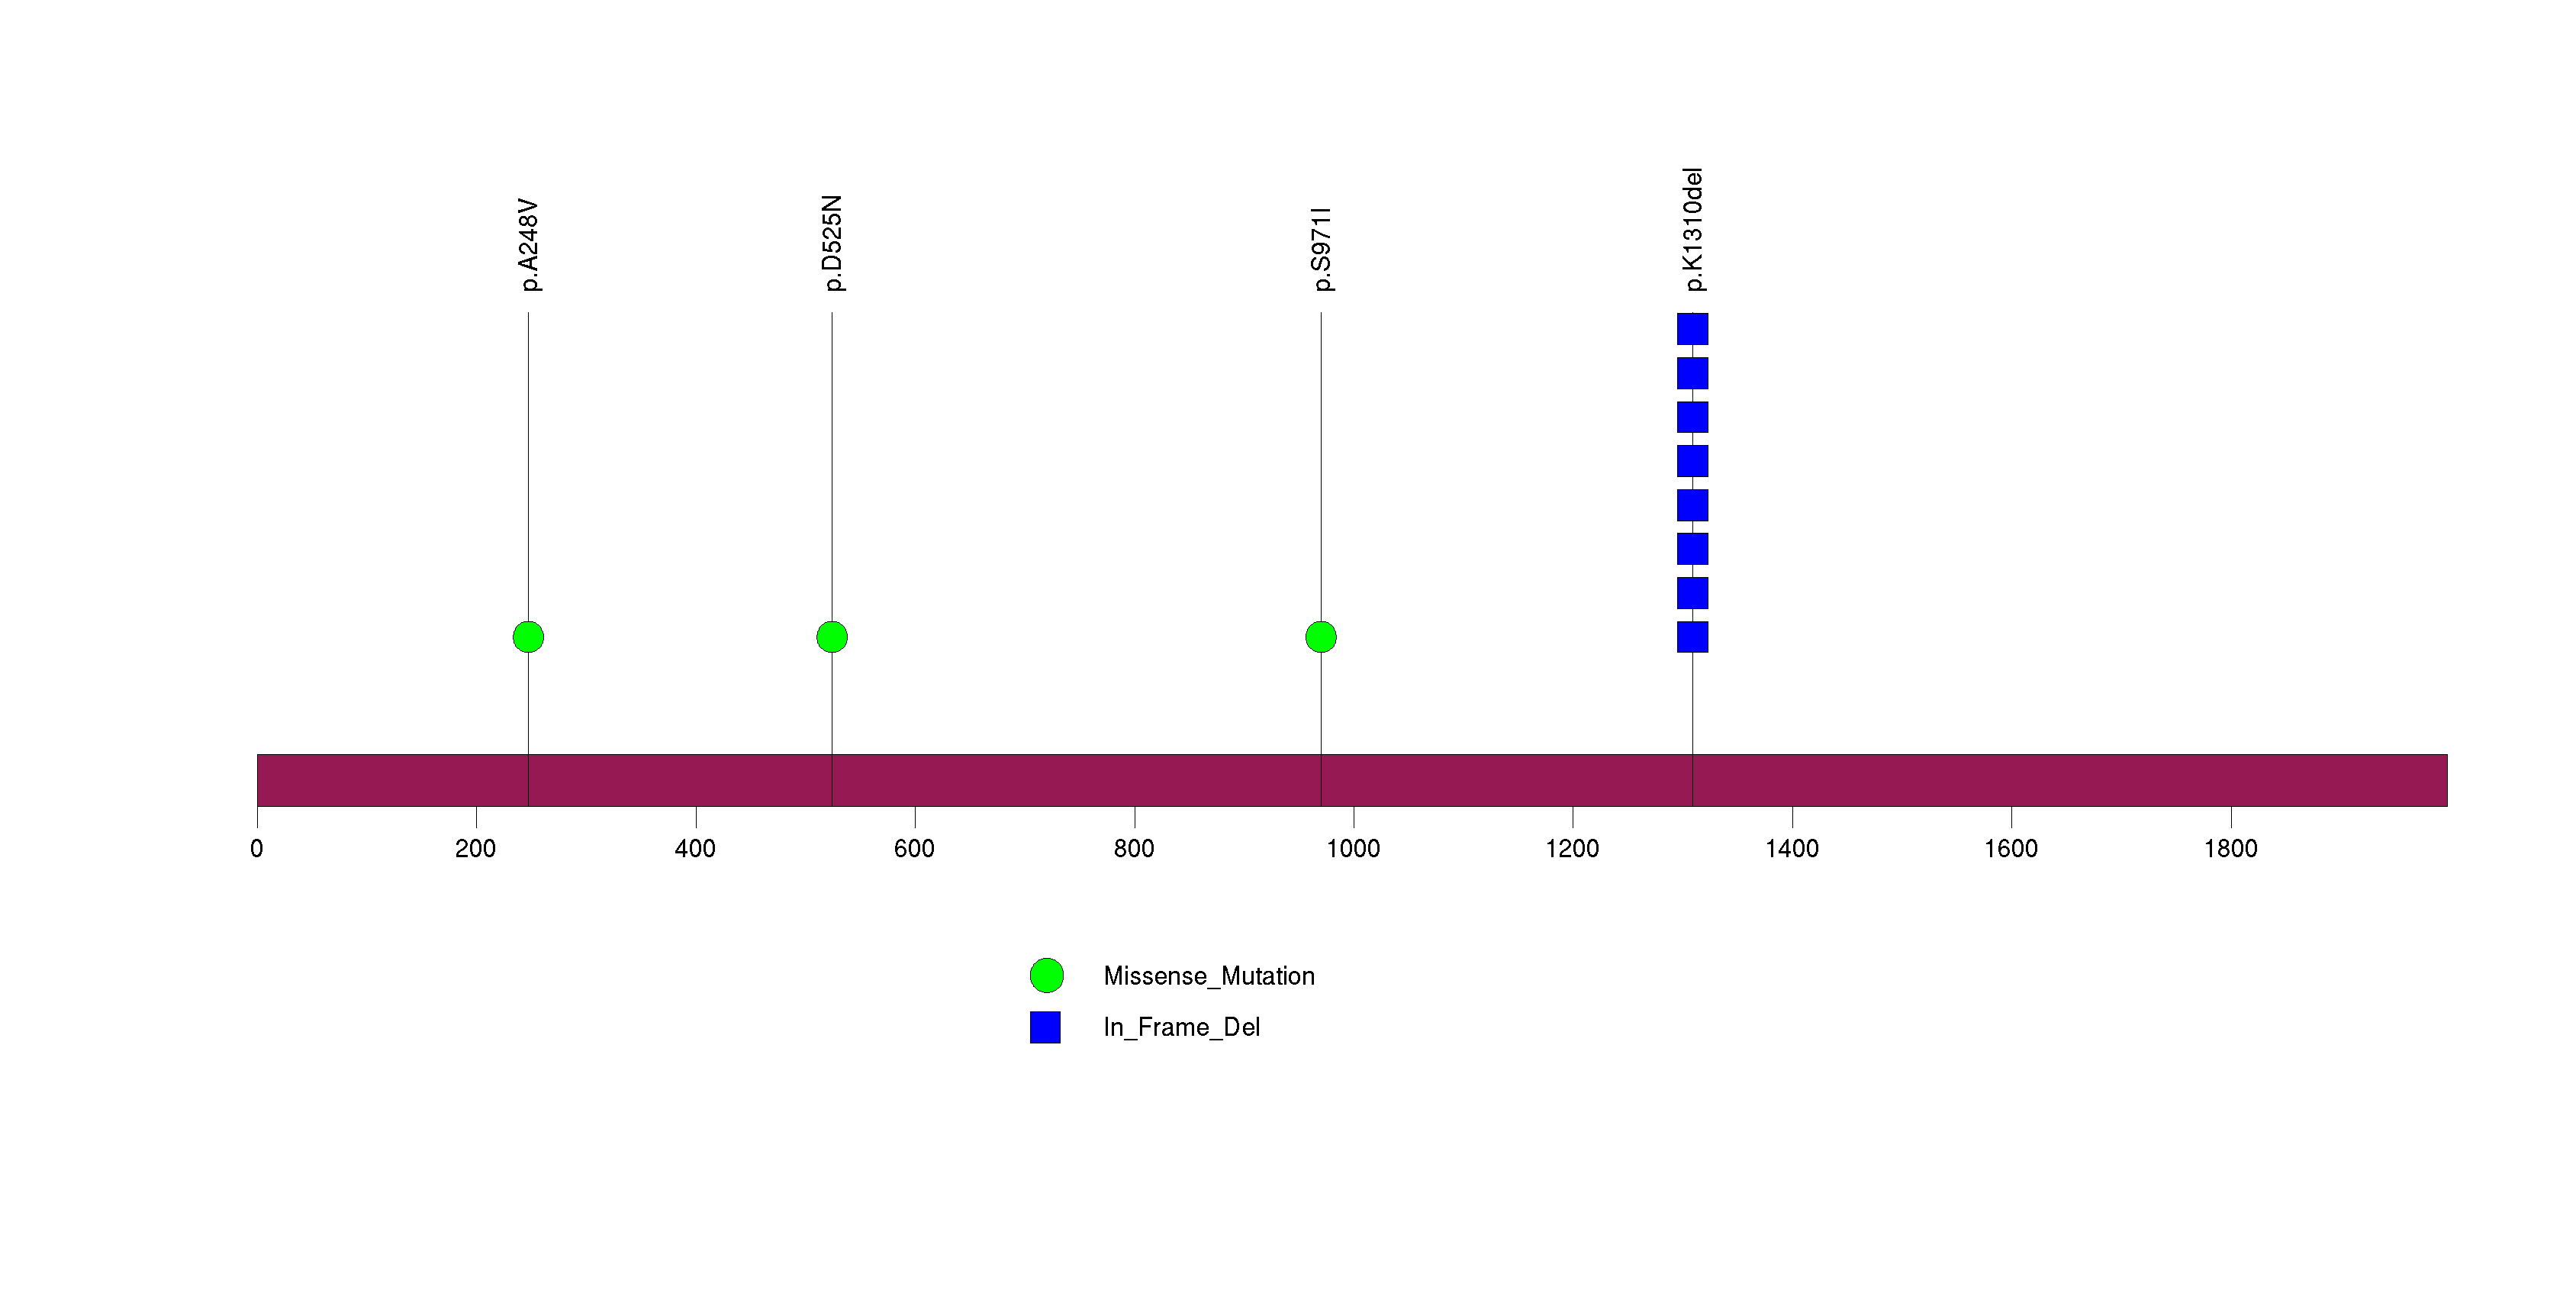
Figure S9. This figure depicts the distribution of mutations and mutation types across the IRS1 significant gene.
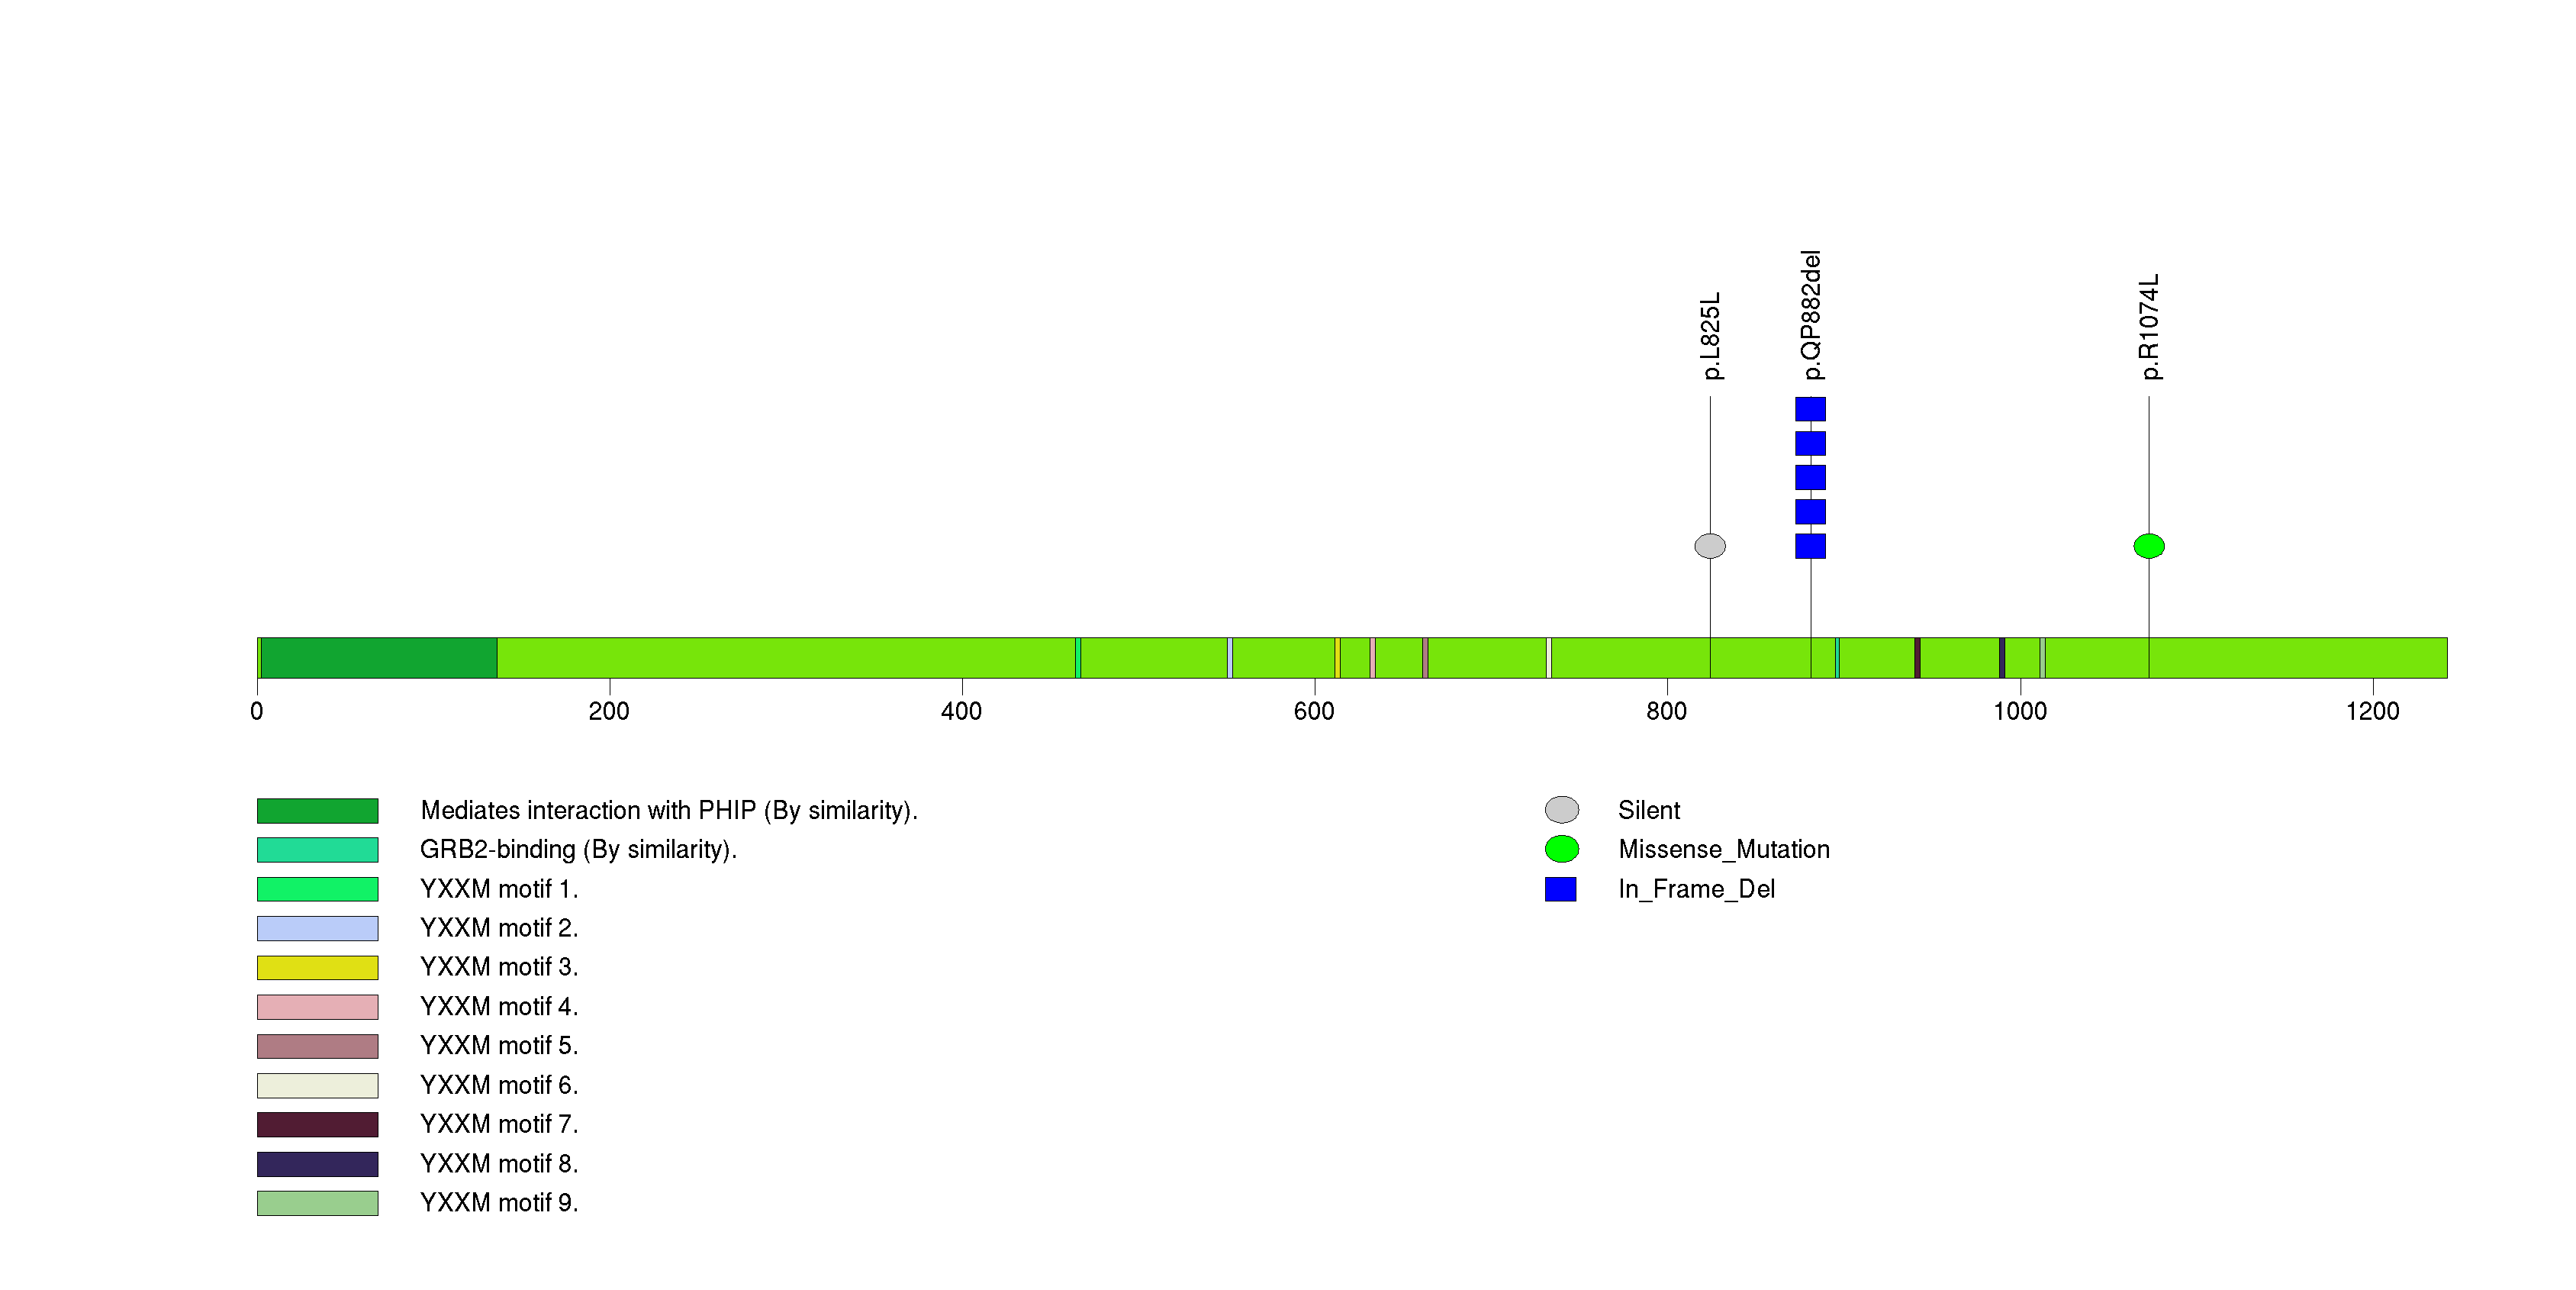
Figure S10. This figure depicts the distribution of mutations and mutation types across the GAS2L2 significant gene.
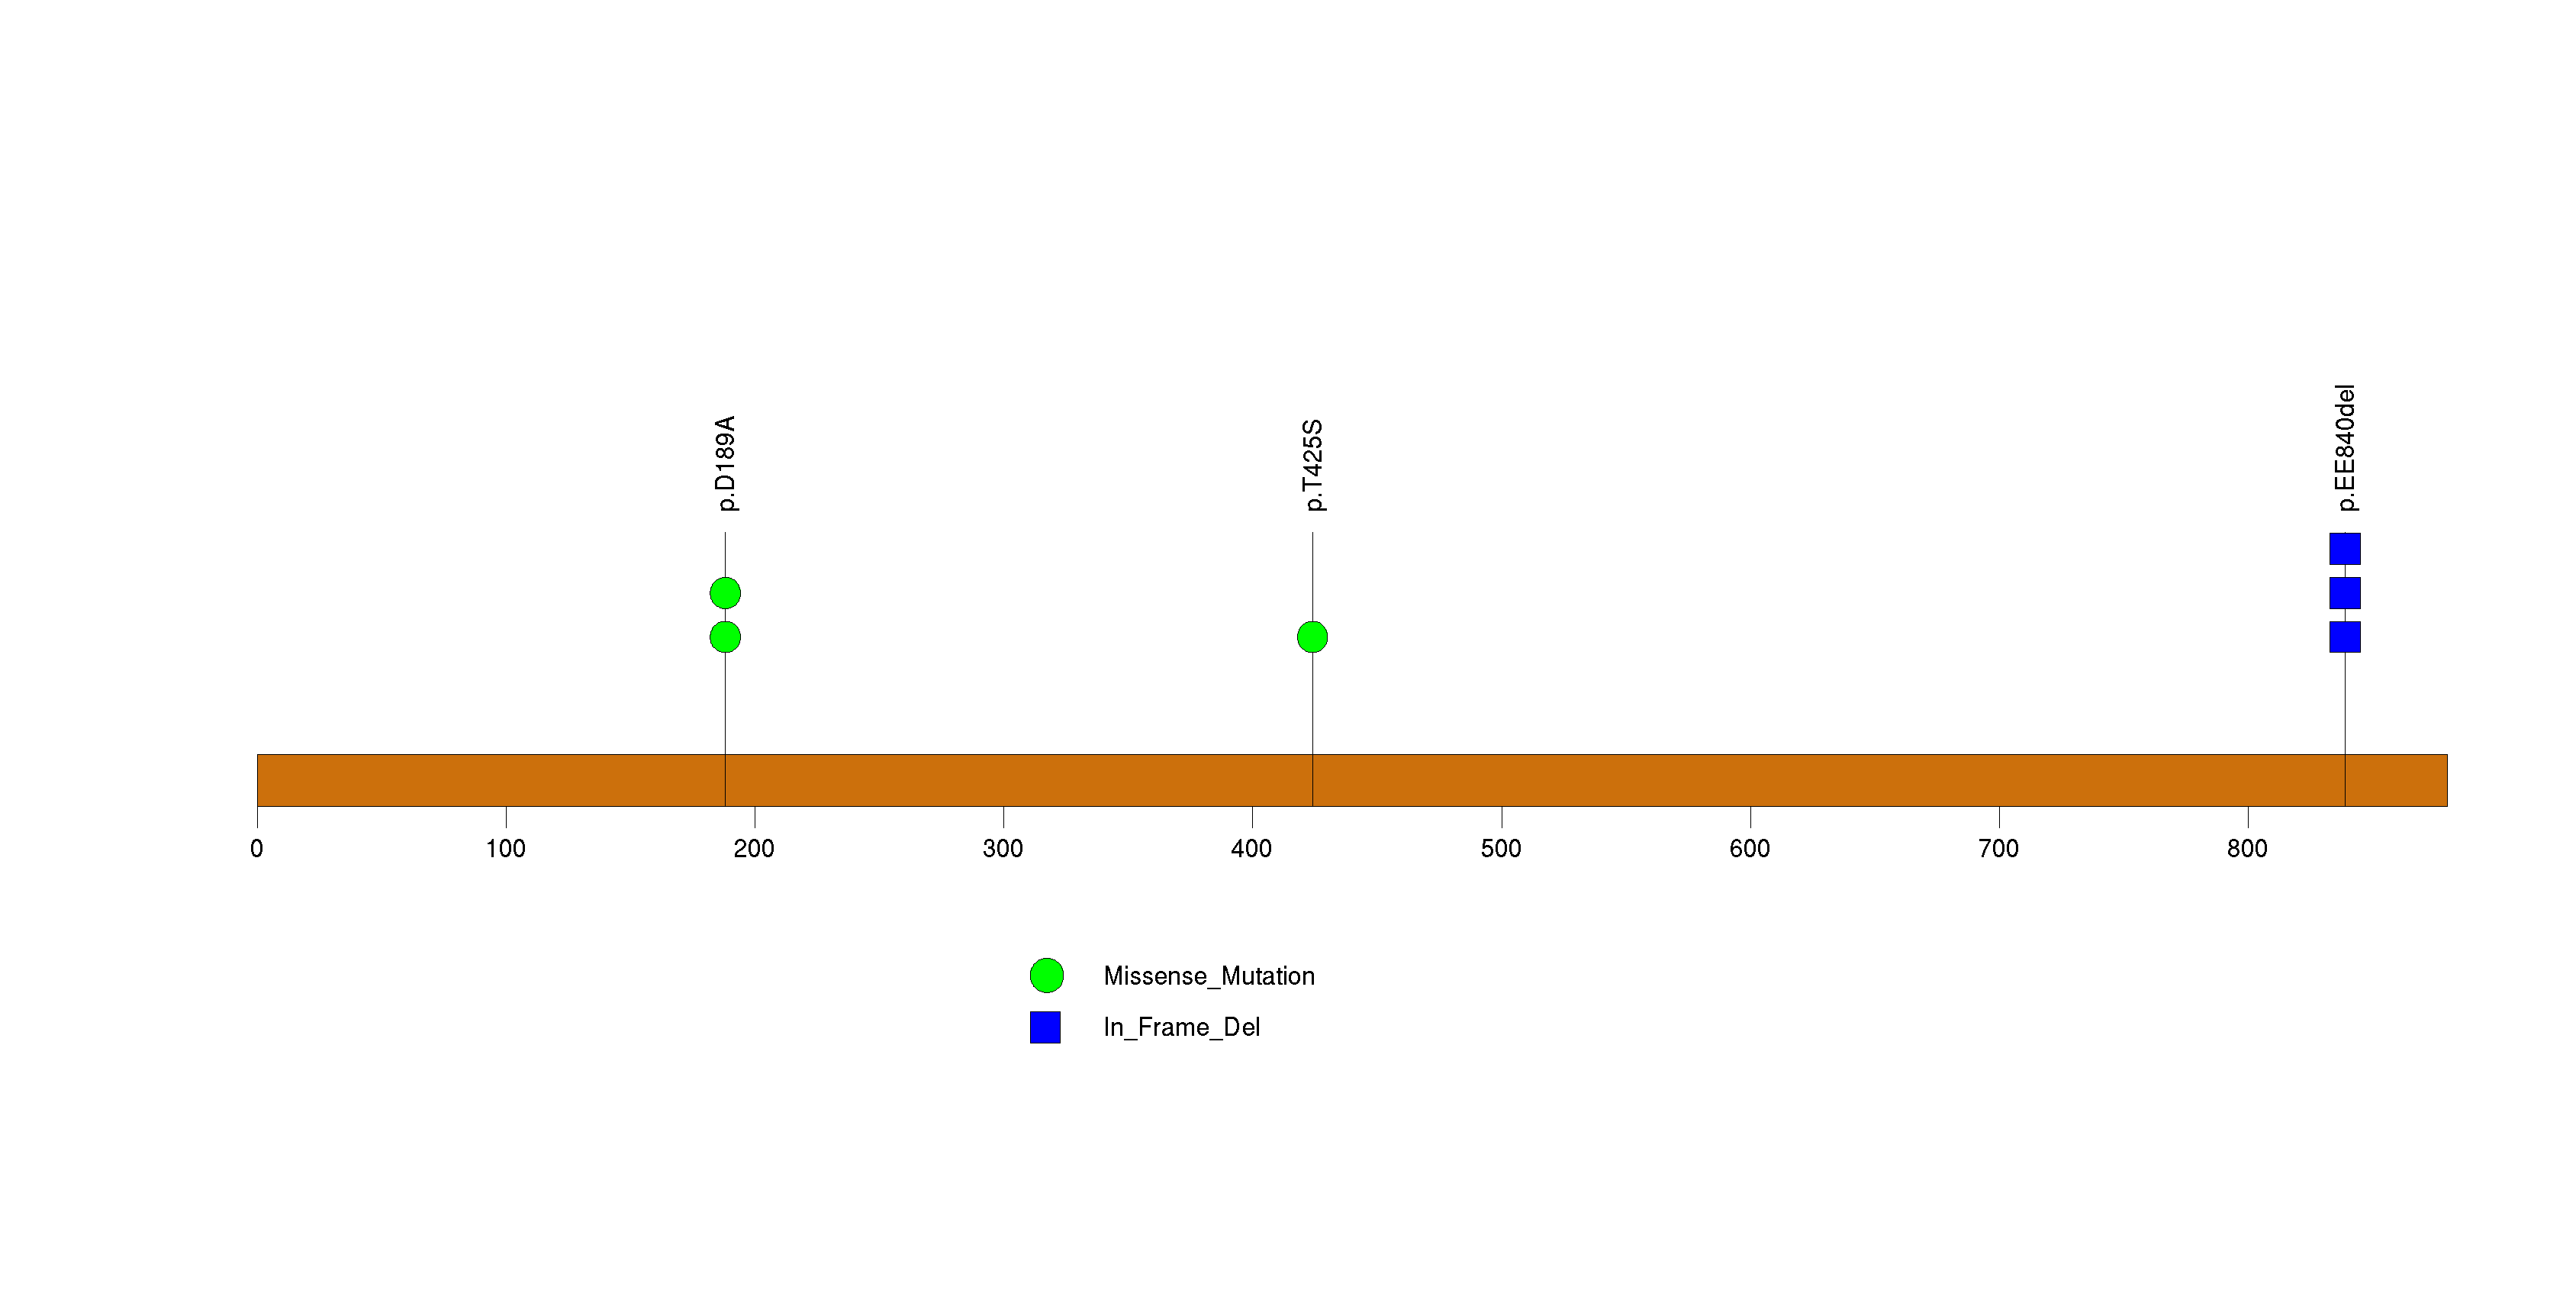
Figure S11. This figure depicts the distribution of mutations and mutation types across the RBM10 significant gene.
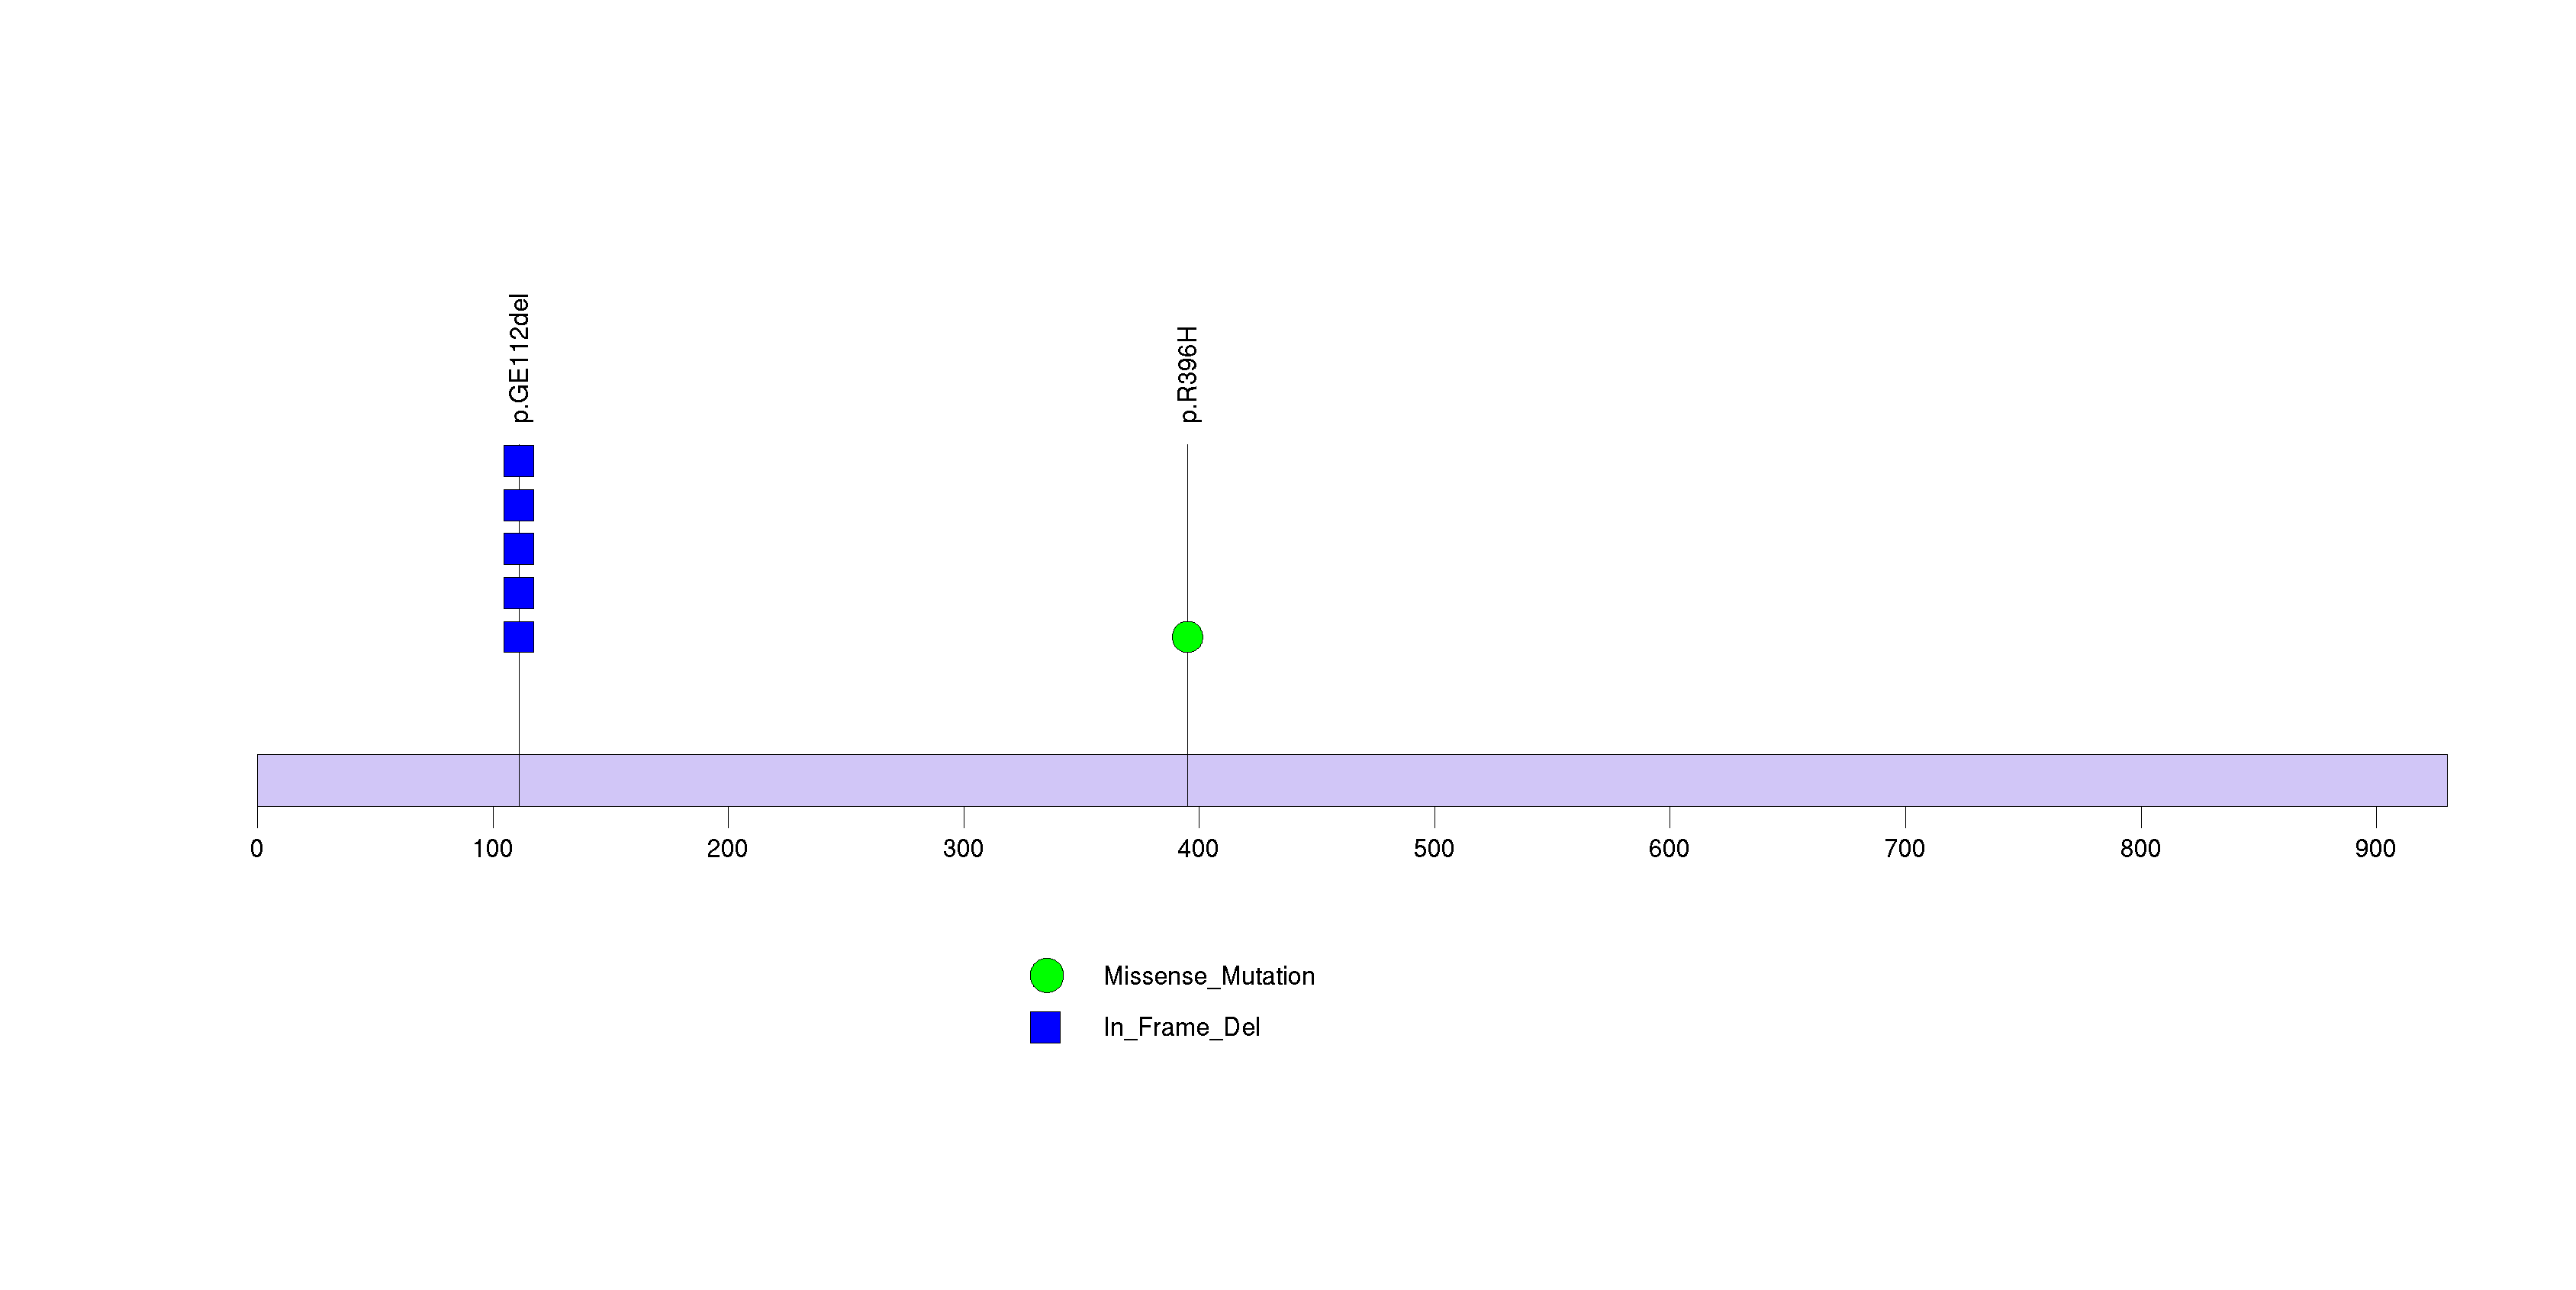
Figure S12. This figure depicts the distribution of mutations and mutation types across the APP significant gene.
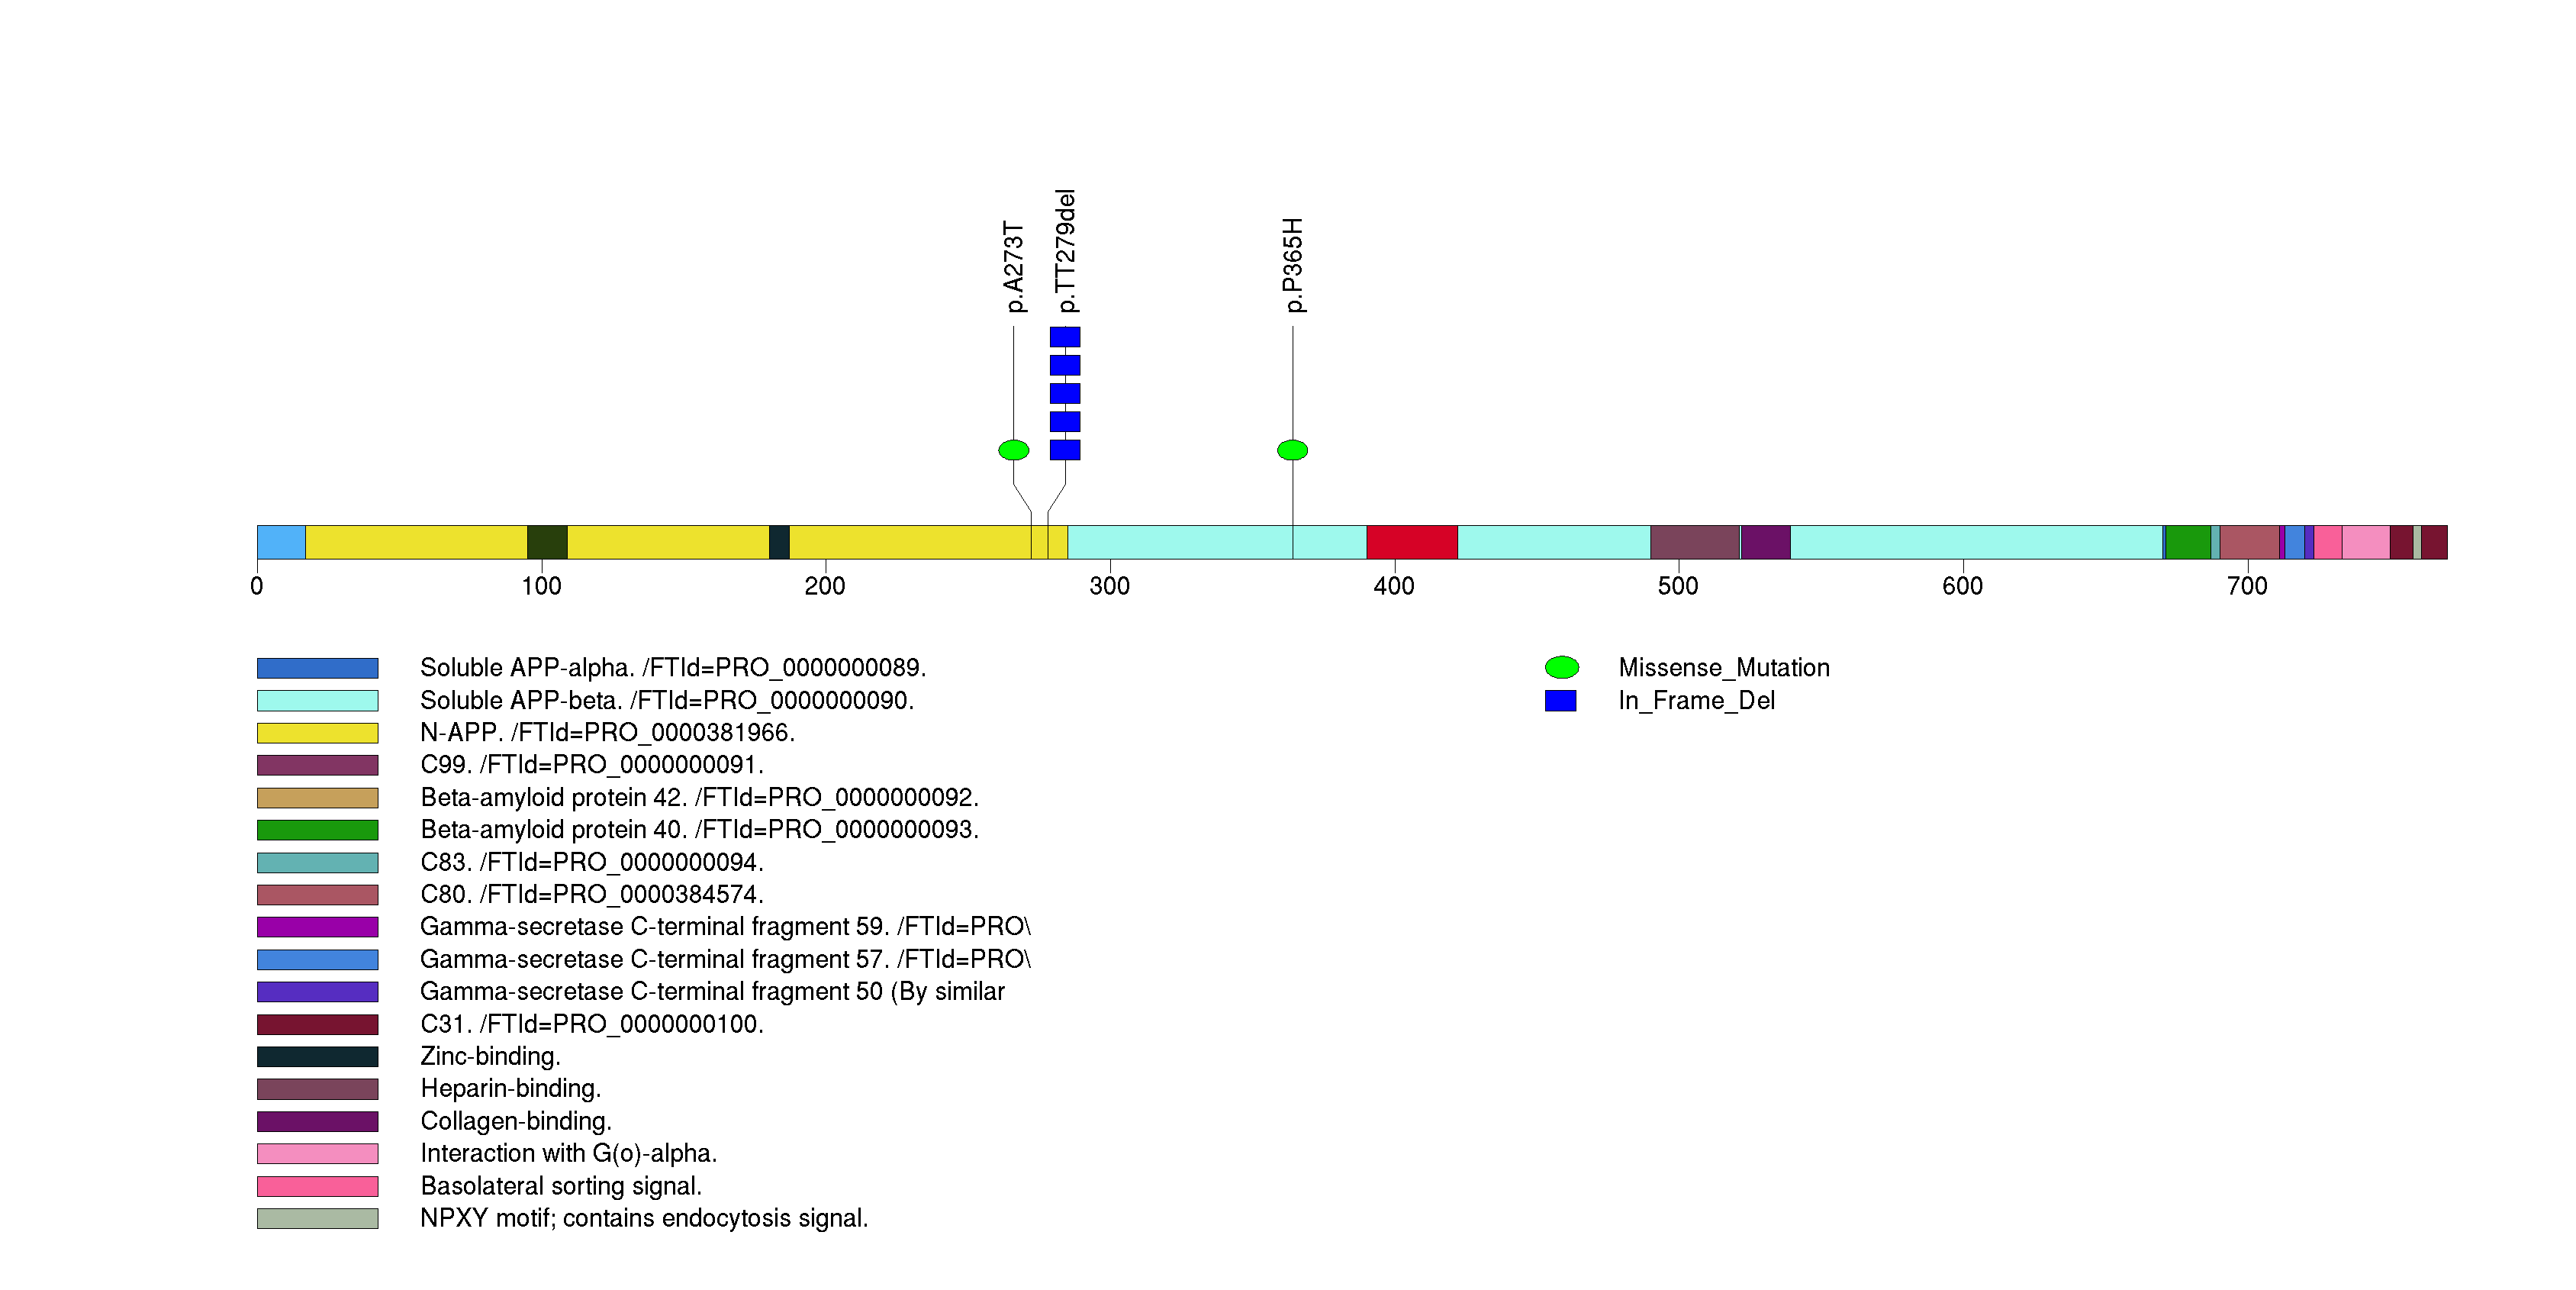
Figure S13. This figure depicts the distribution of mutations and mutation types across the IPP significant gene.
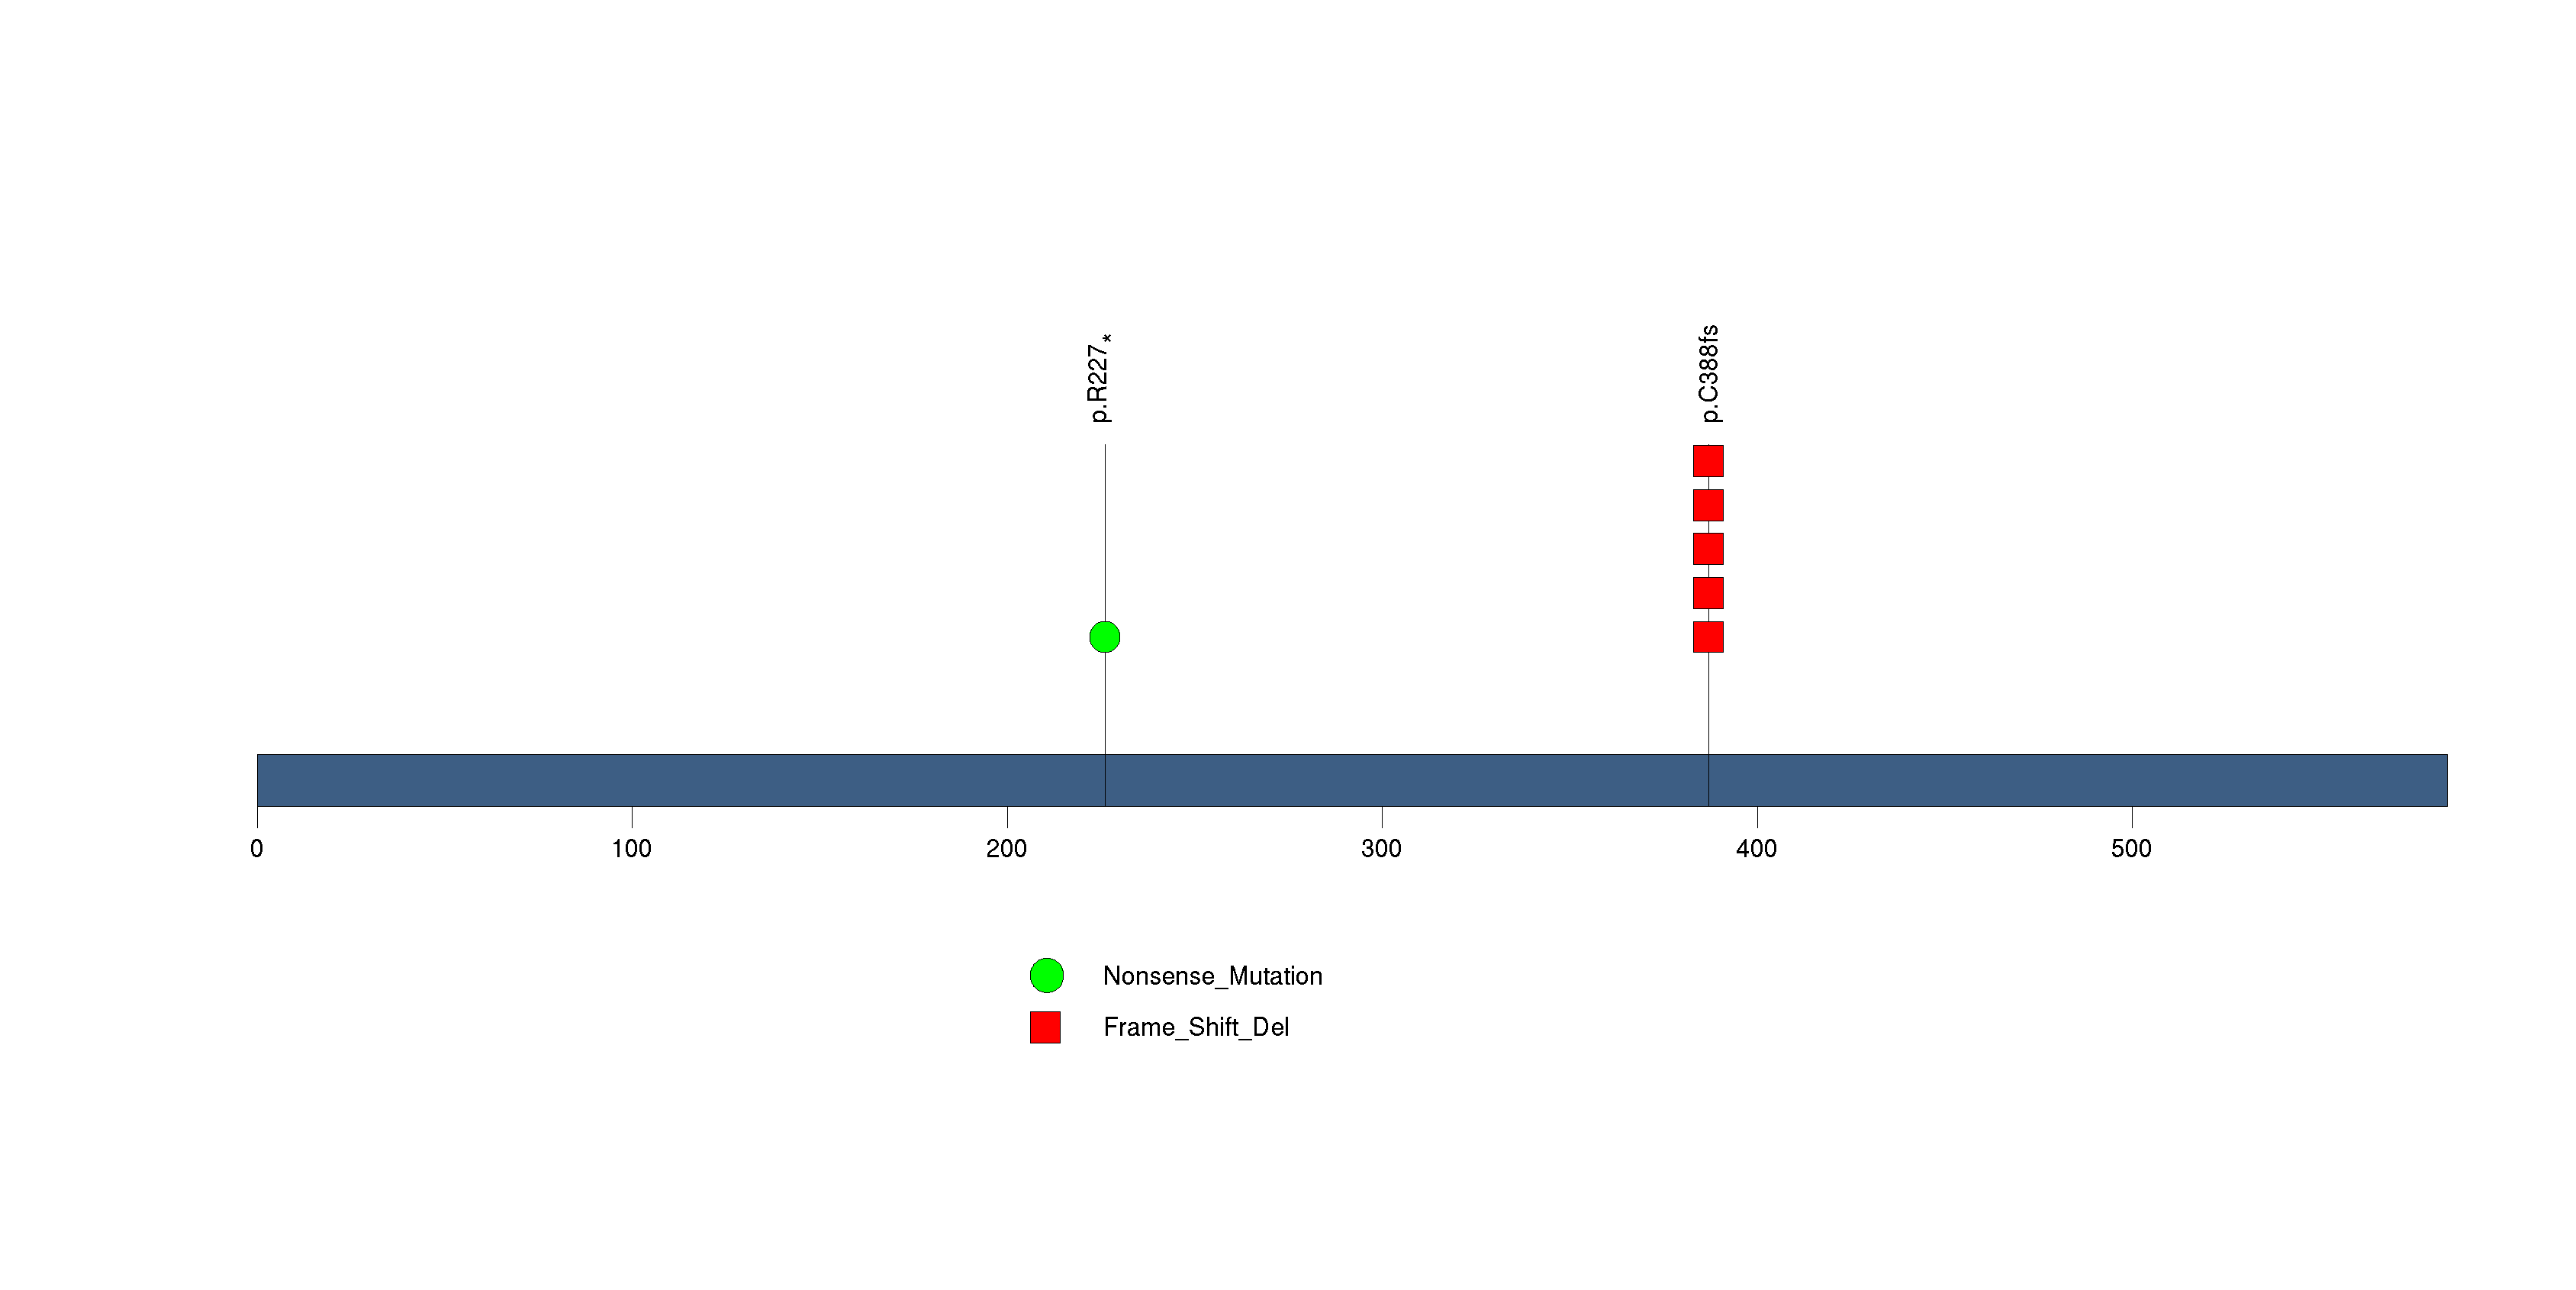
Figure S14. This figure depicts the distribution of mutations and mutation types across the MAMLD1 significant gene.
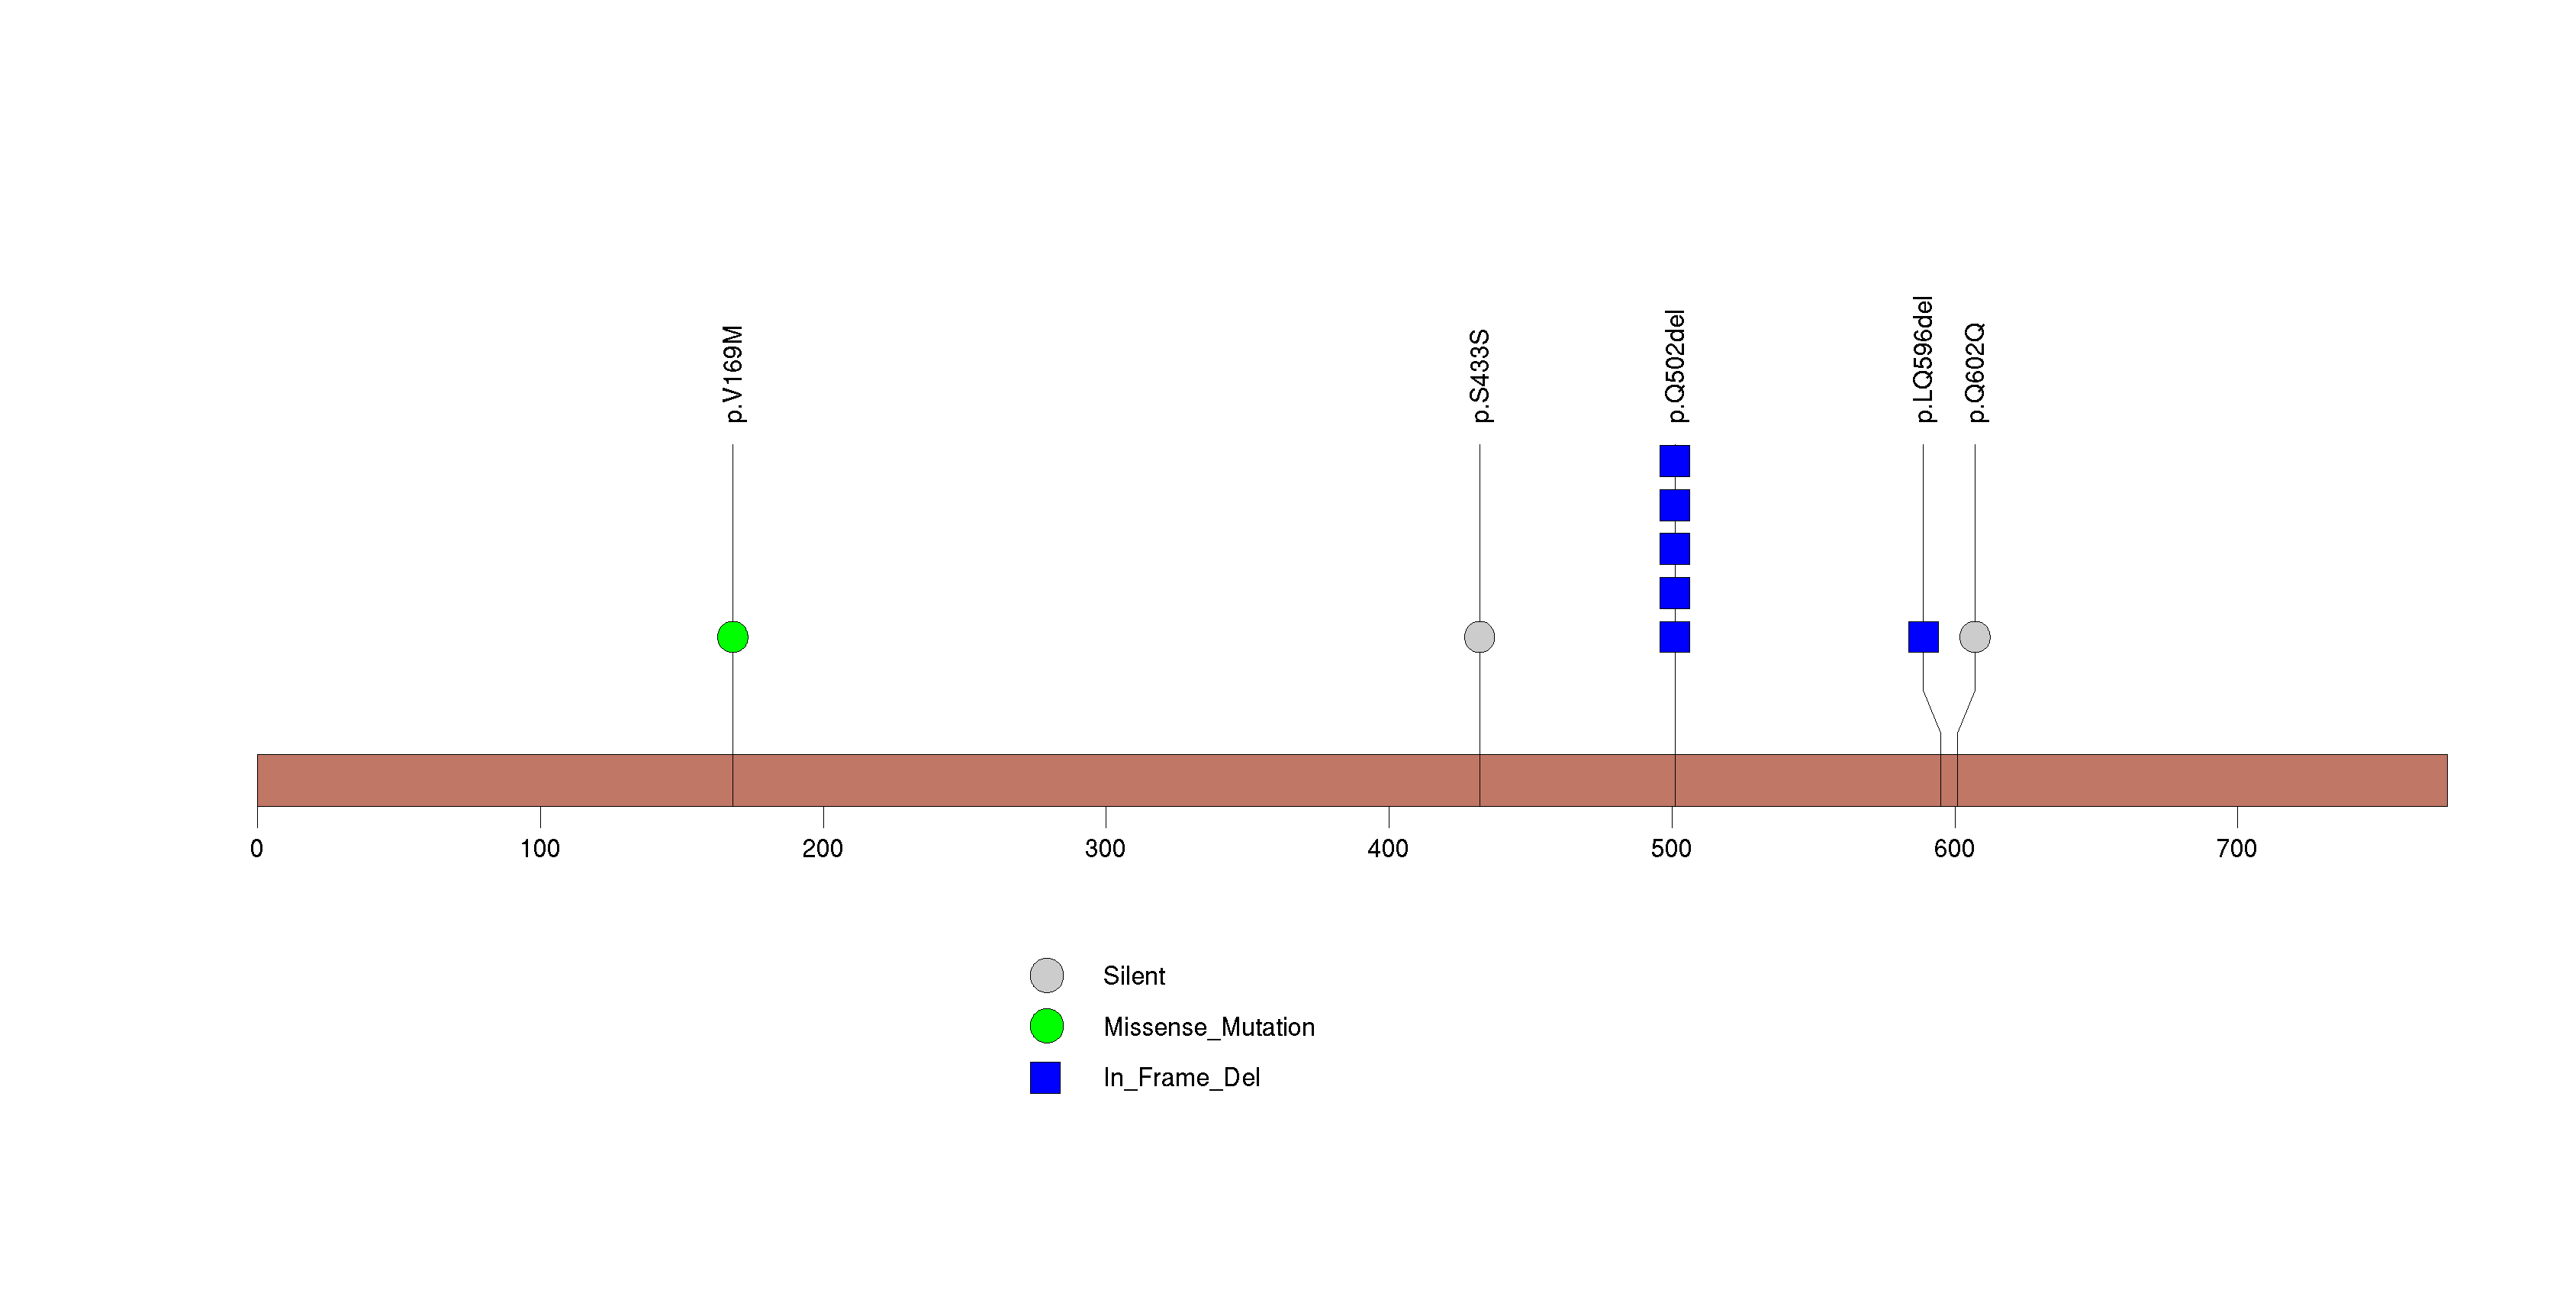
Figure S15. This figure depicts the distribution of mutations and mutation types across the ARHGAP18 significant gene.
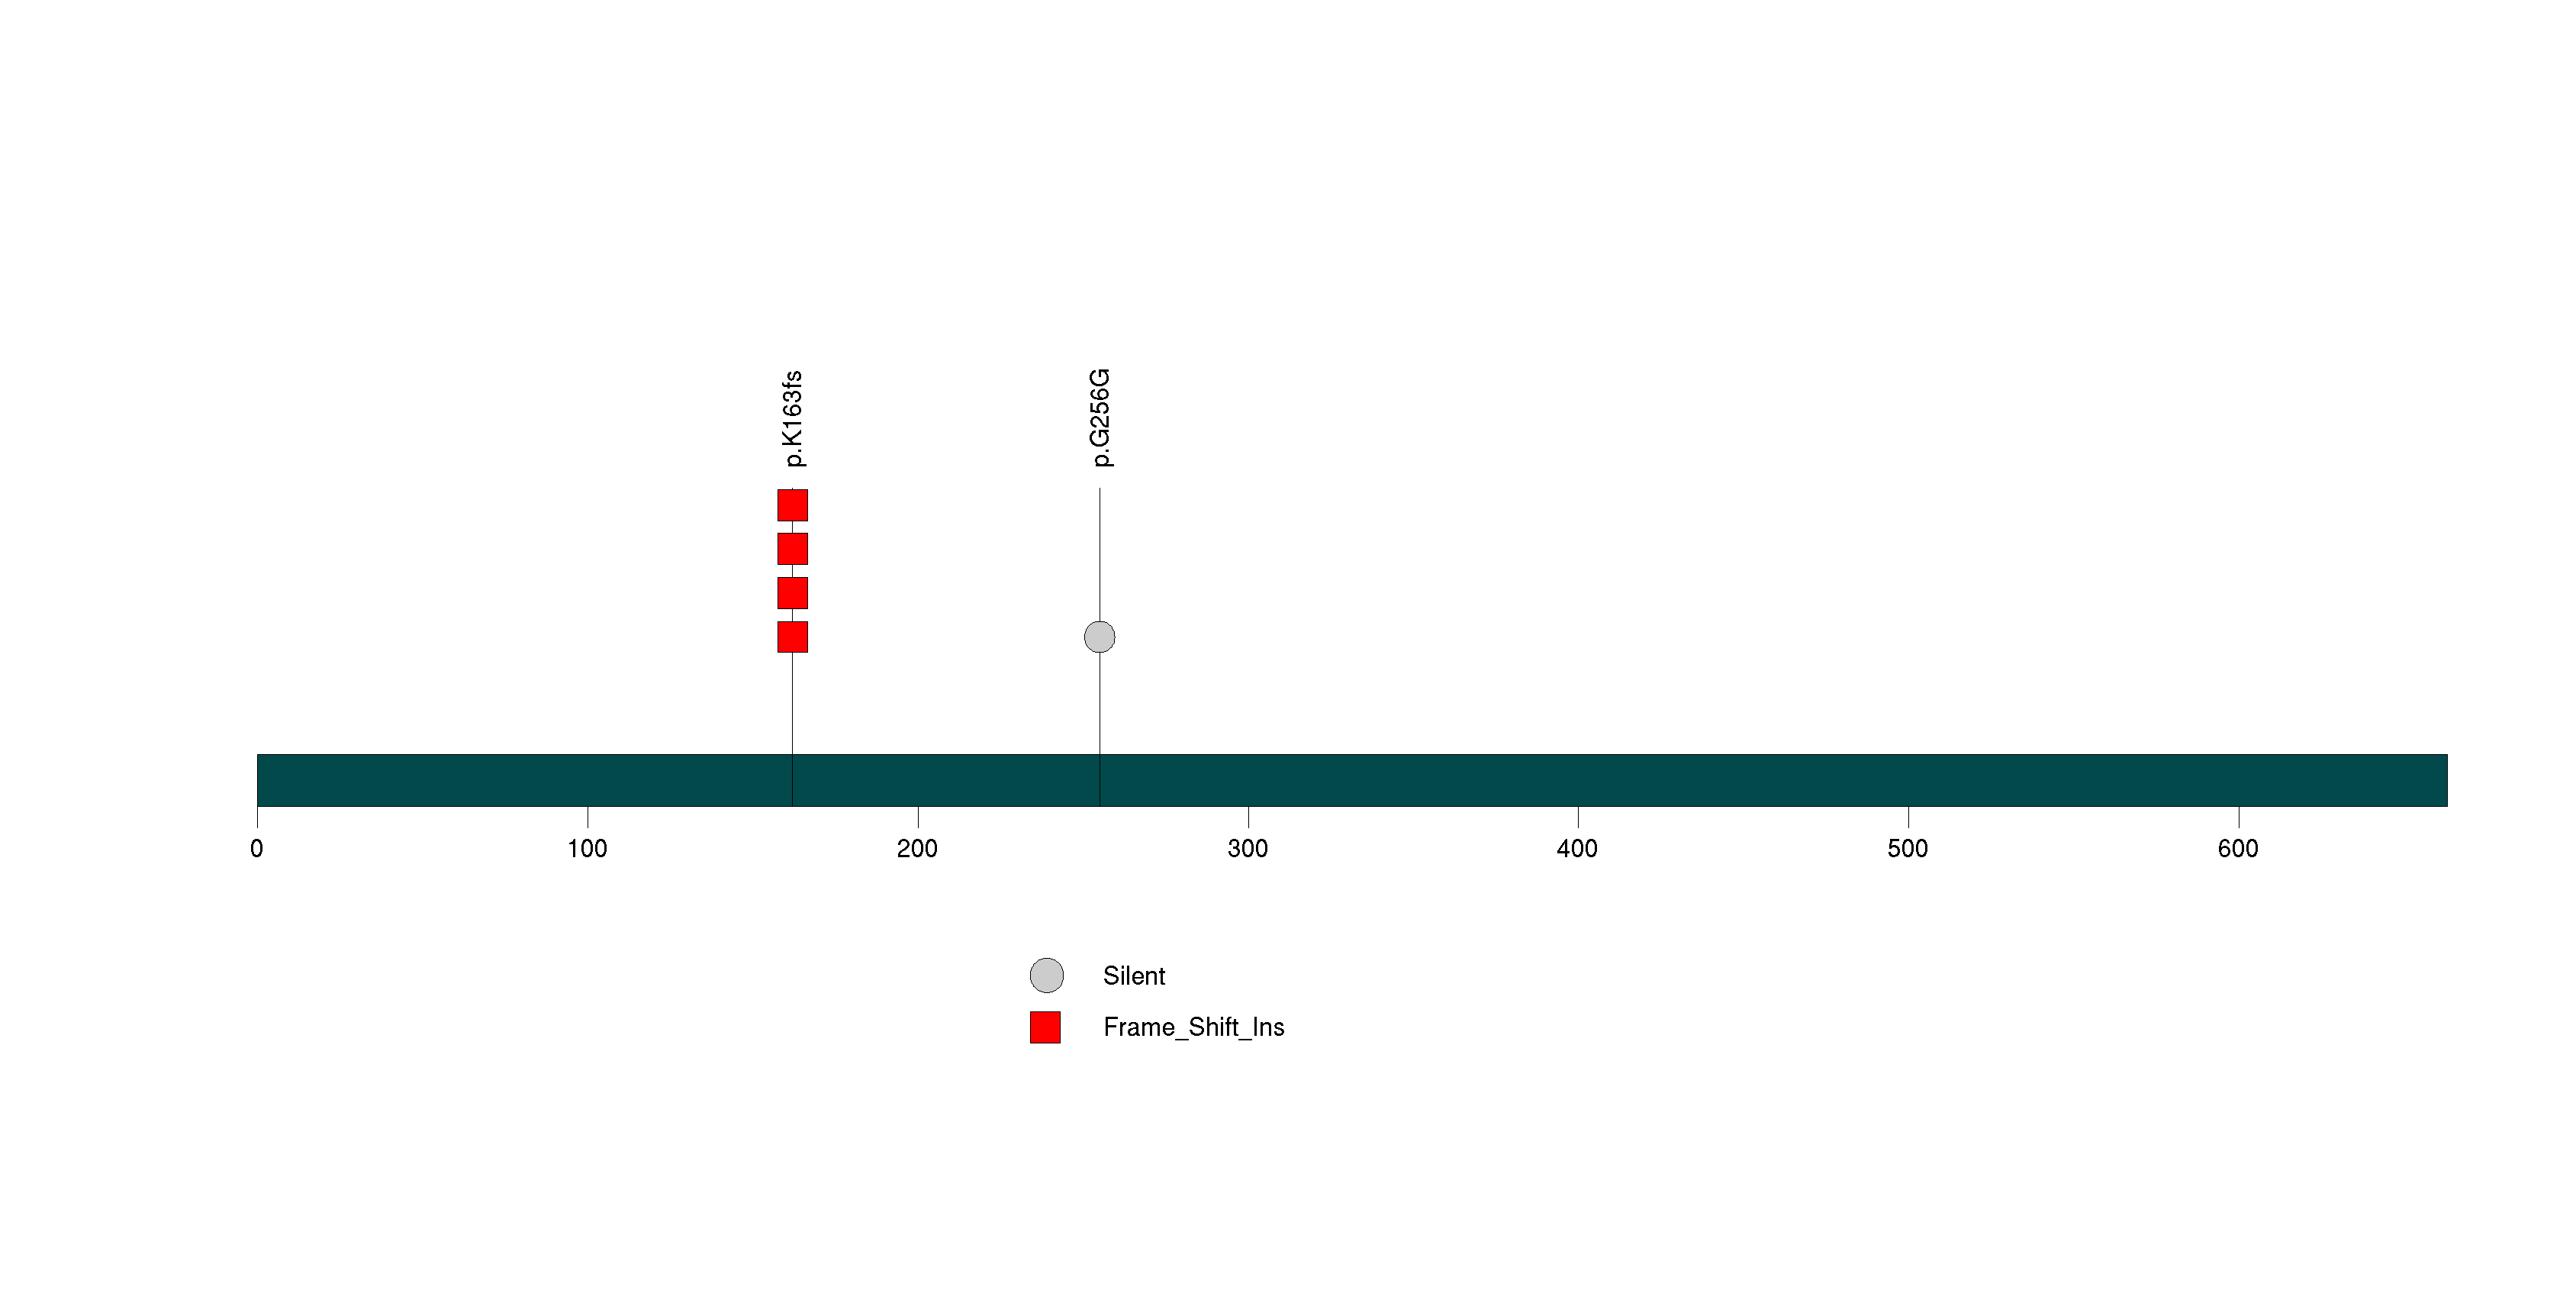
Figure S16. This figure depicts the distribution of mutations and mutation types across the PHF8 significant gene.
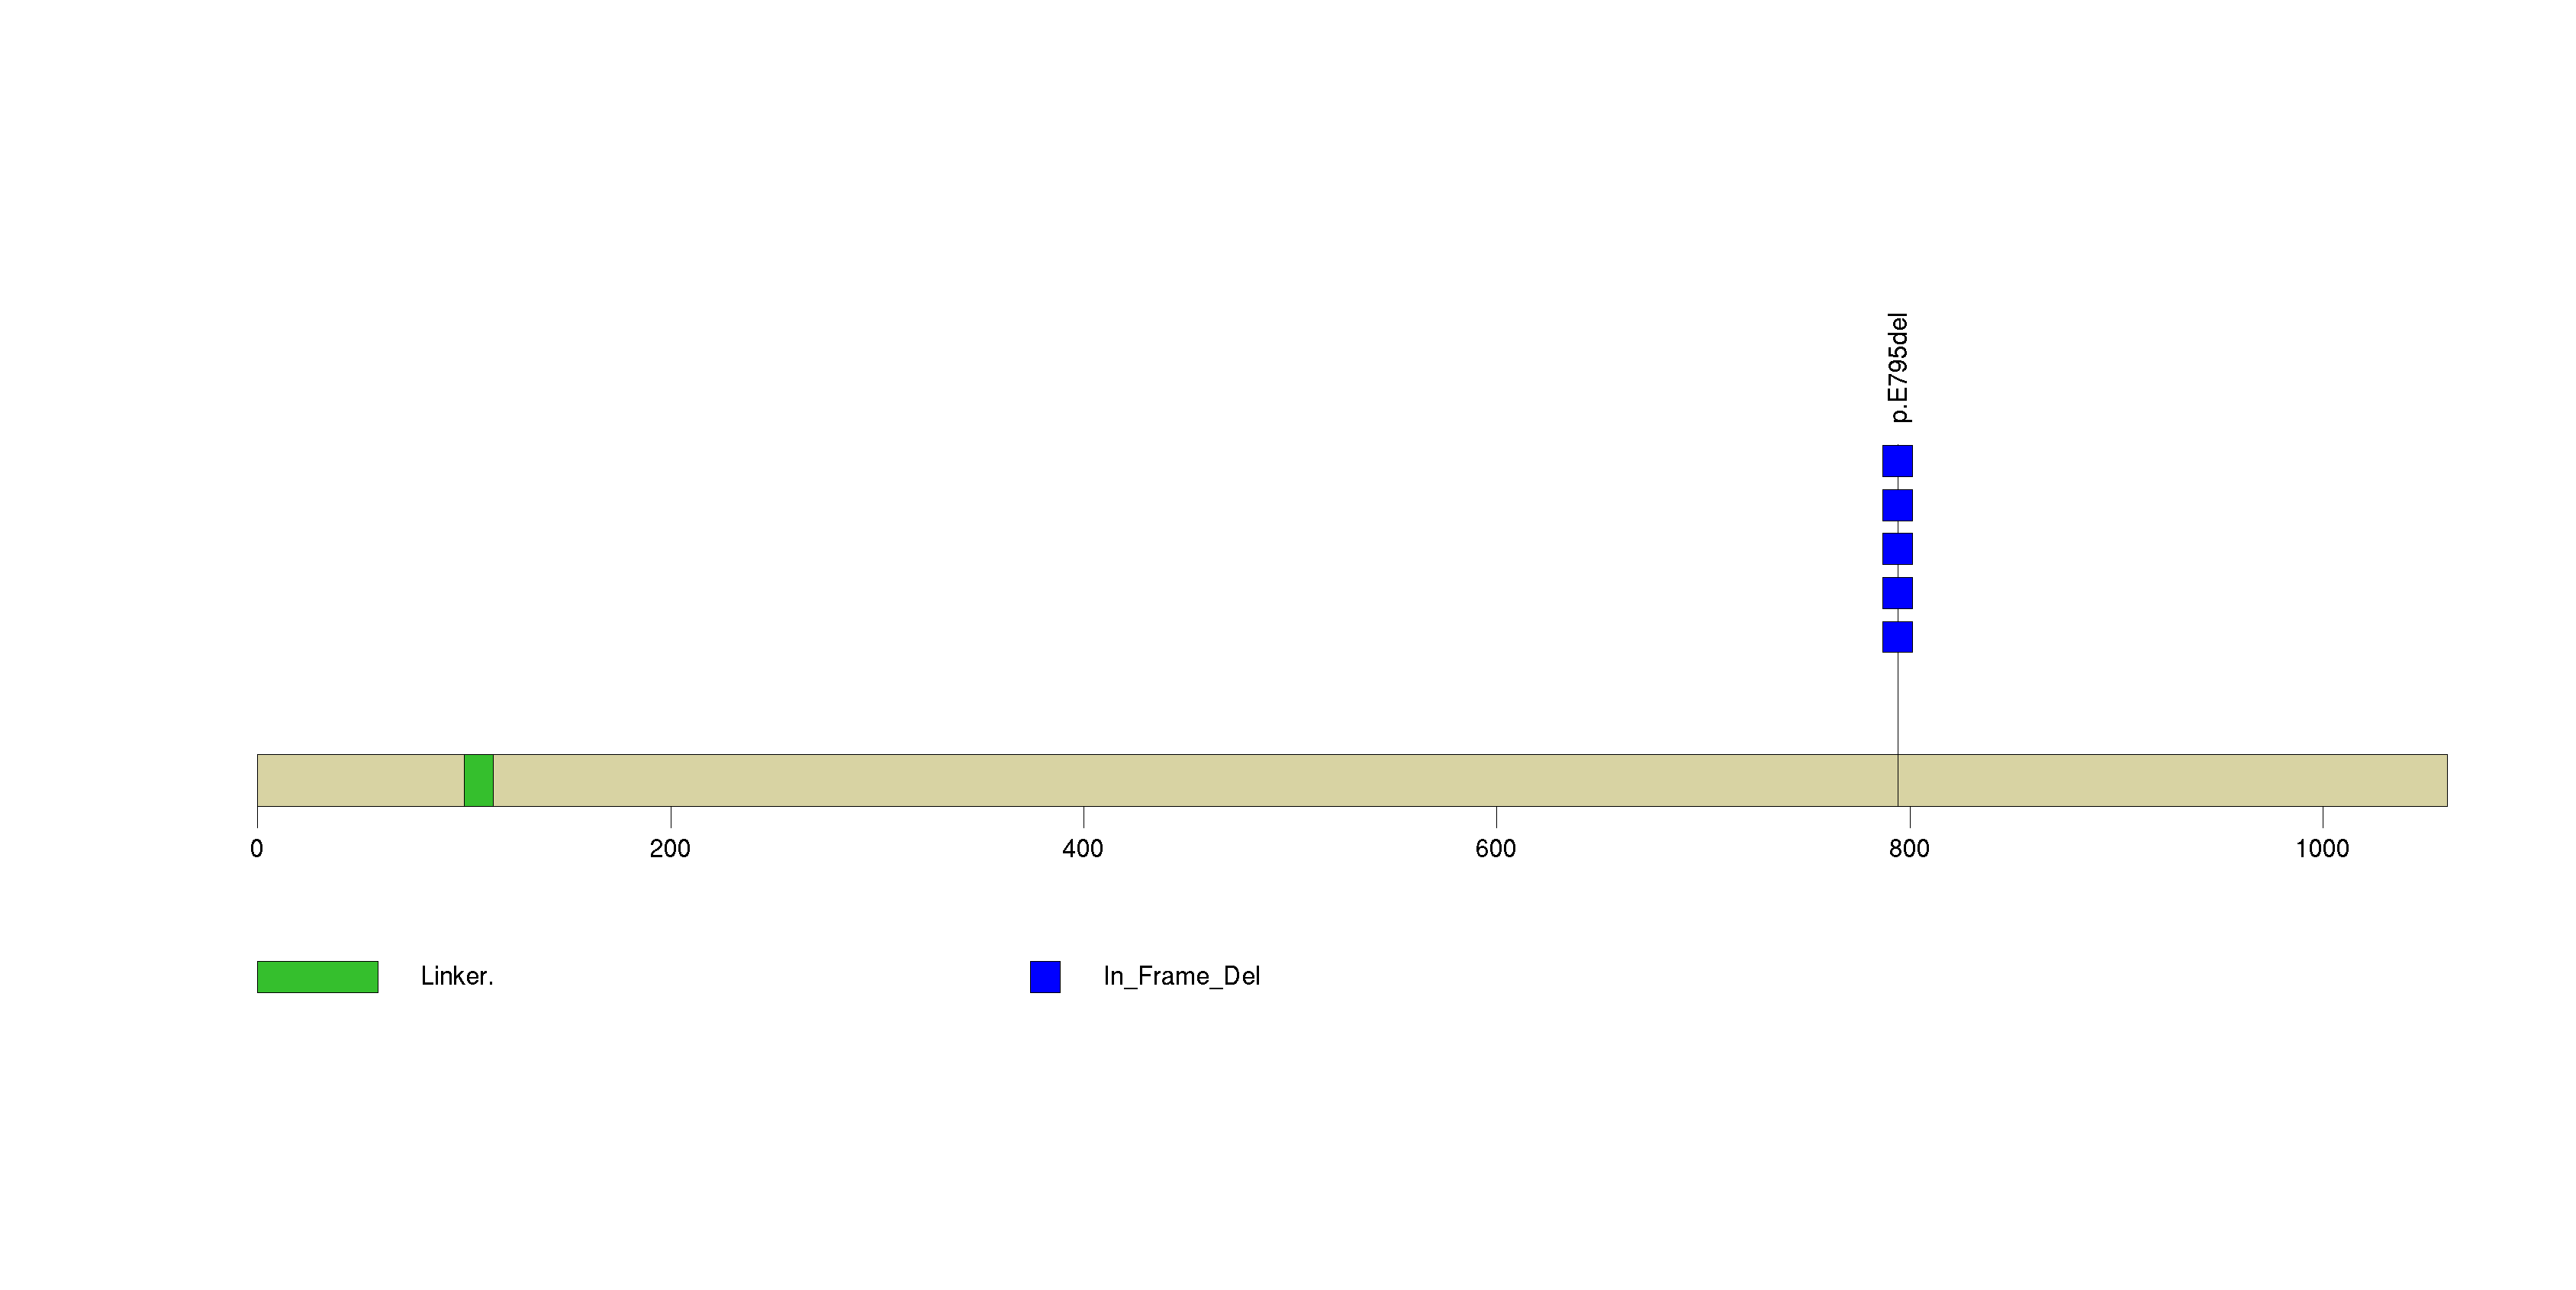
Figure S17. This figure depicts the distribution of mutations and mutation types across the THBS4 significant gene.
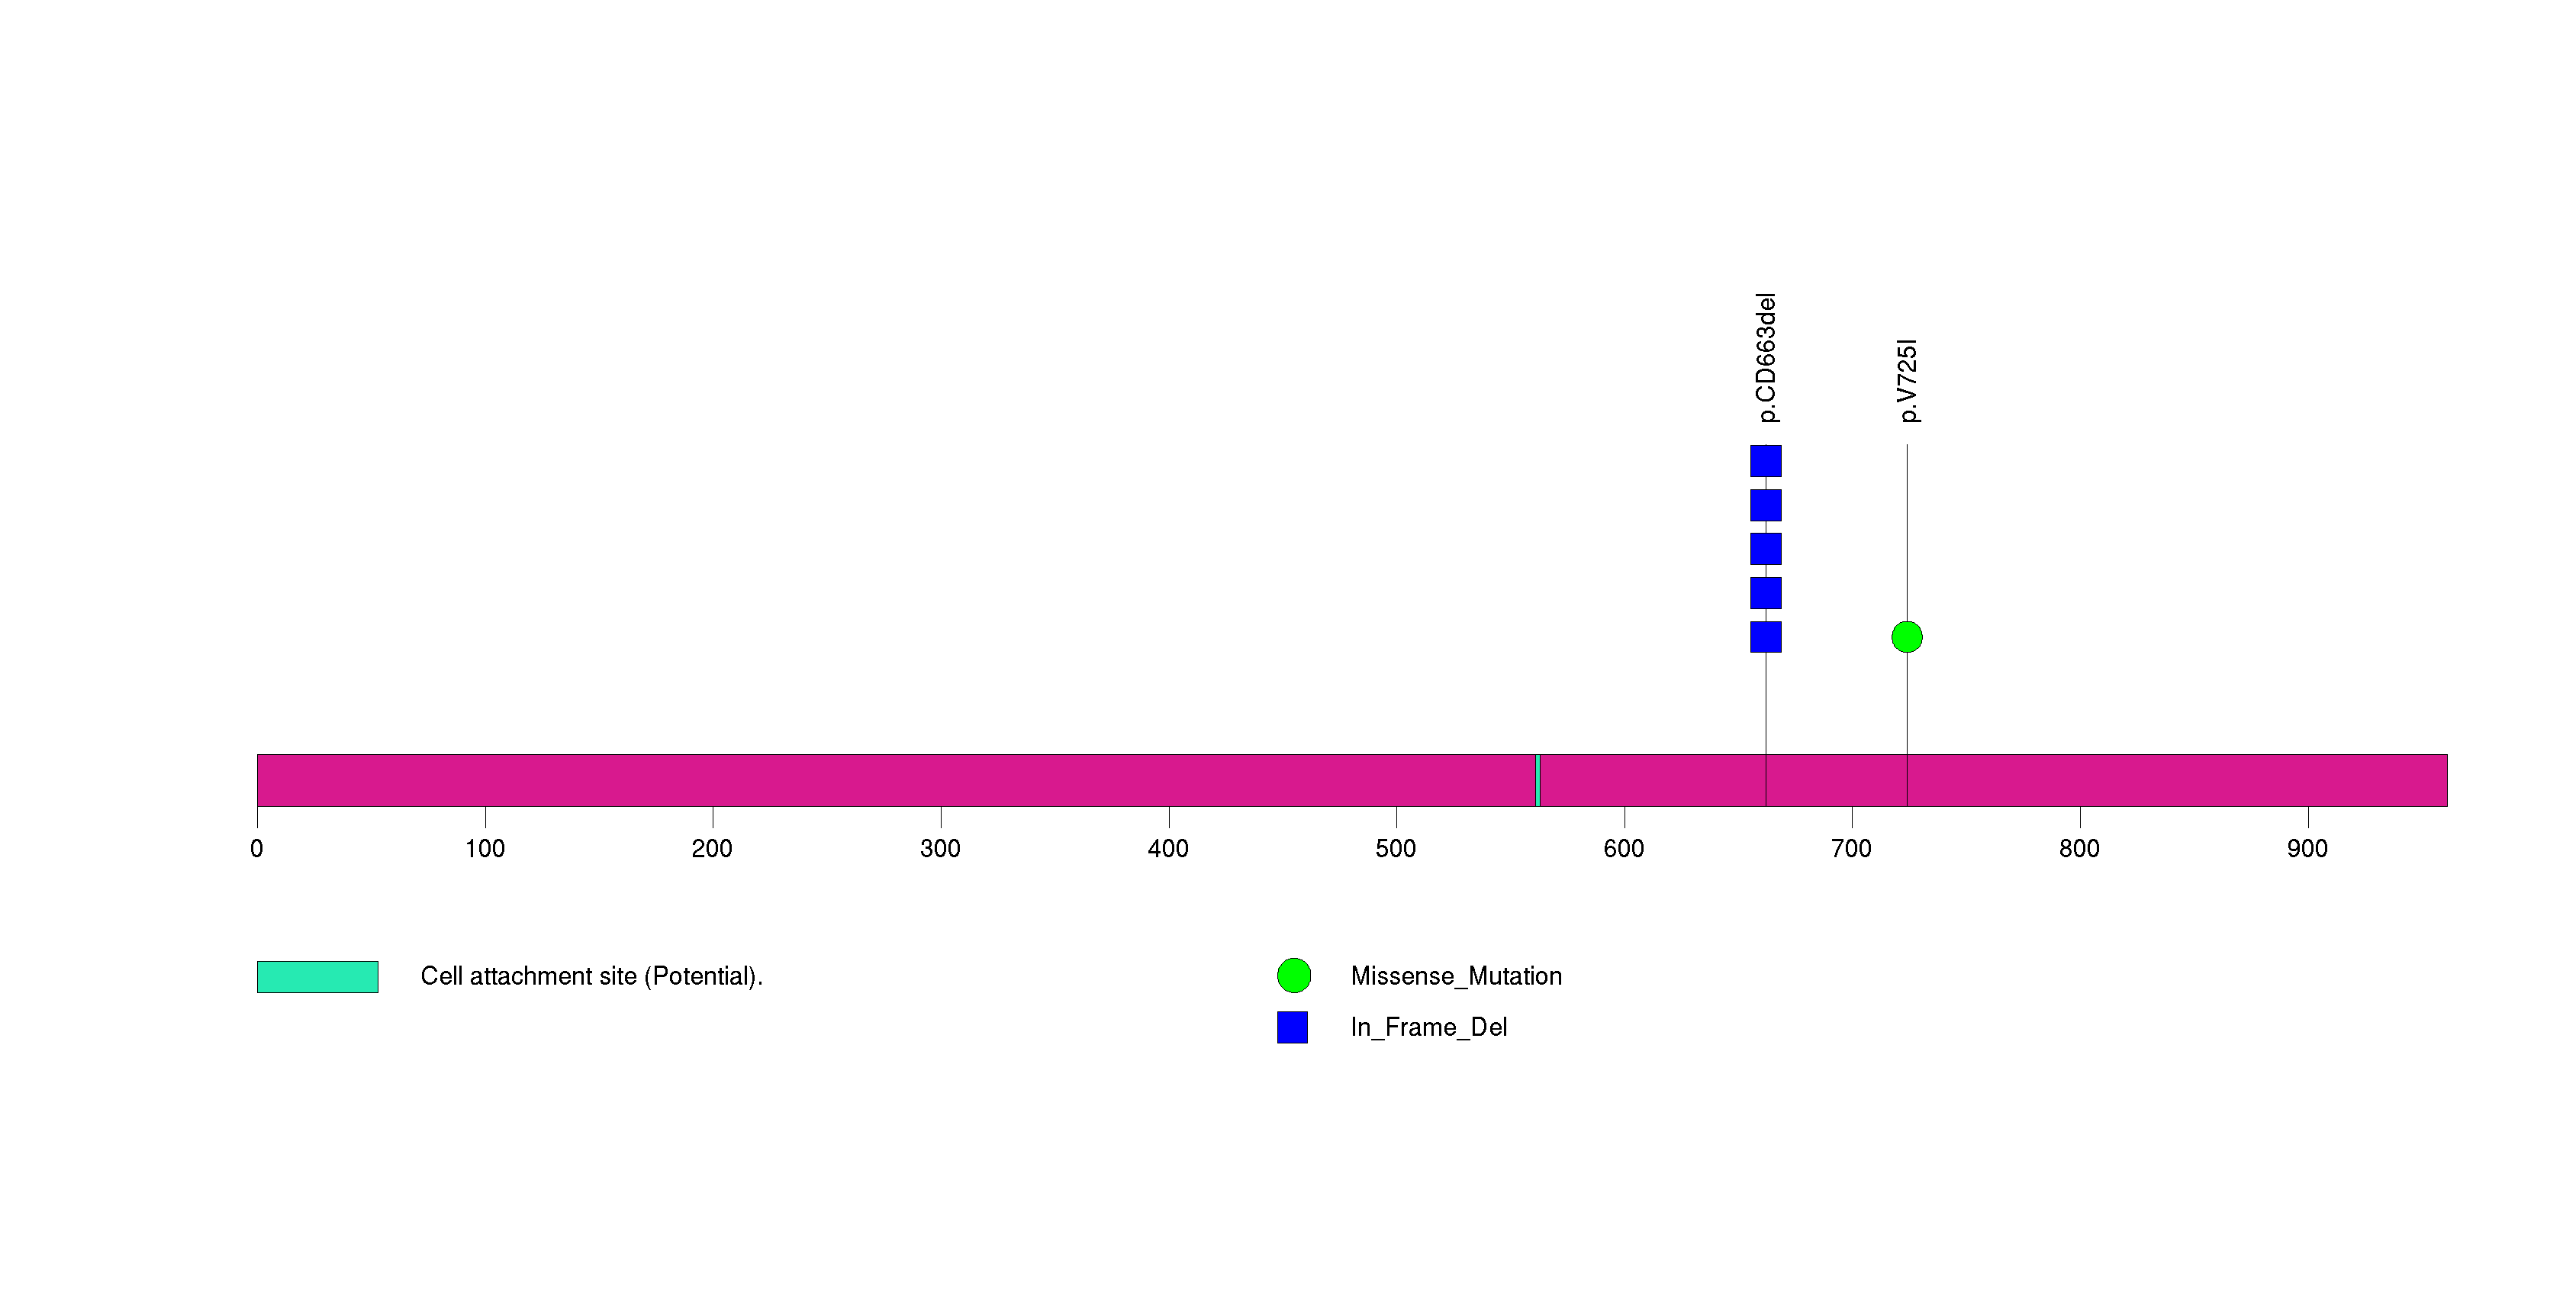
Figure S18. This figure depicts the distribution of mutations and mutation types across the SMAD4 significant gene.
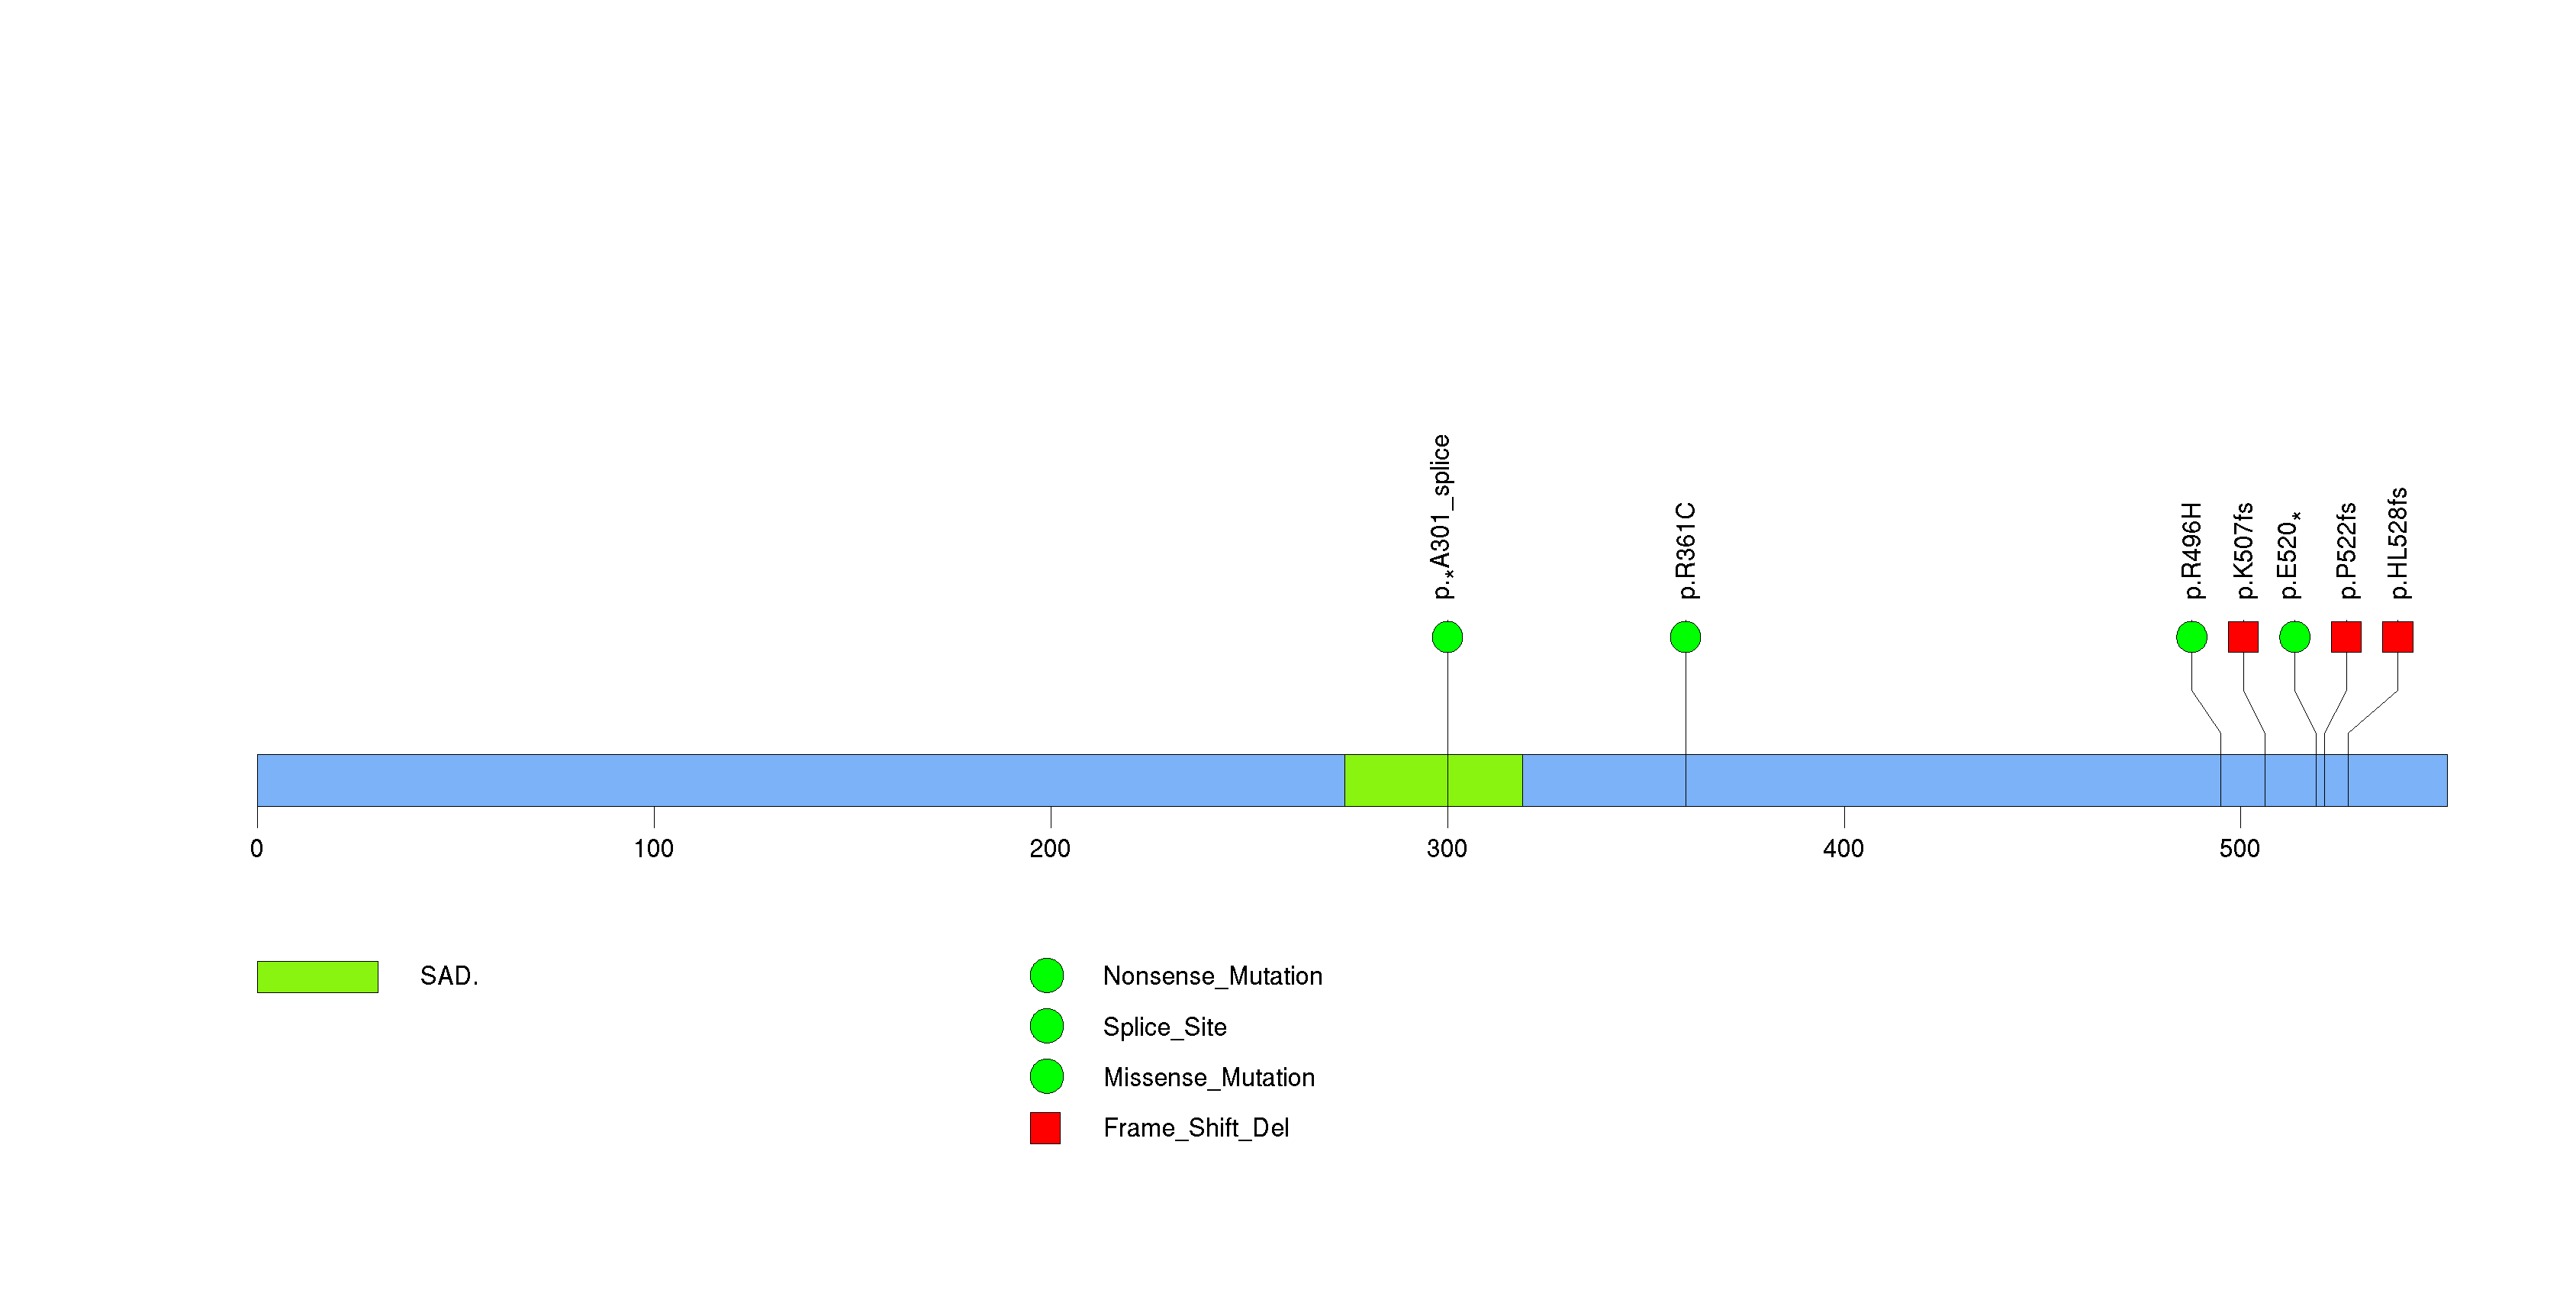
Figure S19. This figure depicts the distribution of mutations and mutation types across the PTPRF significant gene.
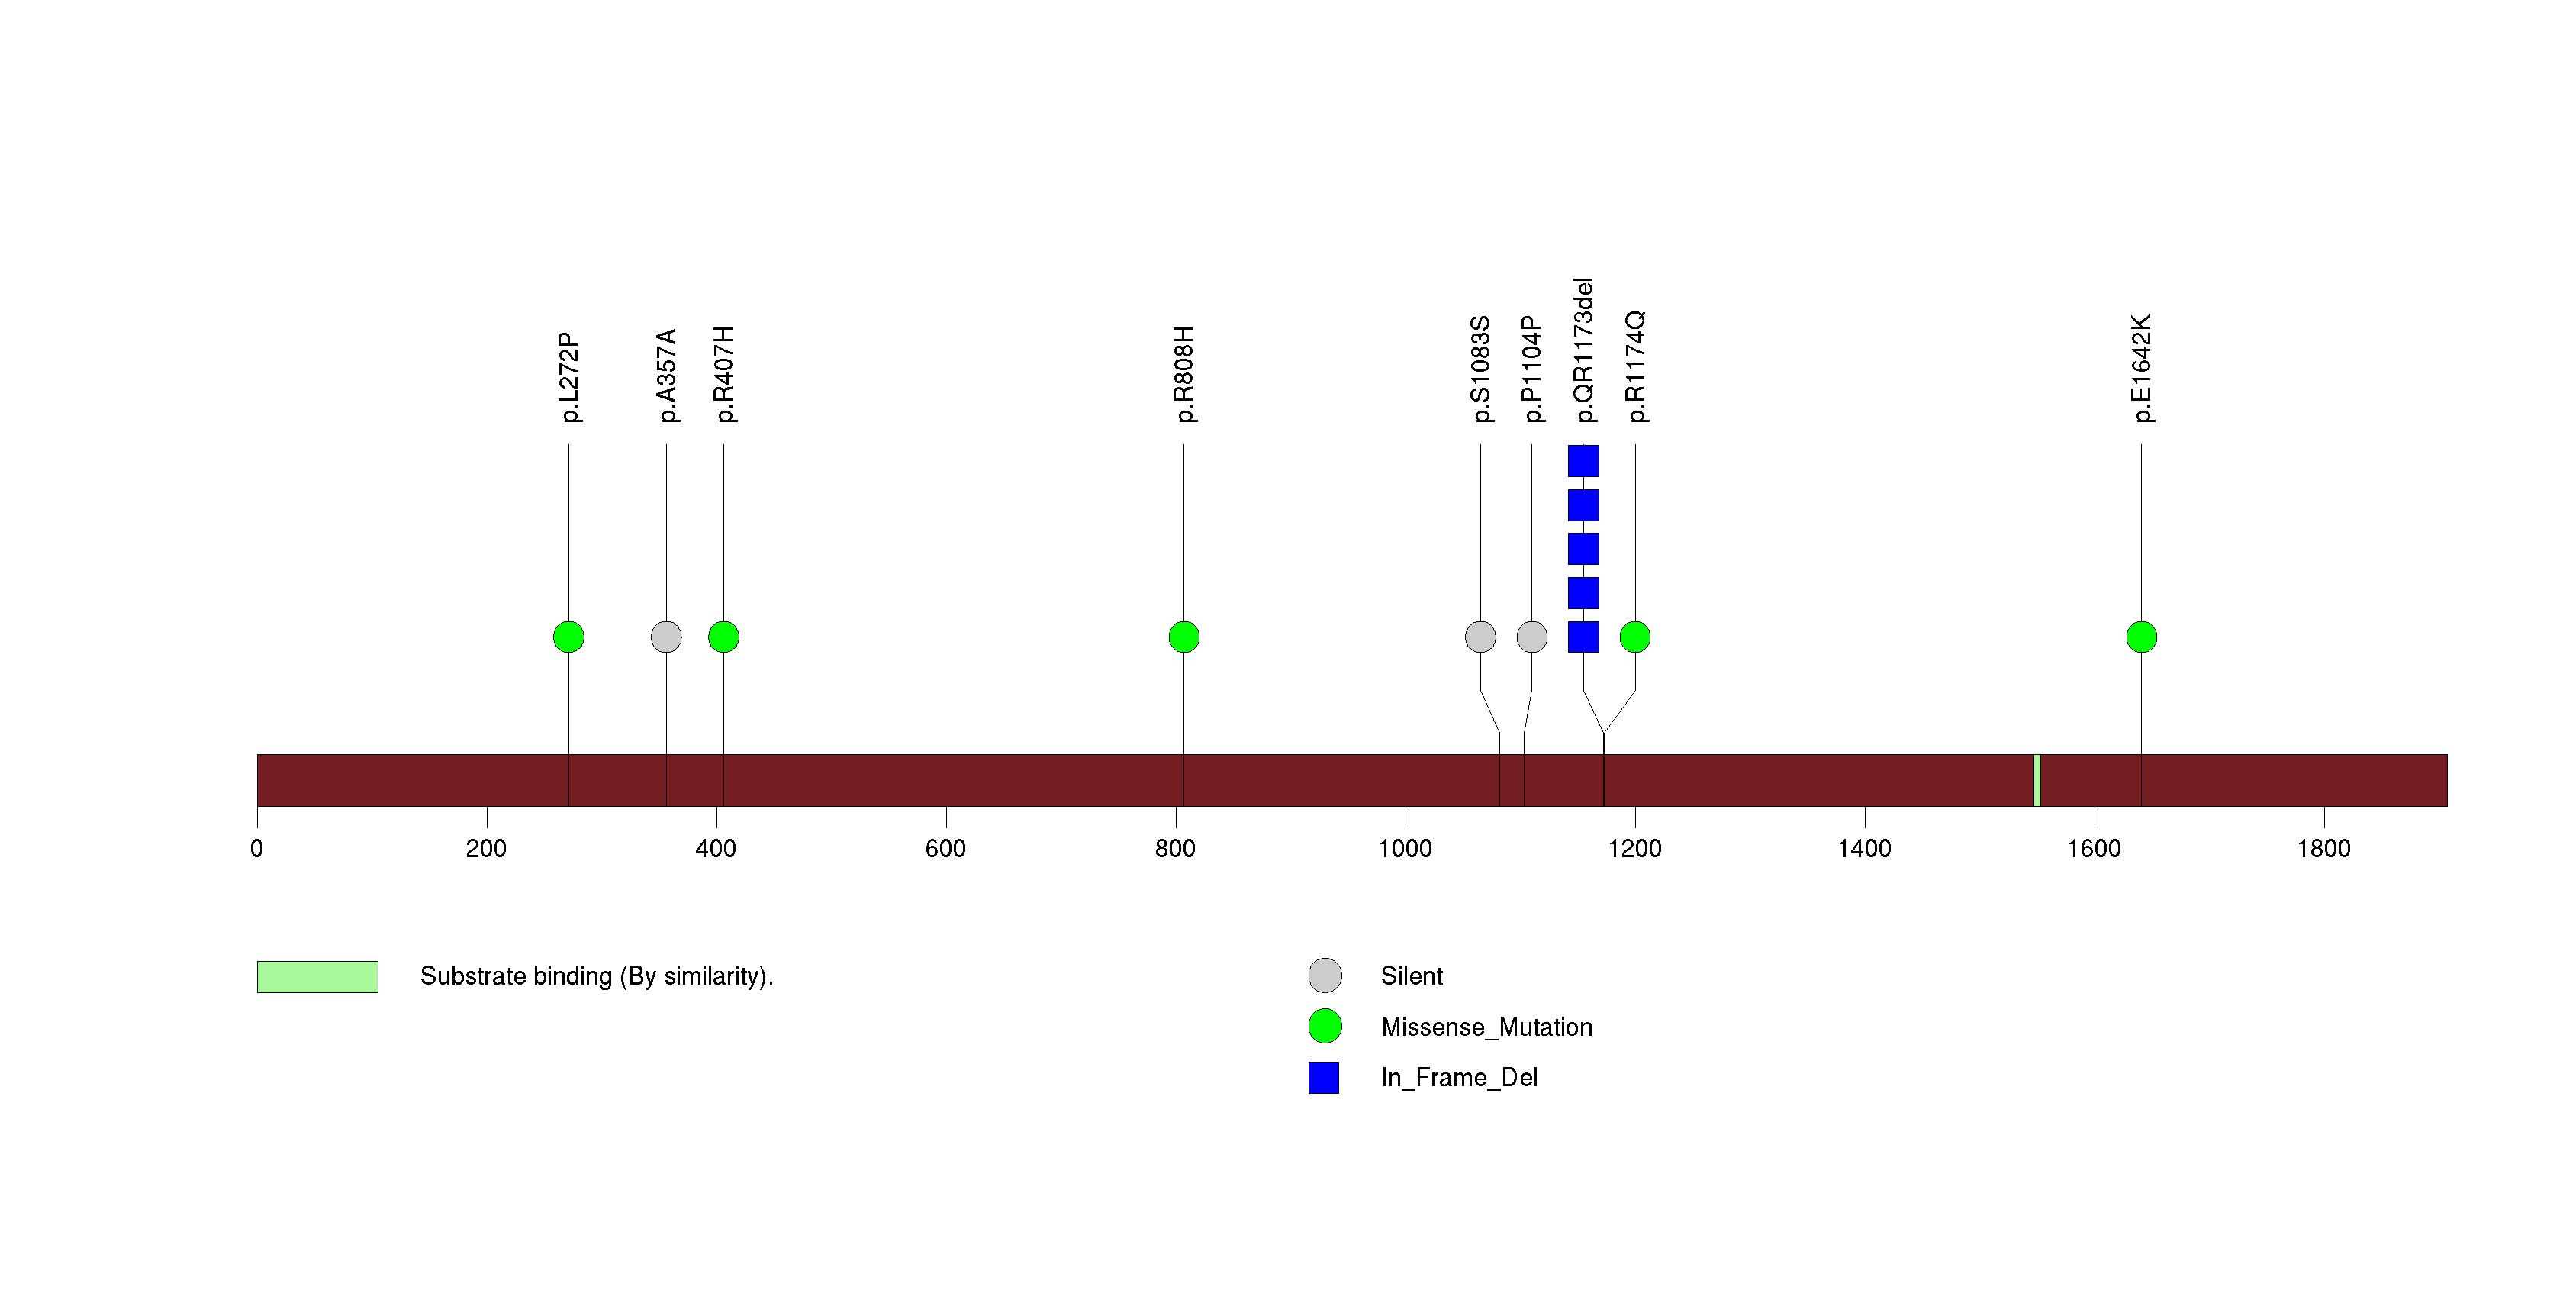
Figure S20. This figure depicts the distribution of mutations and mutation types across the MED12 significant gene.
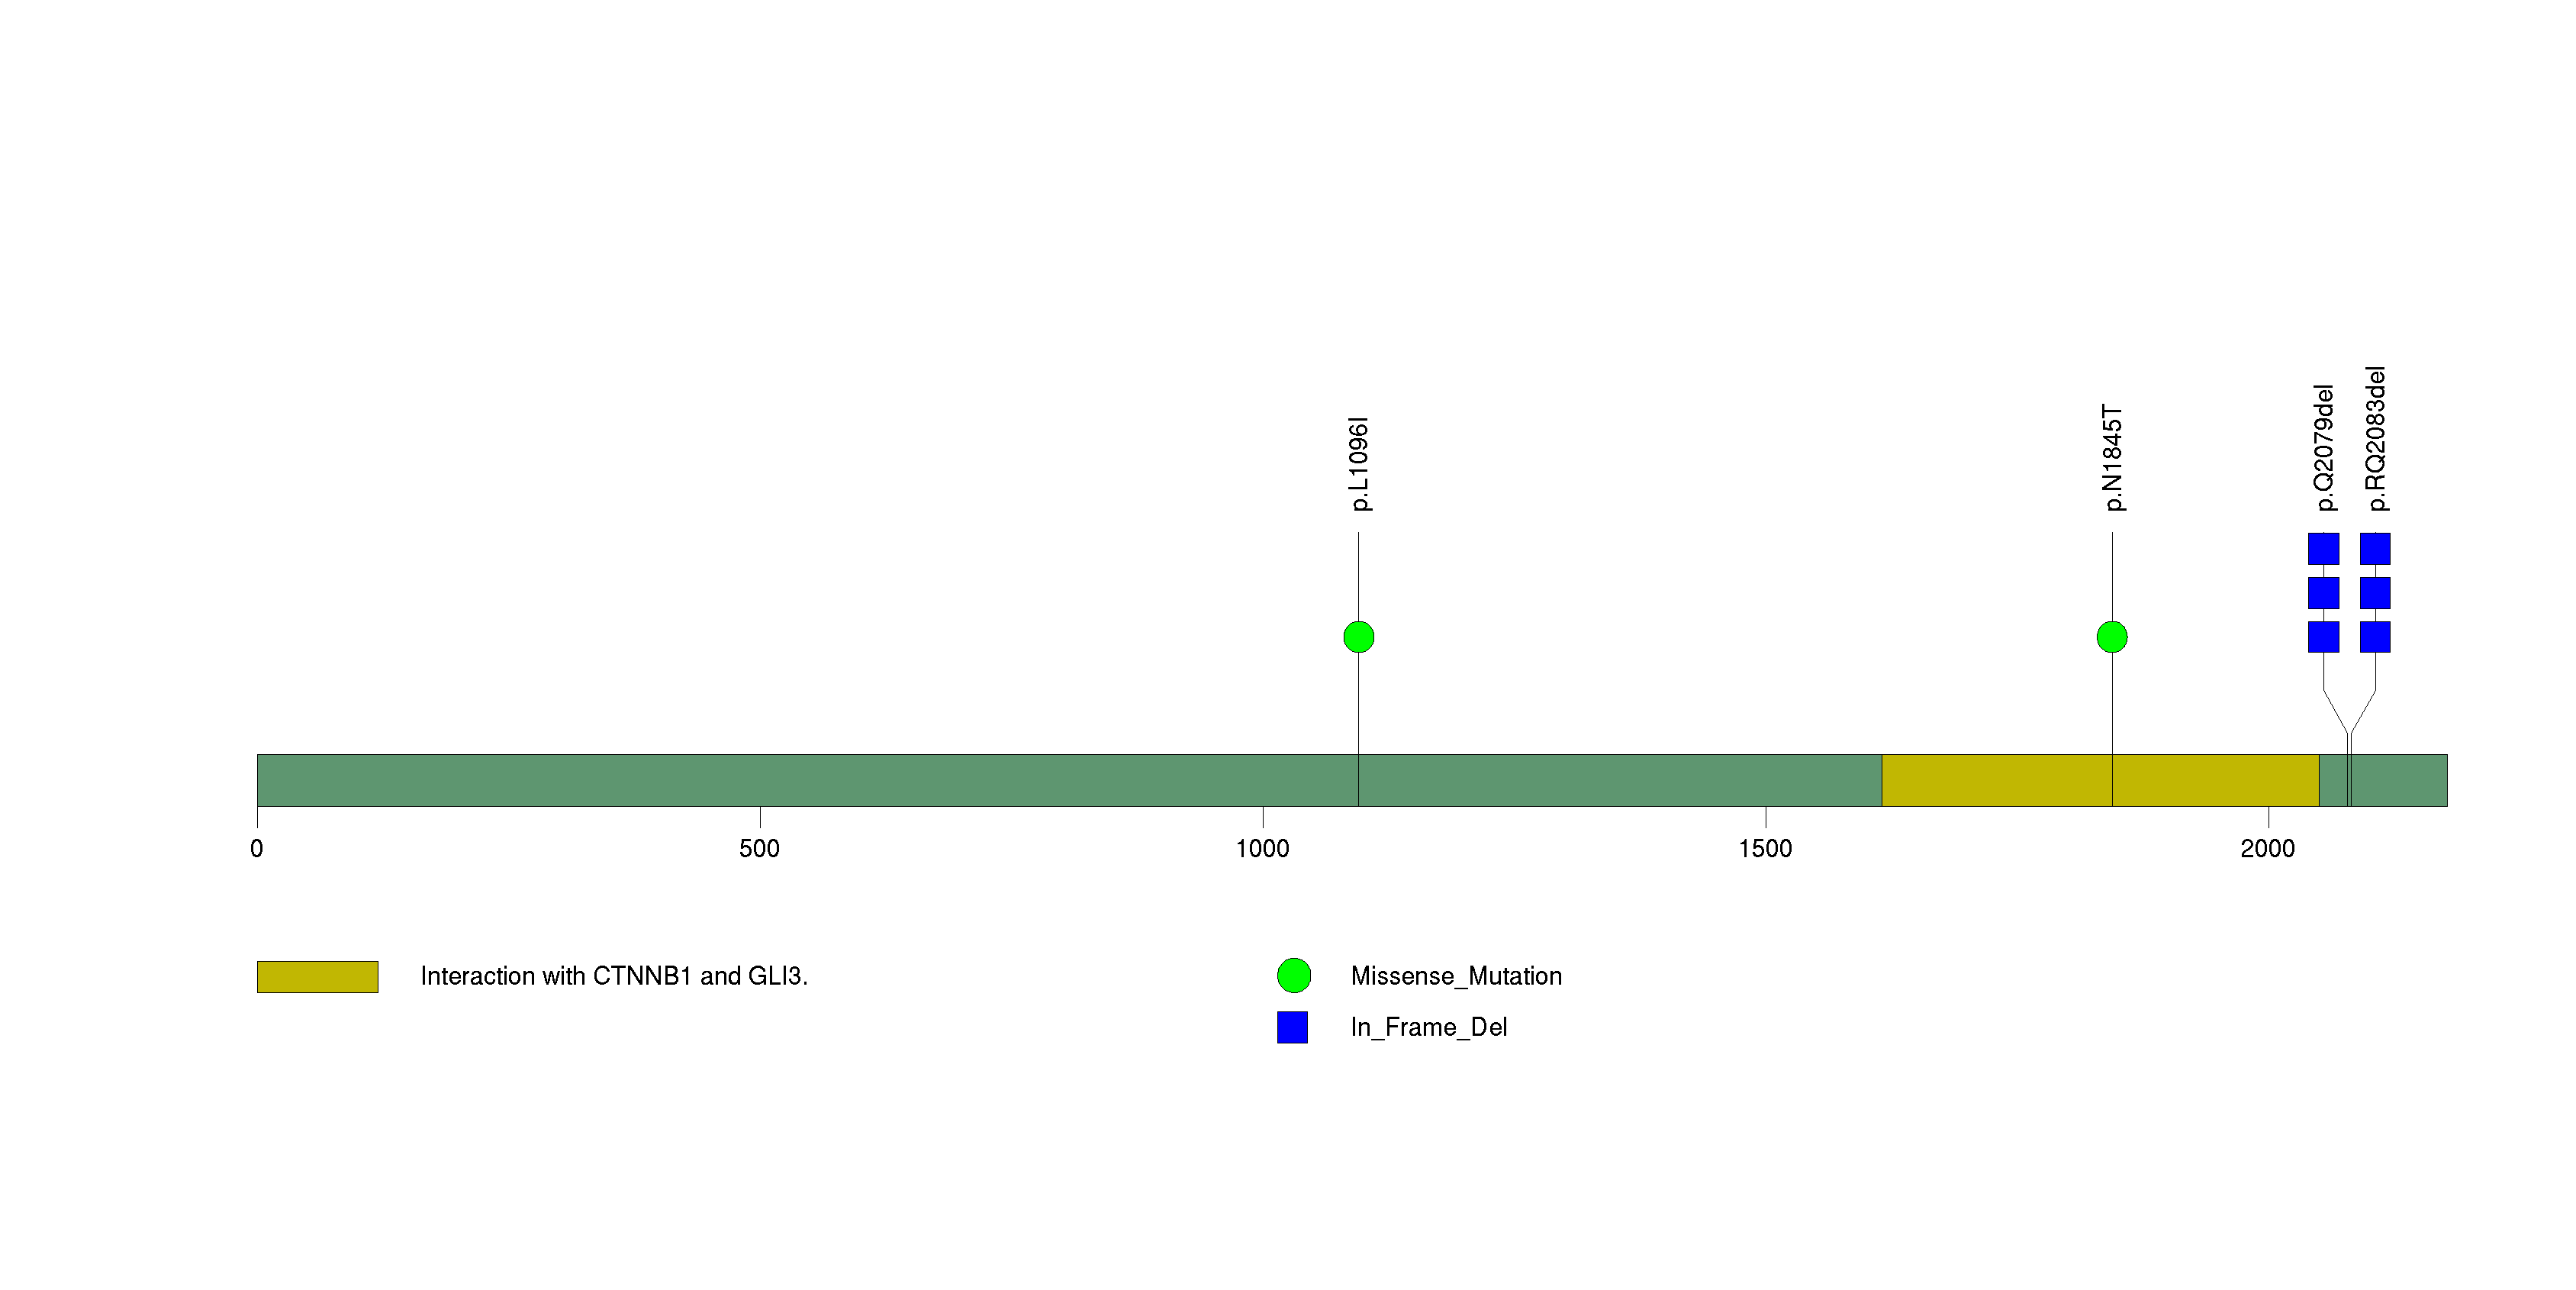
Figure S21. This figure depicts the distribution of mutations and mutation types across the BMP2K significant gene.
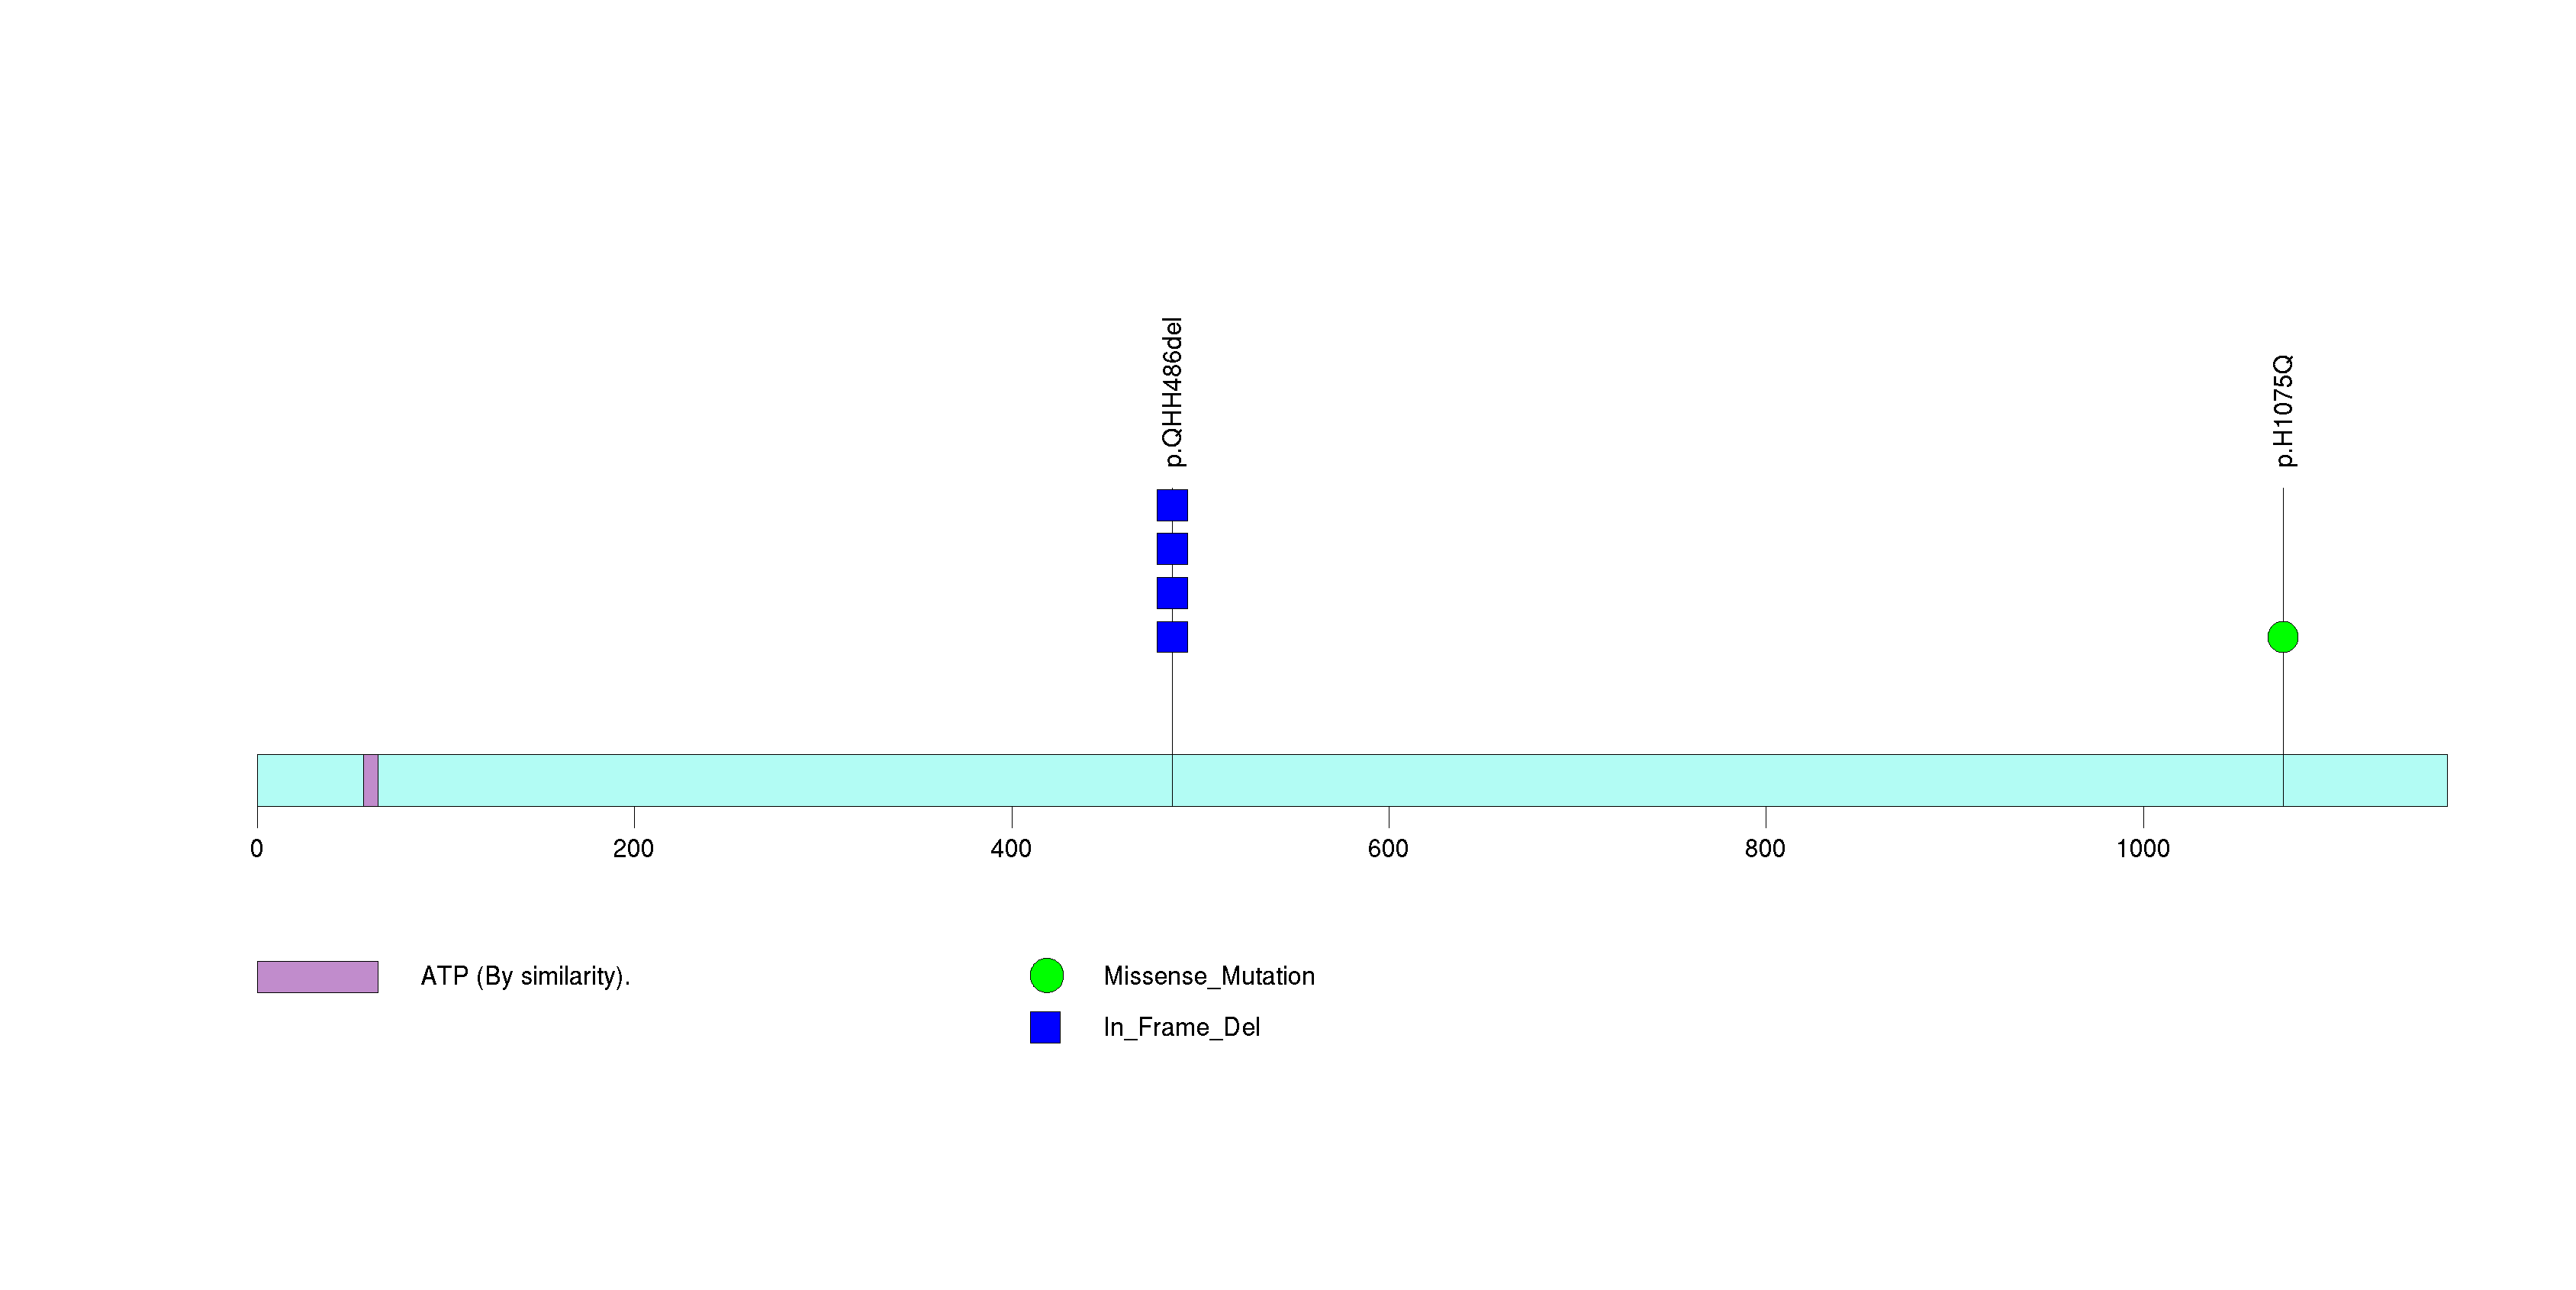
Figure S22. This figure depicts the distribution of mutations and mutation types across the ZMYM5 significant gene.
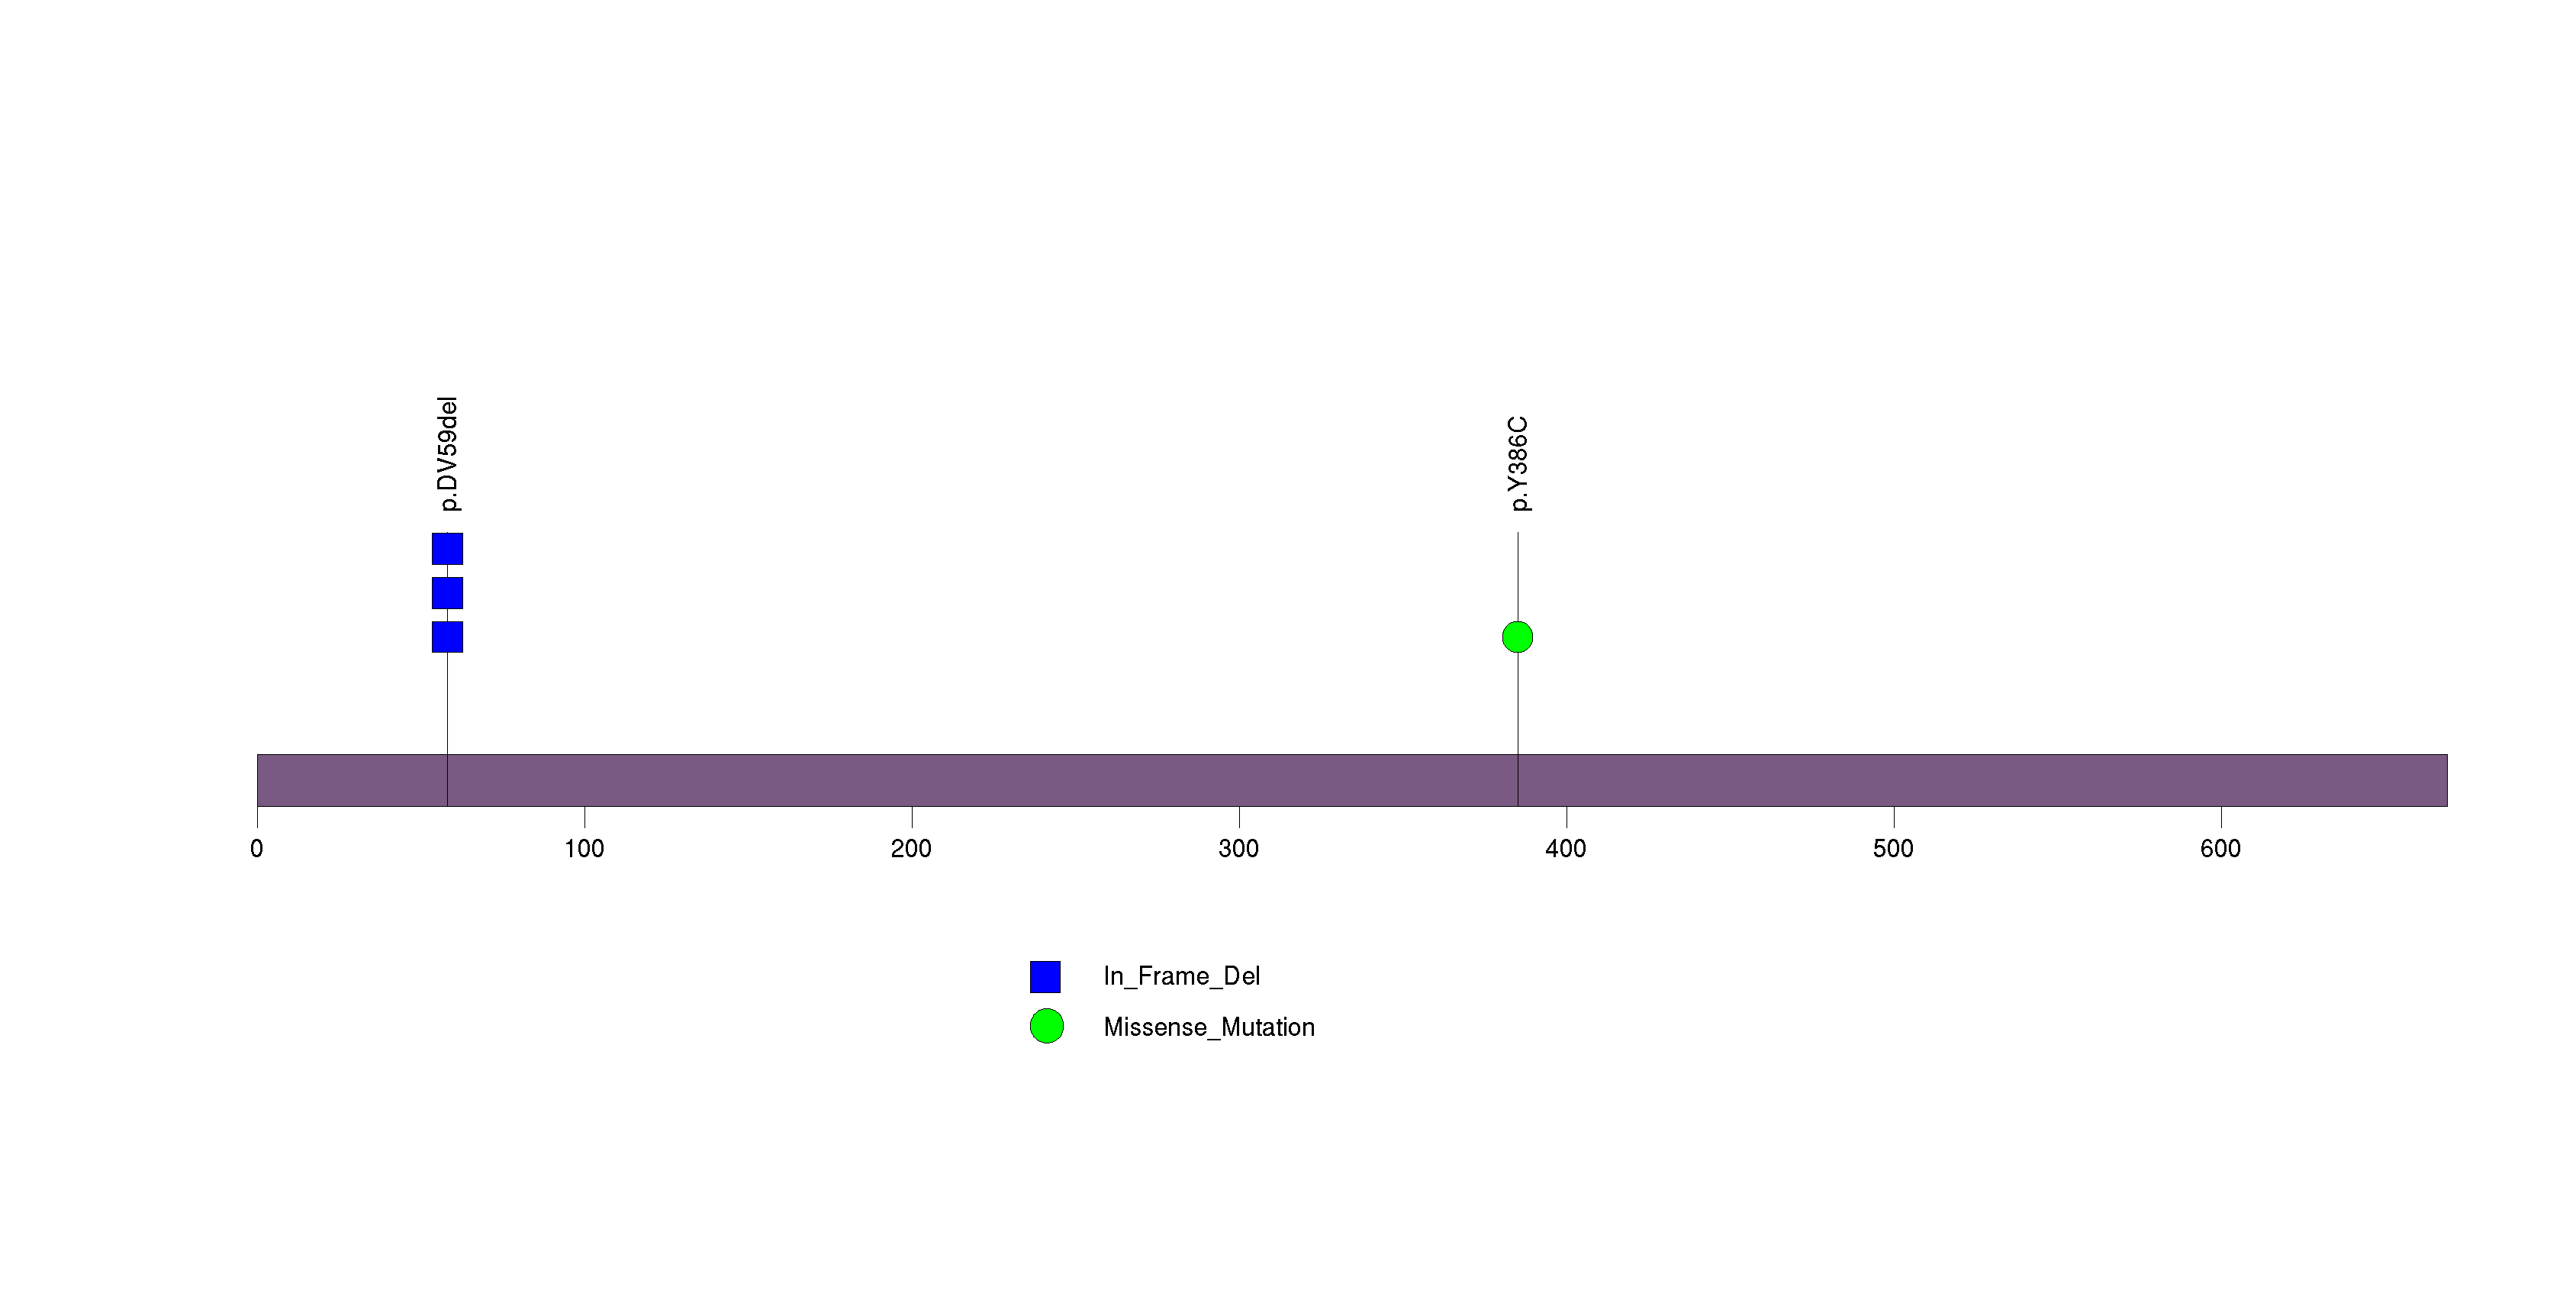
Figure S23. This figure depicts the distribution of mutations and mutation types across the SYT15 significant gene.
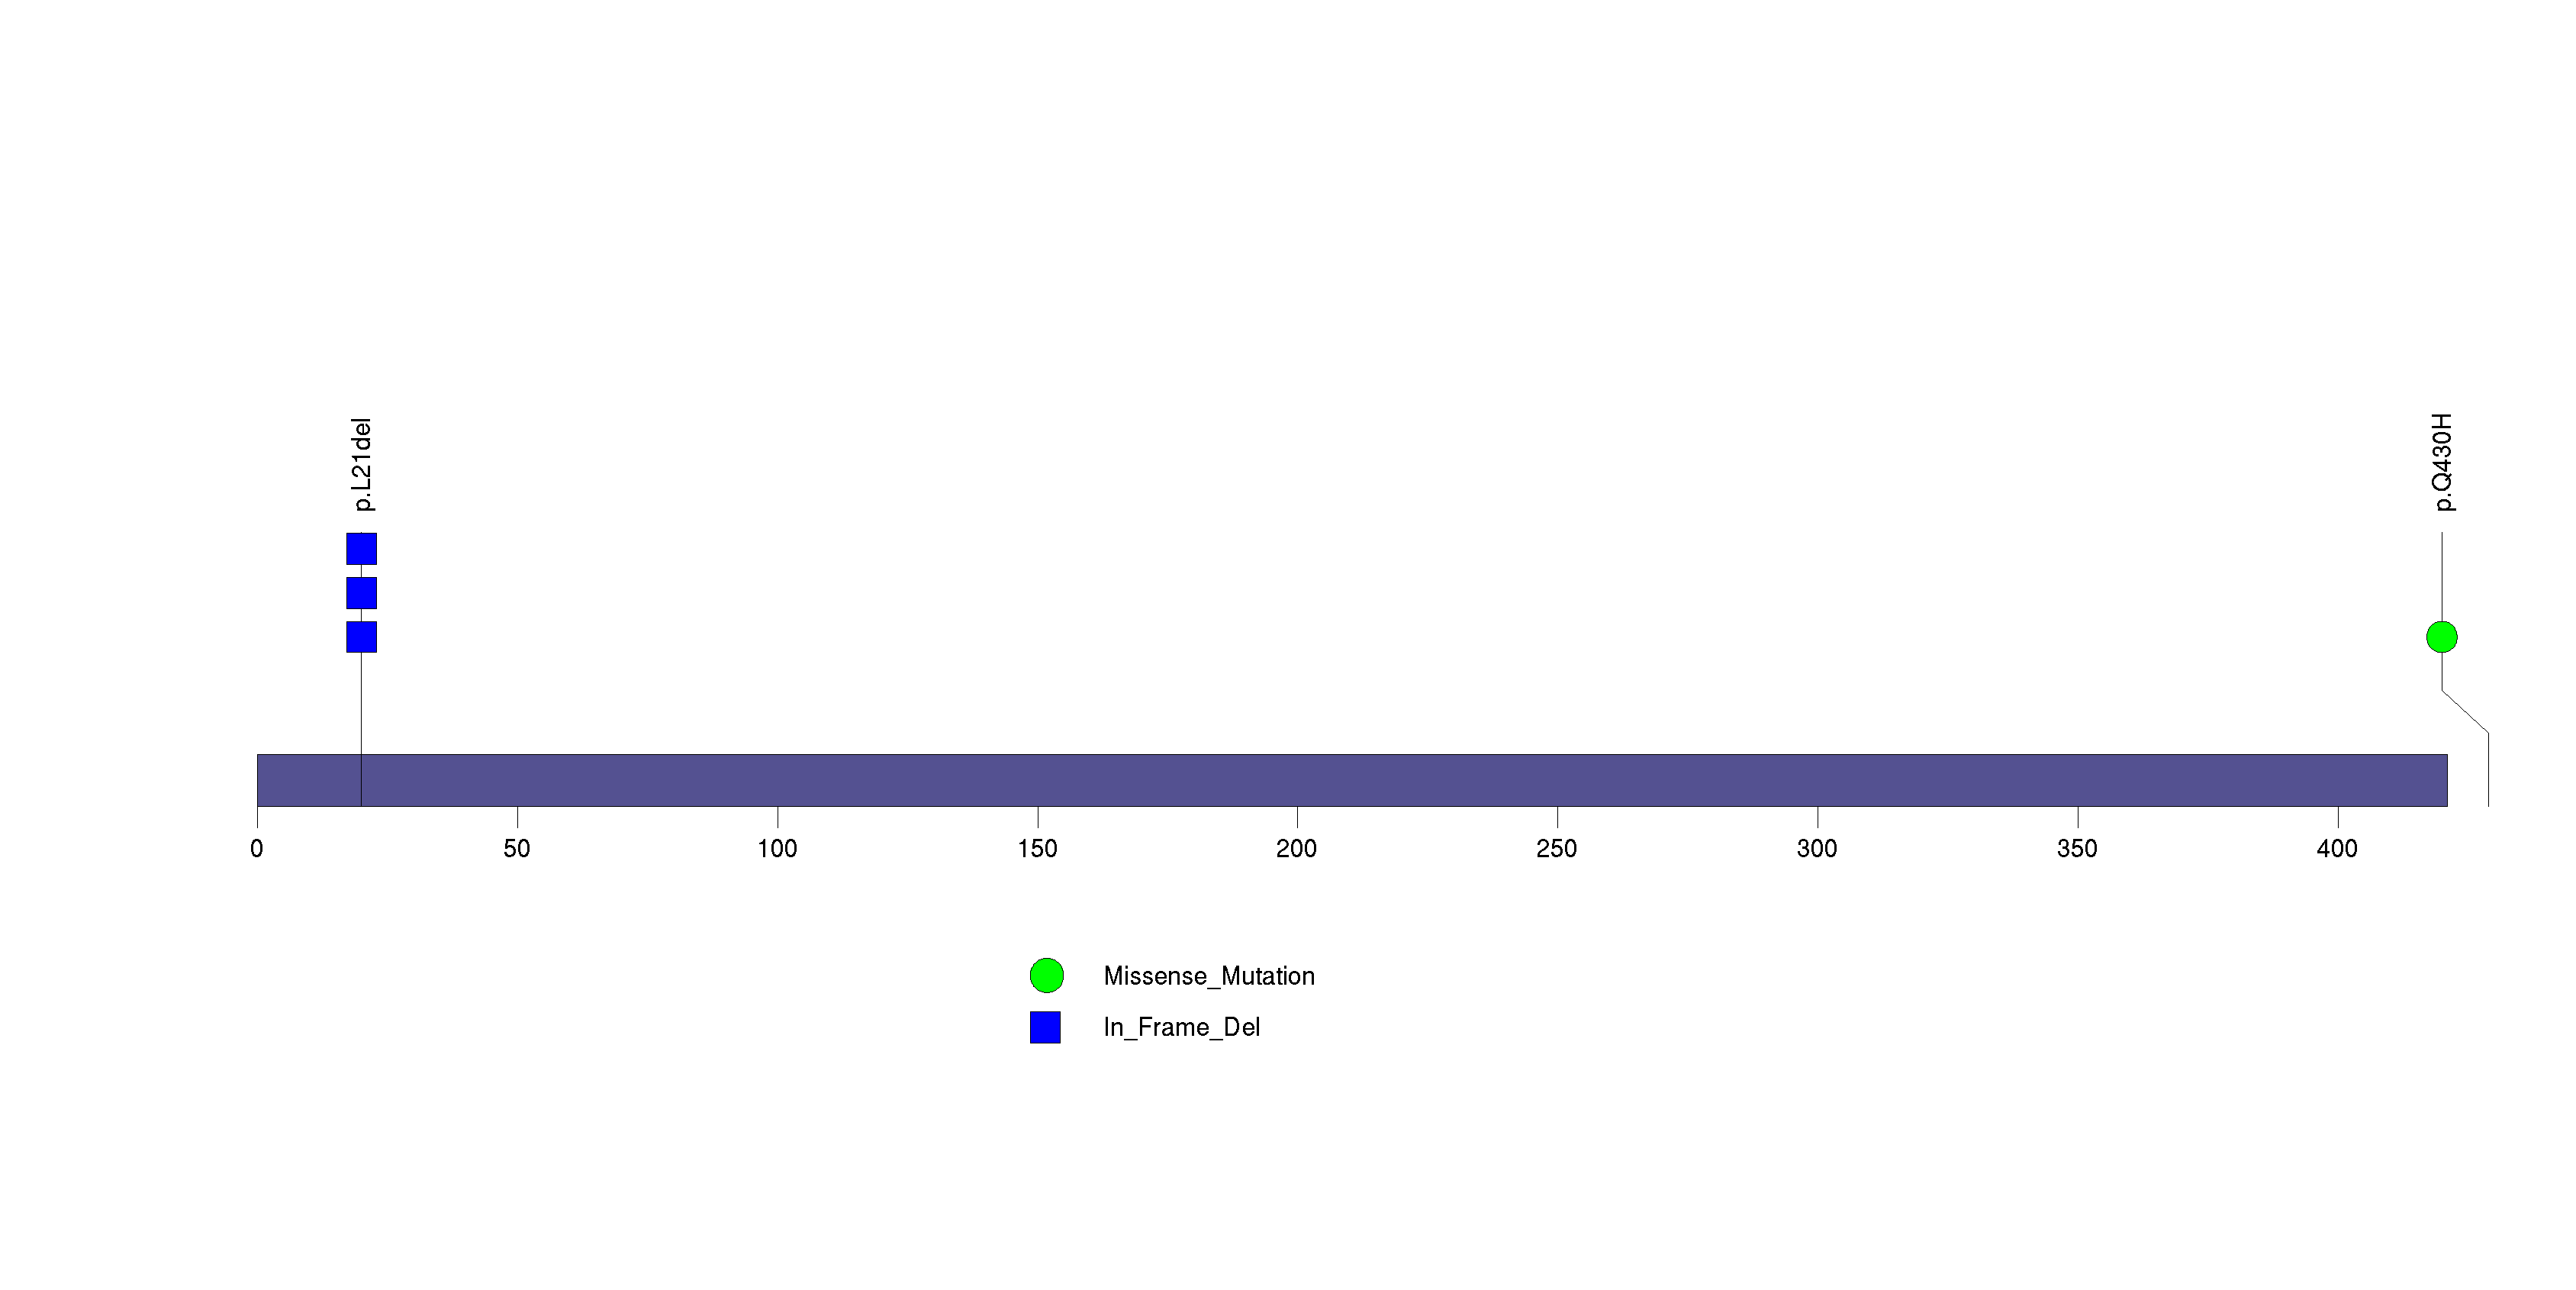
Figure S24. This figure depicts the distribution of mutations and mutation types across the PLAU significant gene.
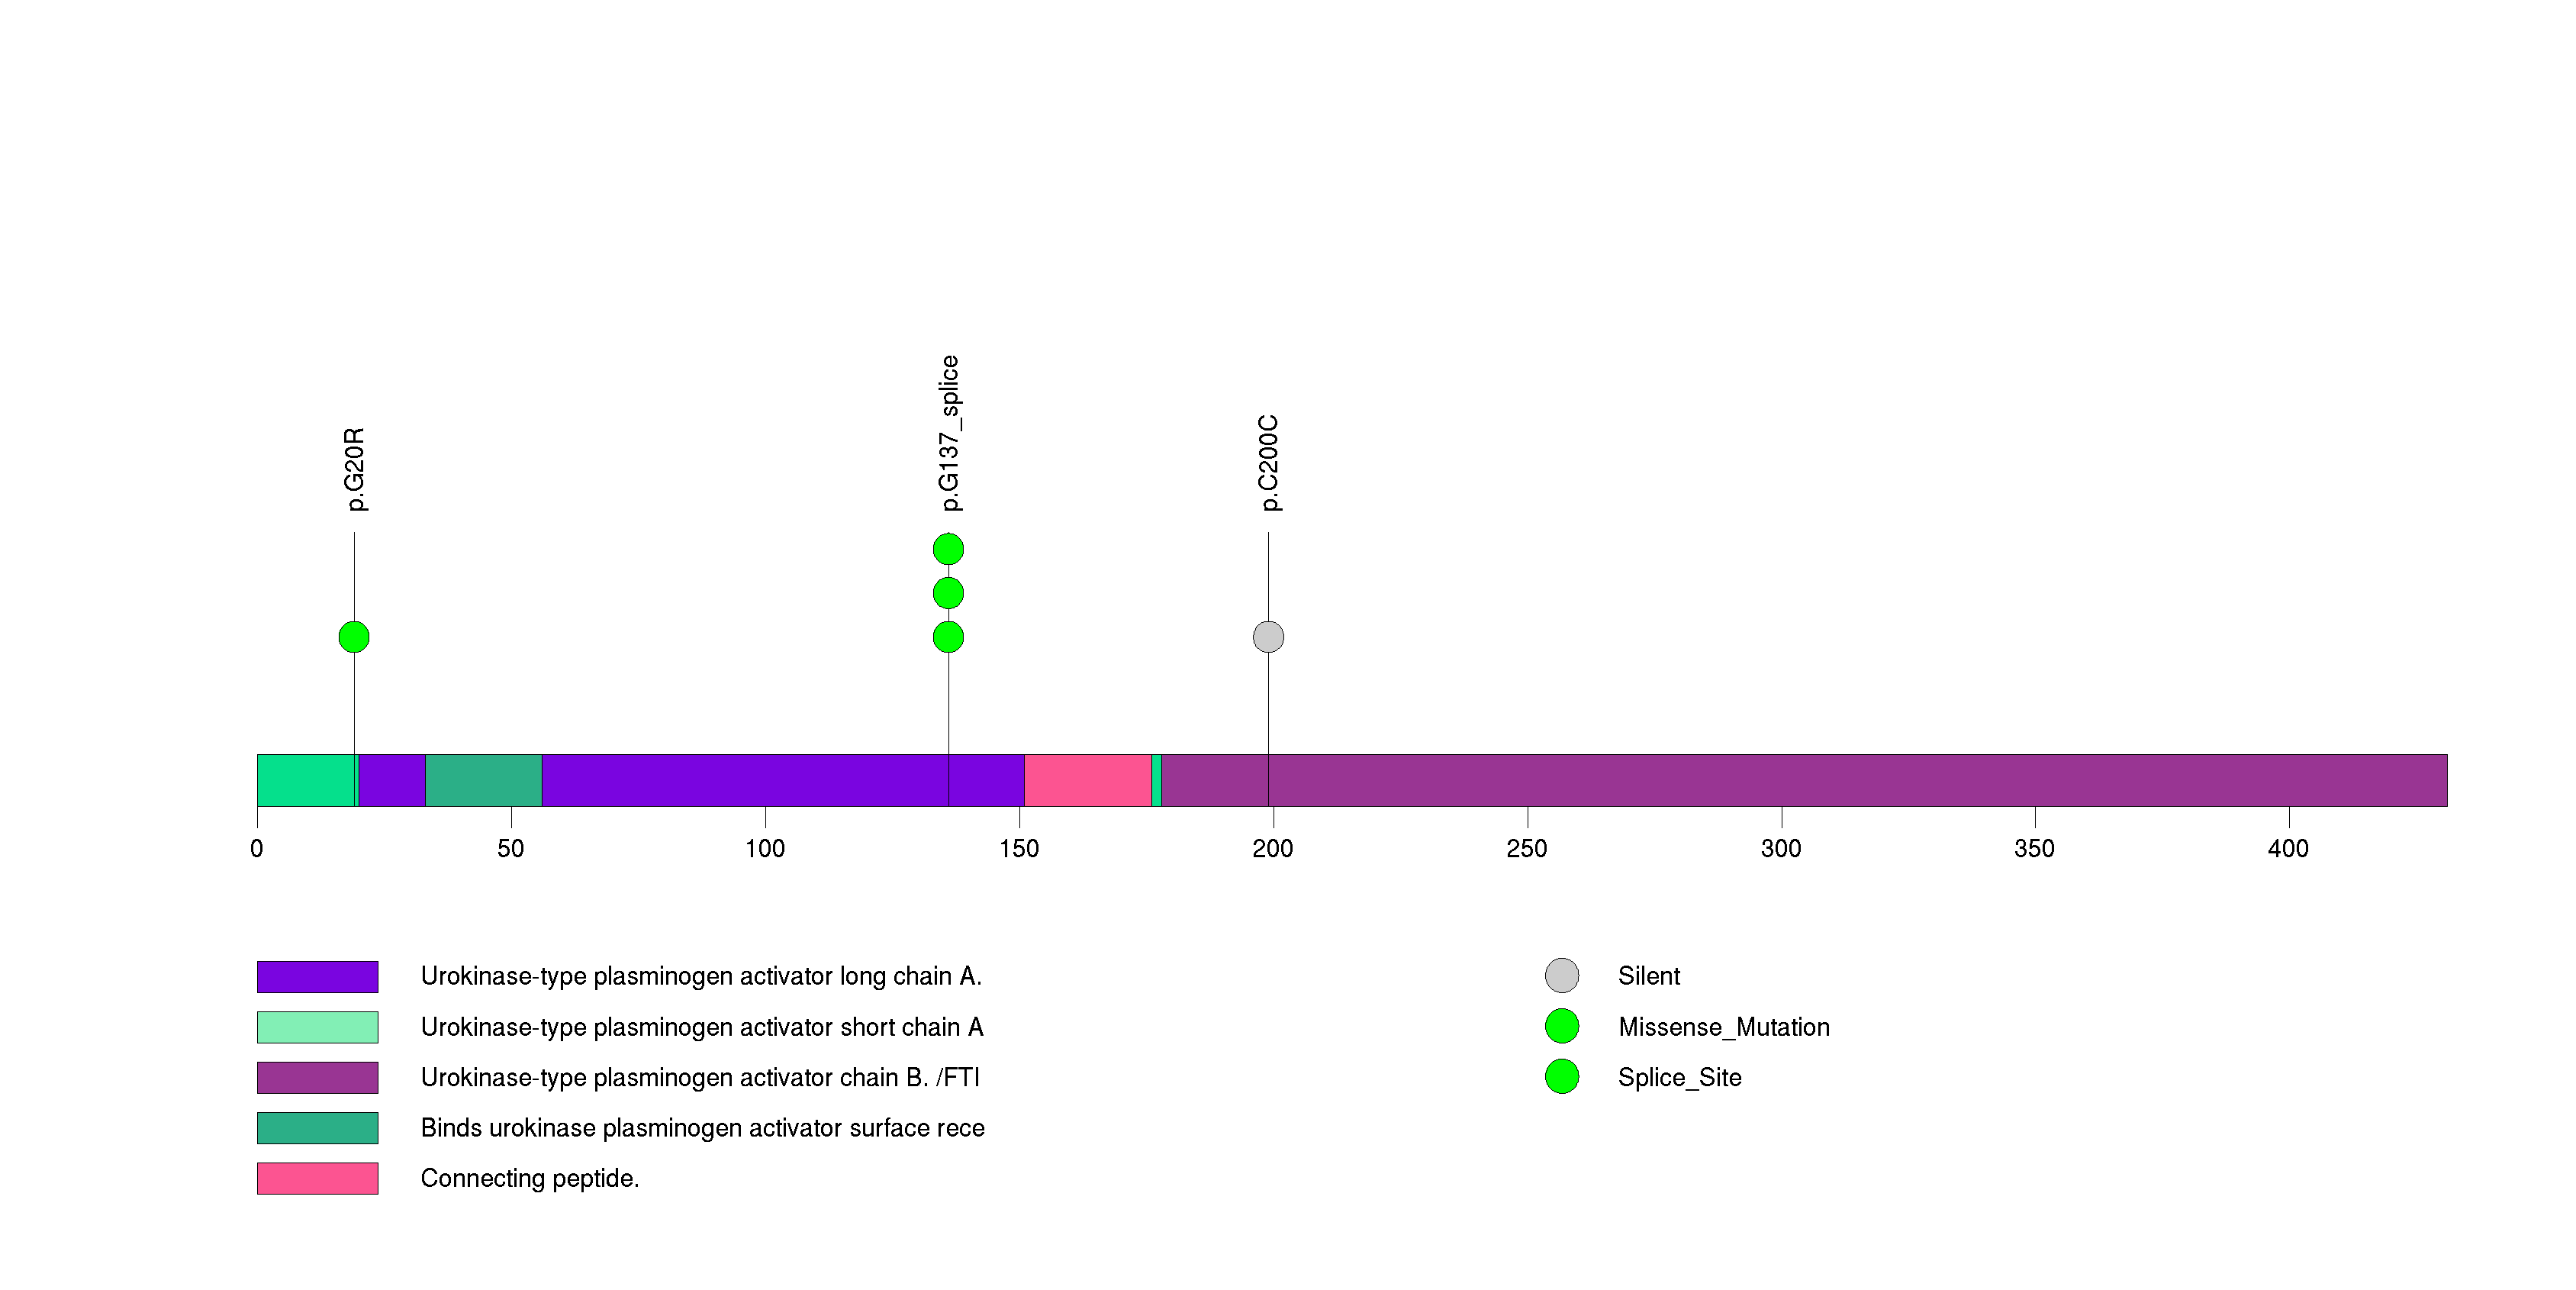
Figure S25. This figure depicts the distribution of mutations and mutation types across the MEPCE significant gene.
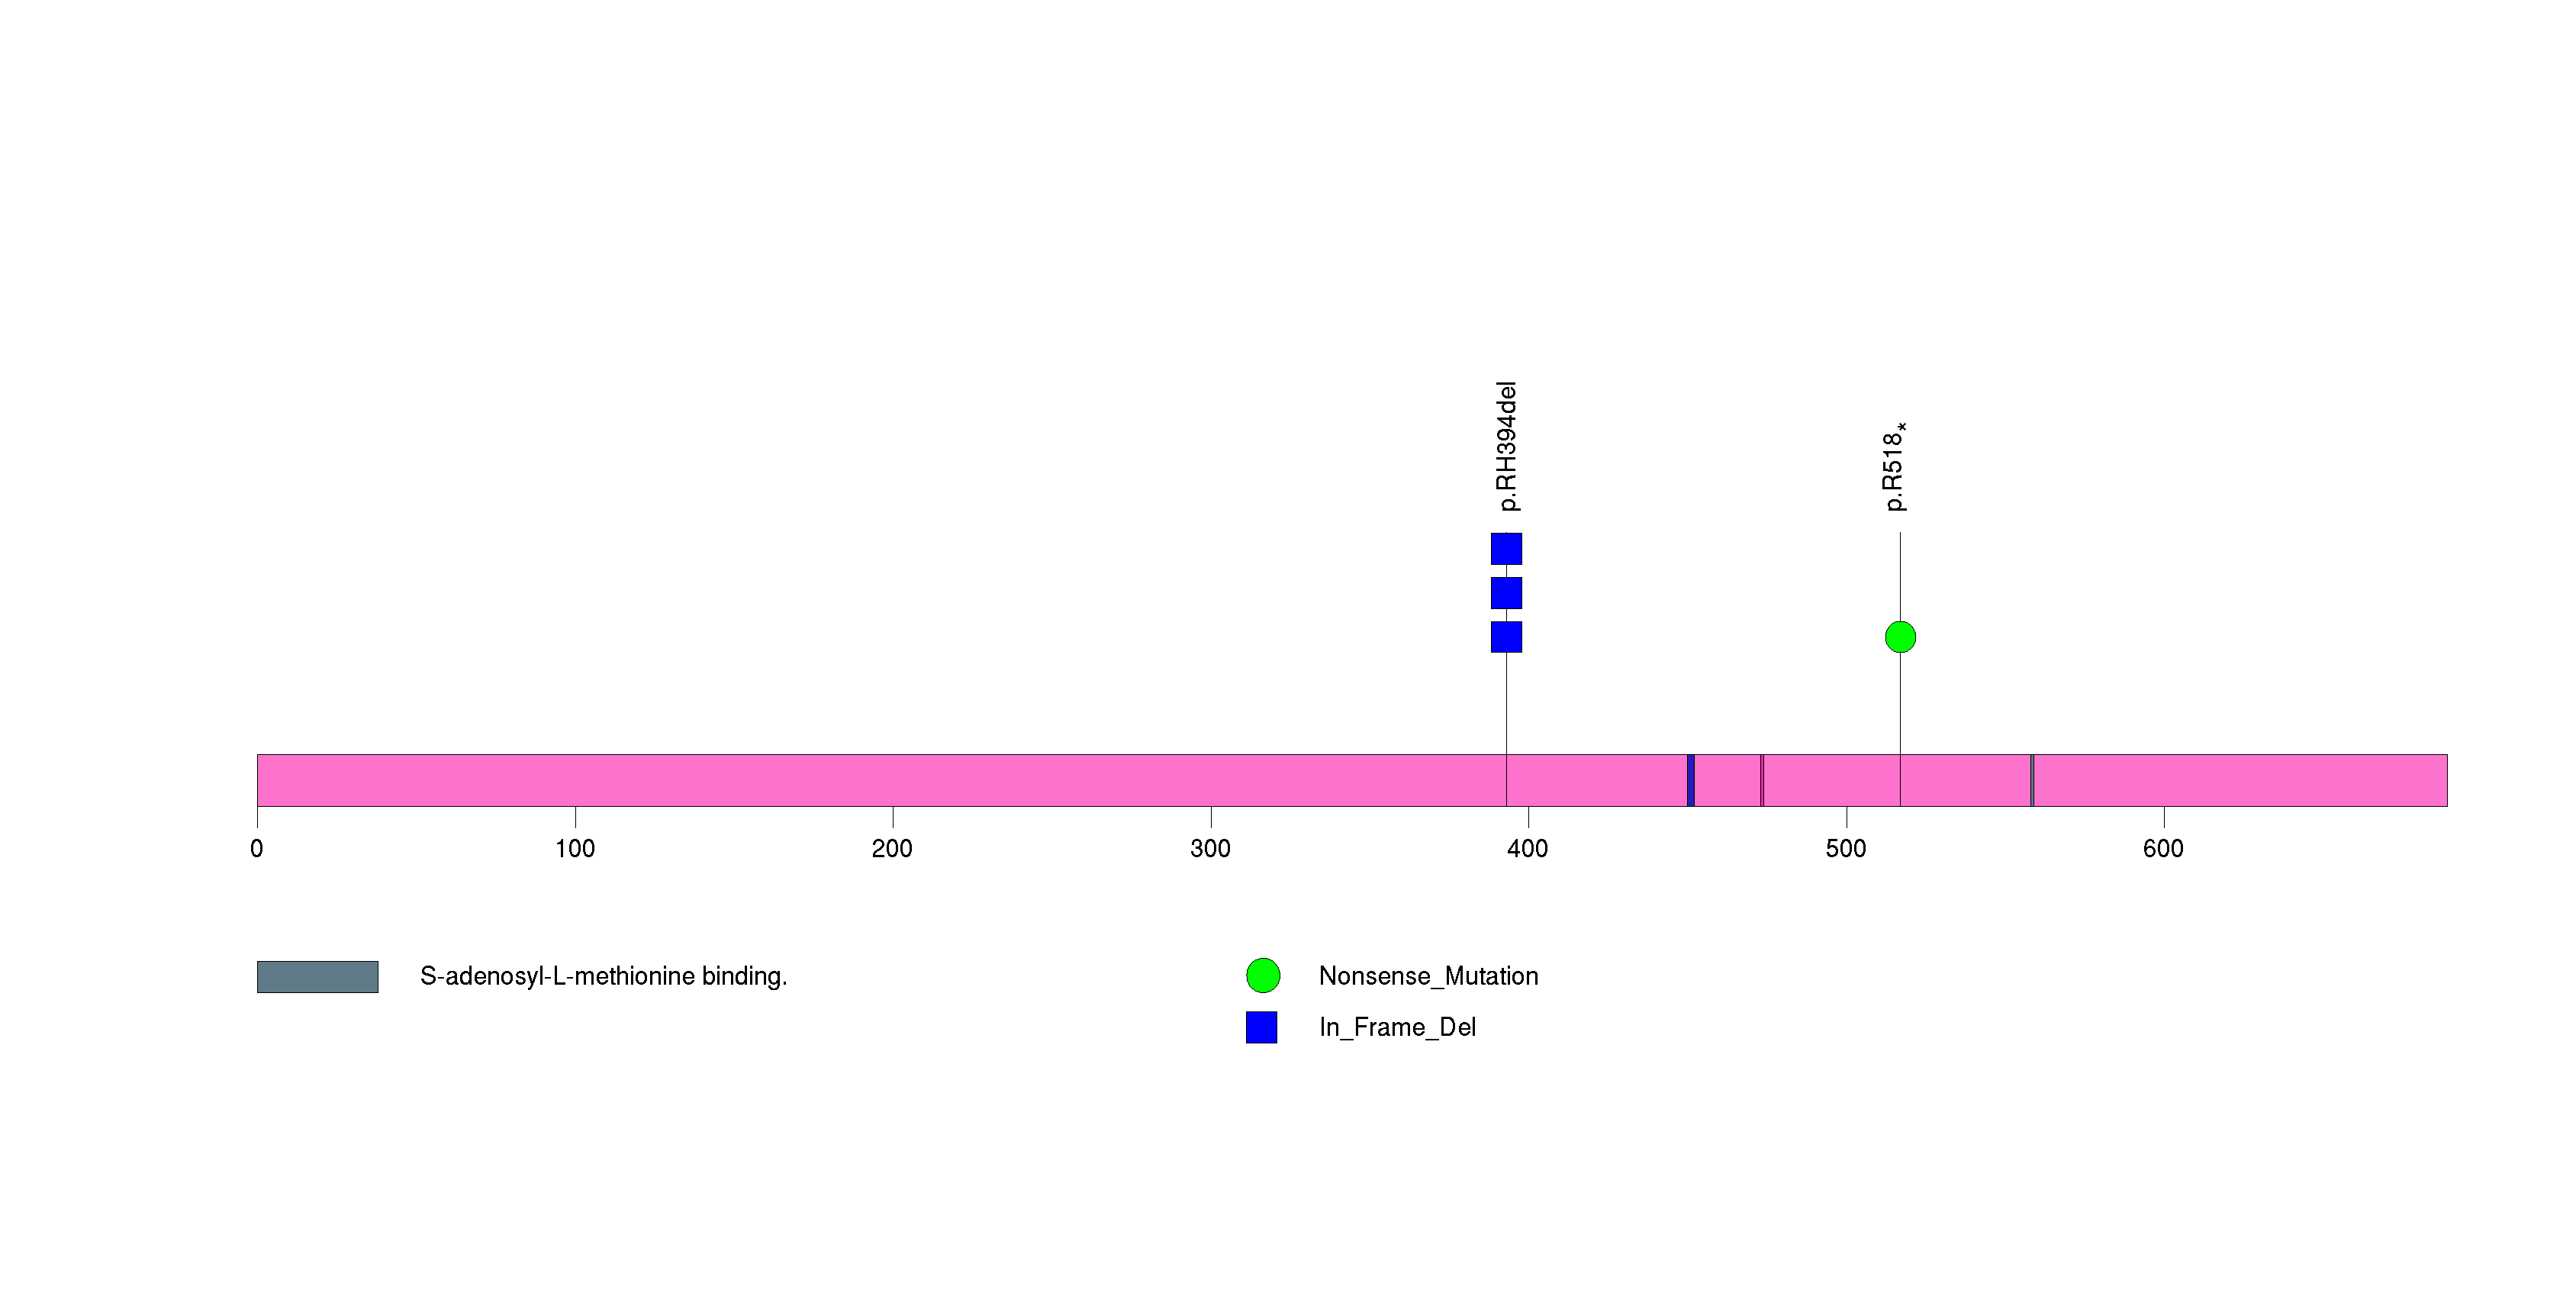
Figure S26. This figure depicts the distribution of mutations and mutation types across the ZMIZ1 significant gene.
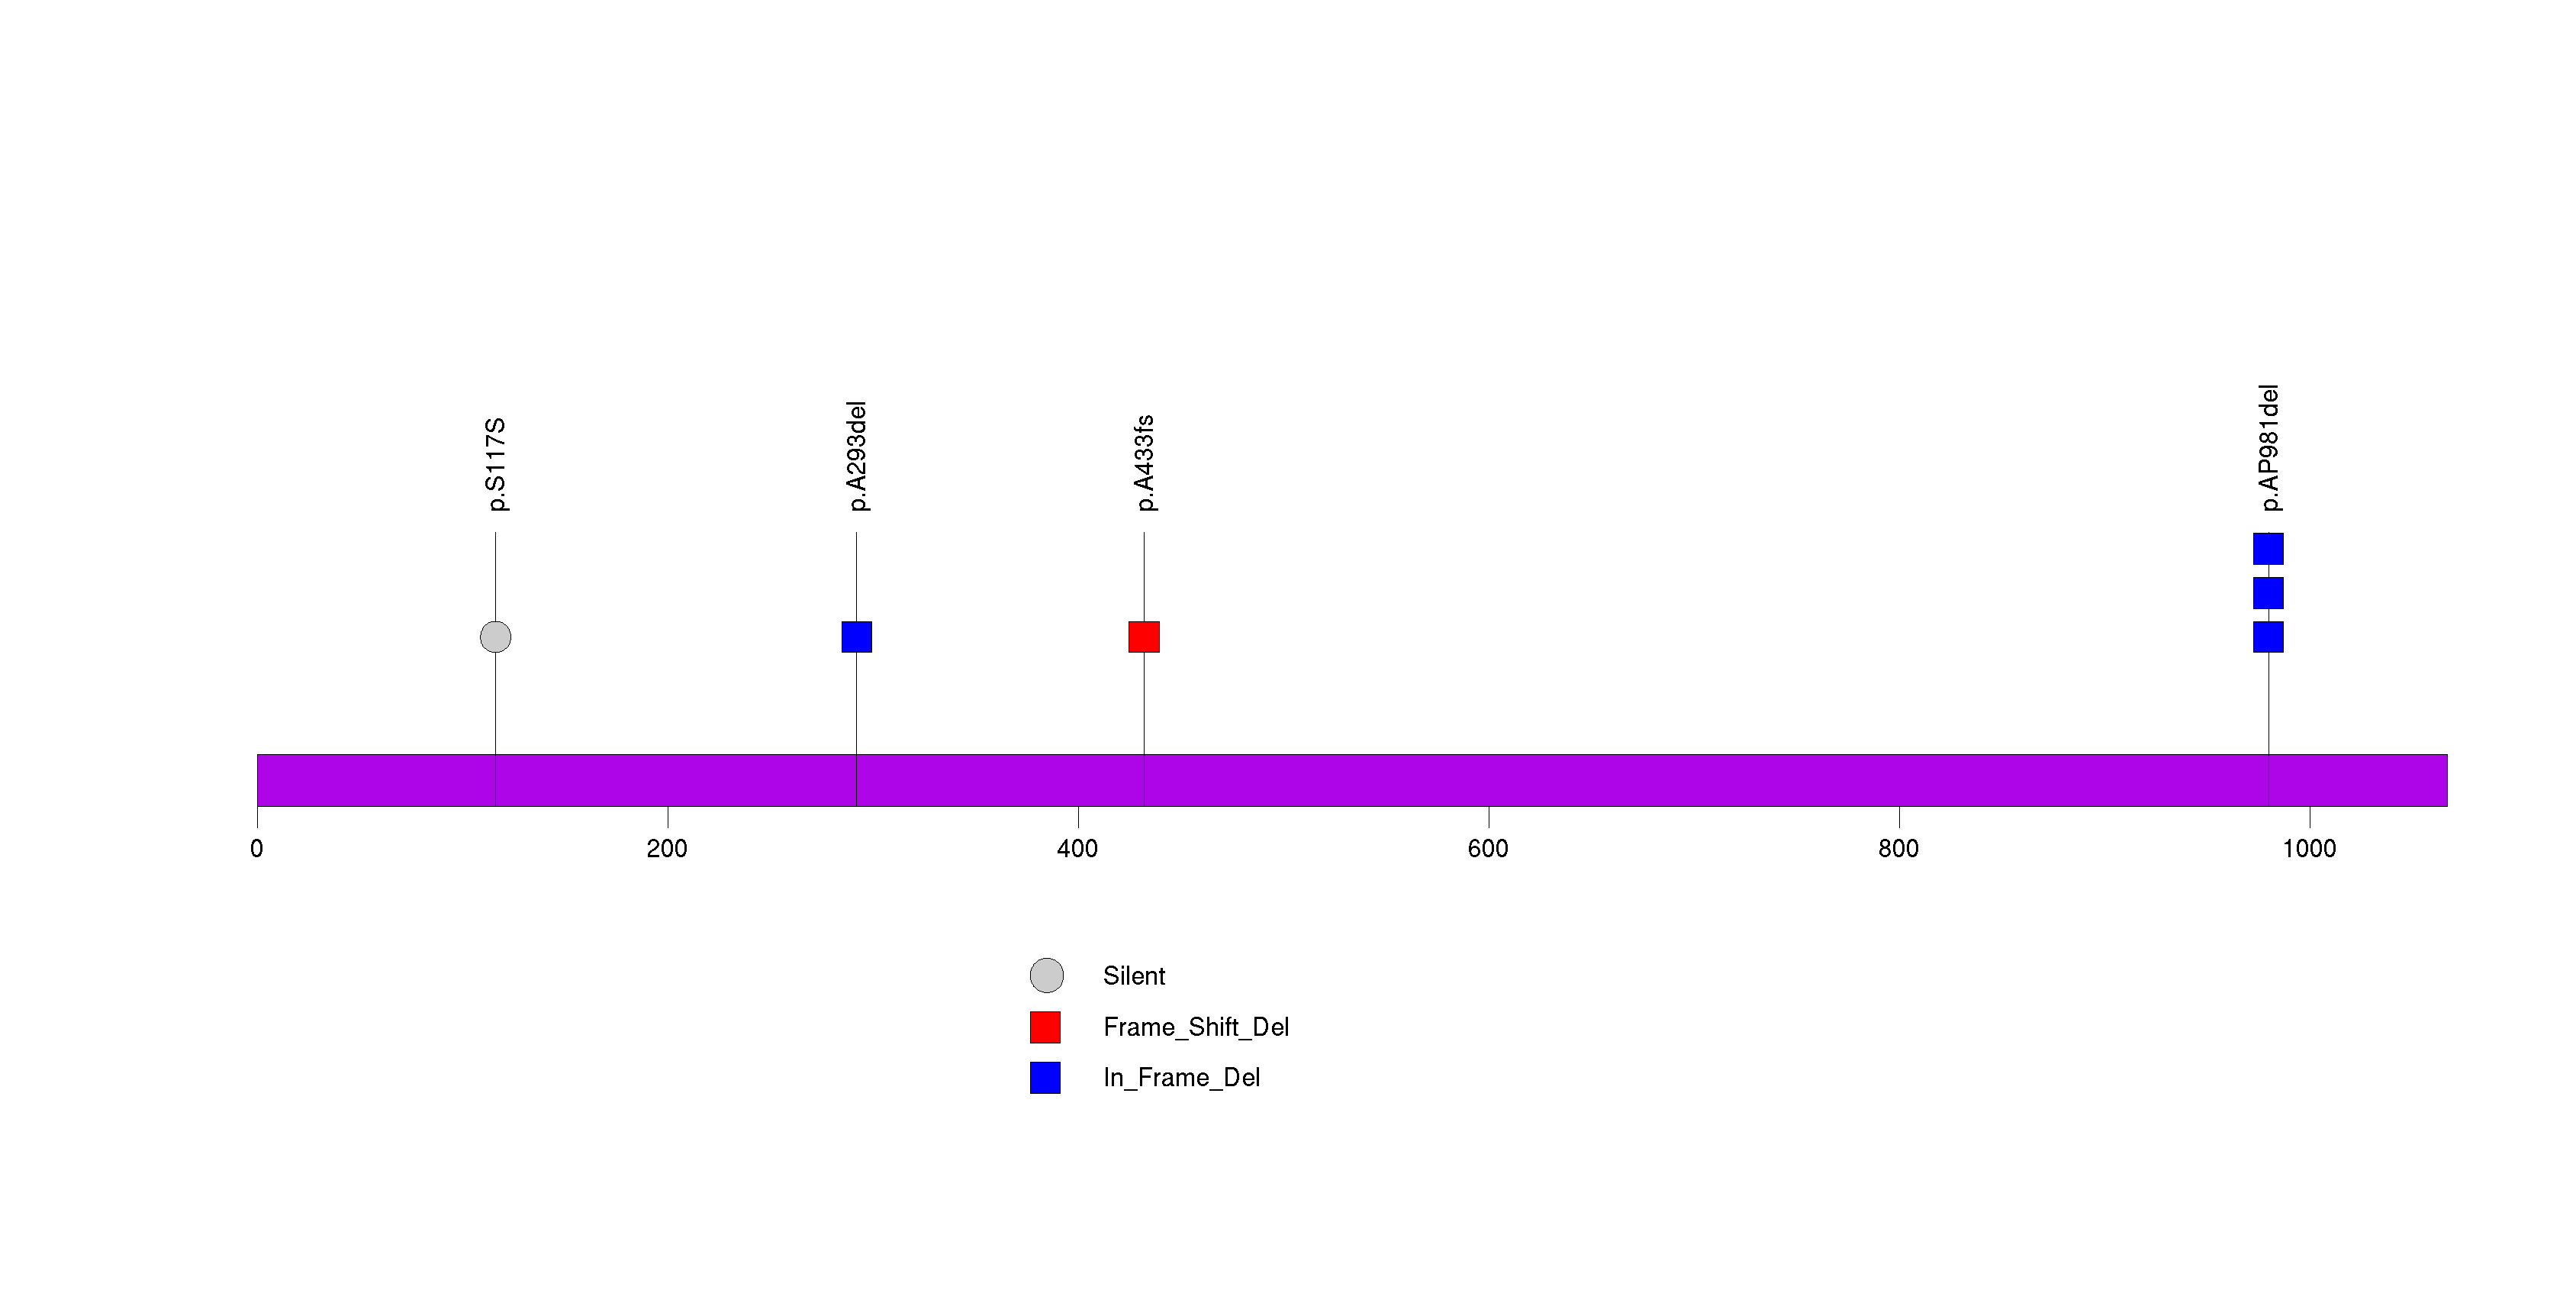
Figure S27. This figure depicts the distribution of mutations and mutation types across the SLC39A5 significant gene.
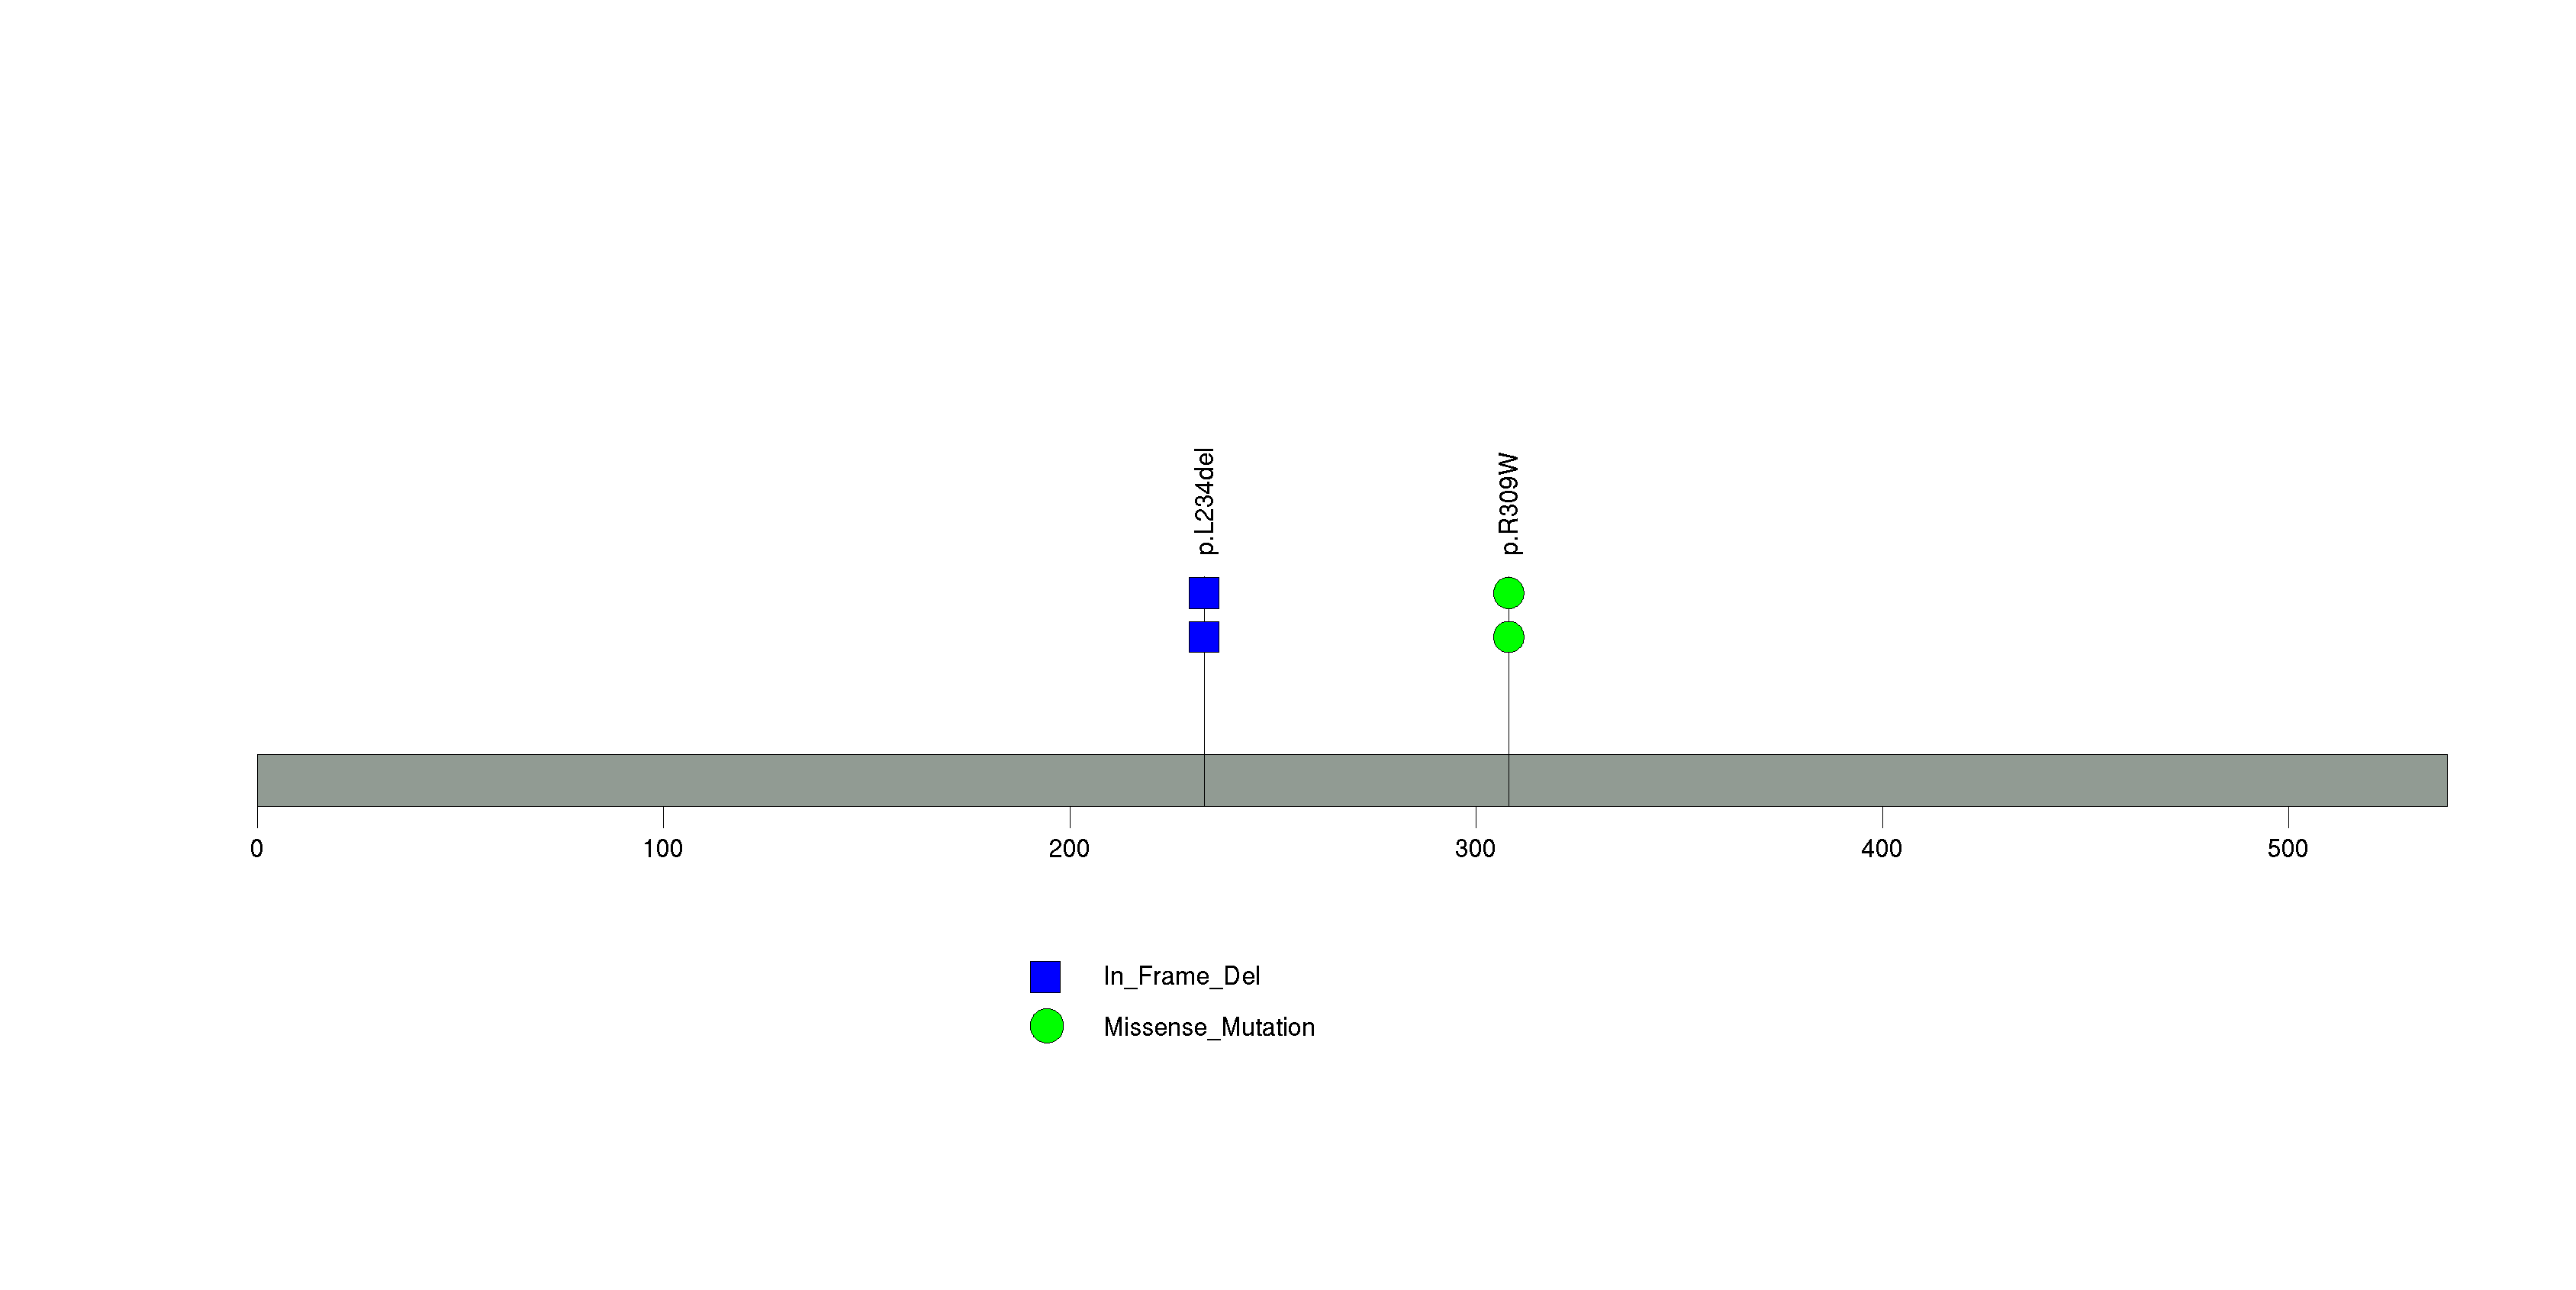
Figure S28. This figure depicts the distribution of mutations and mutation types across the GUCY2F significant gene.
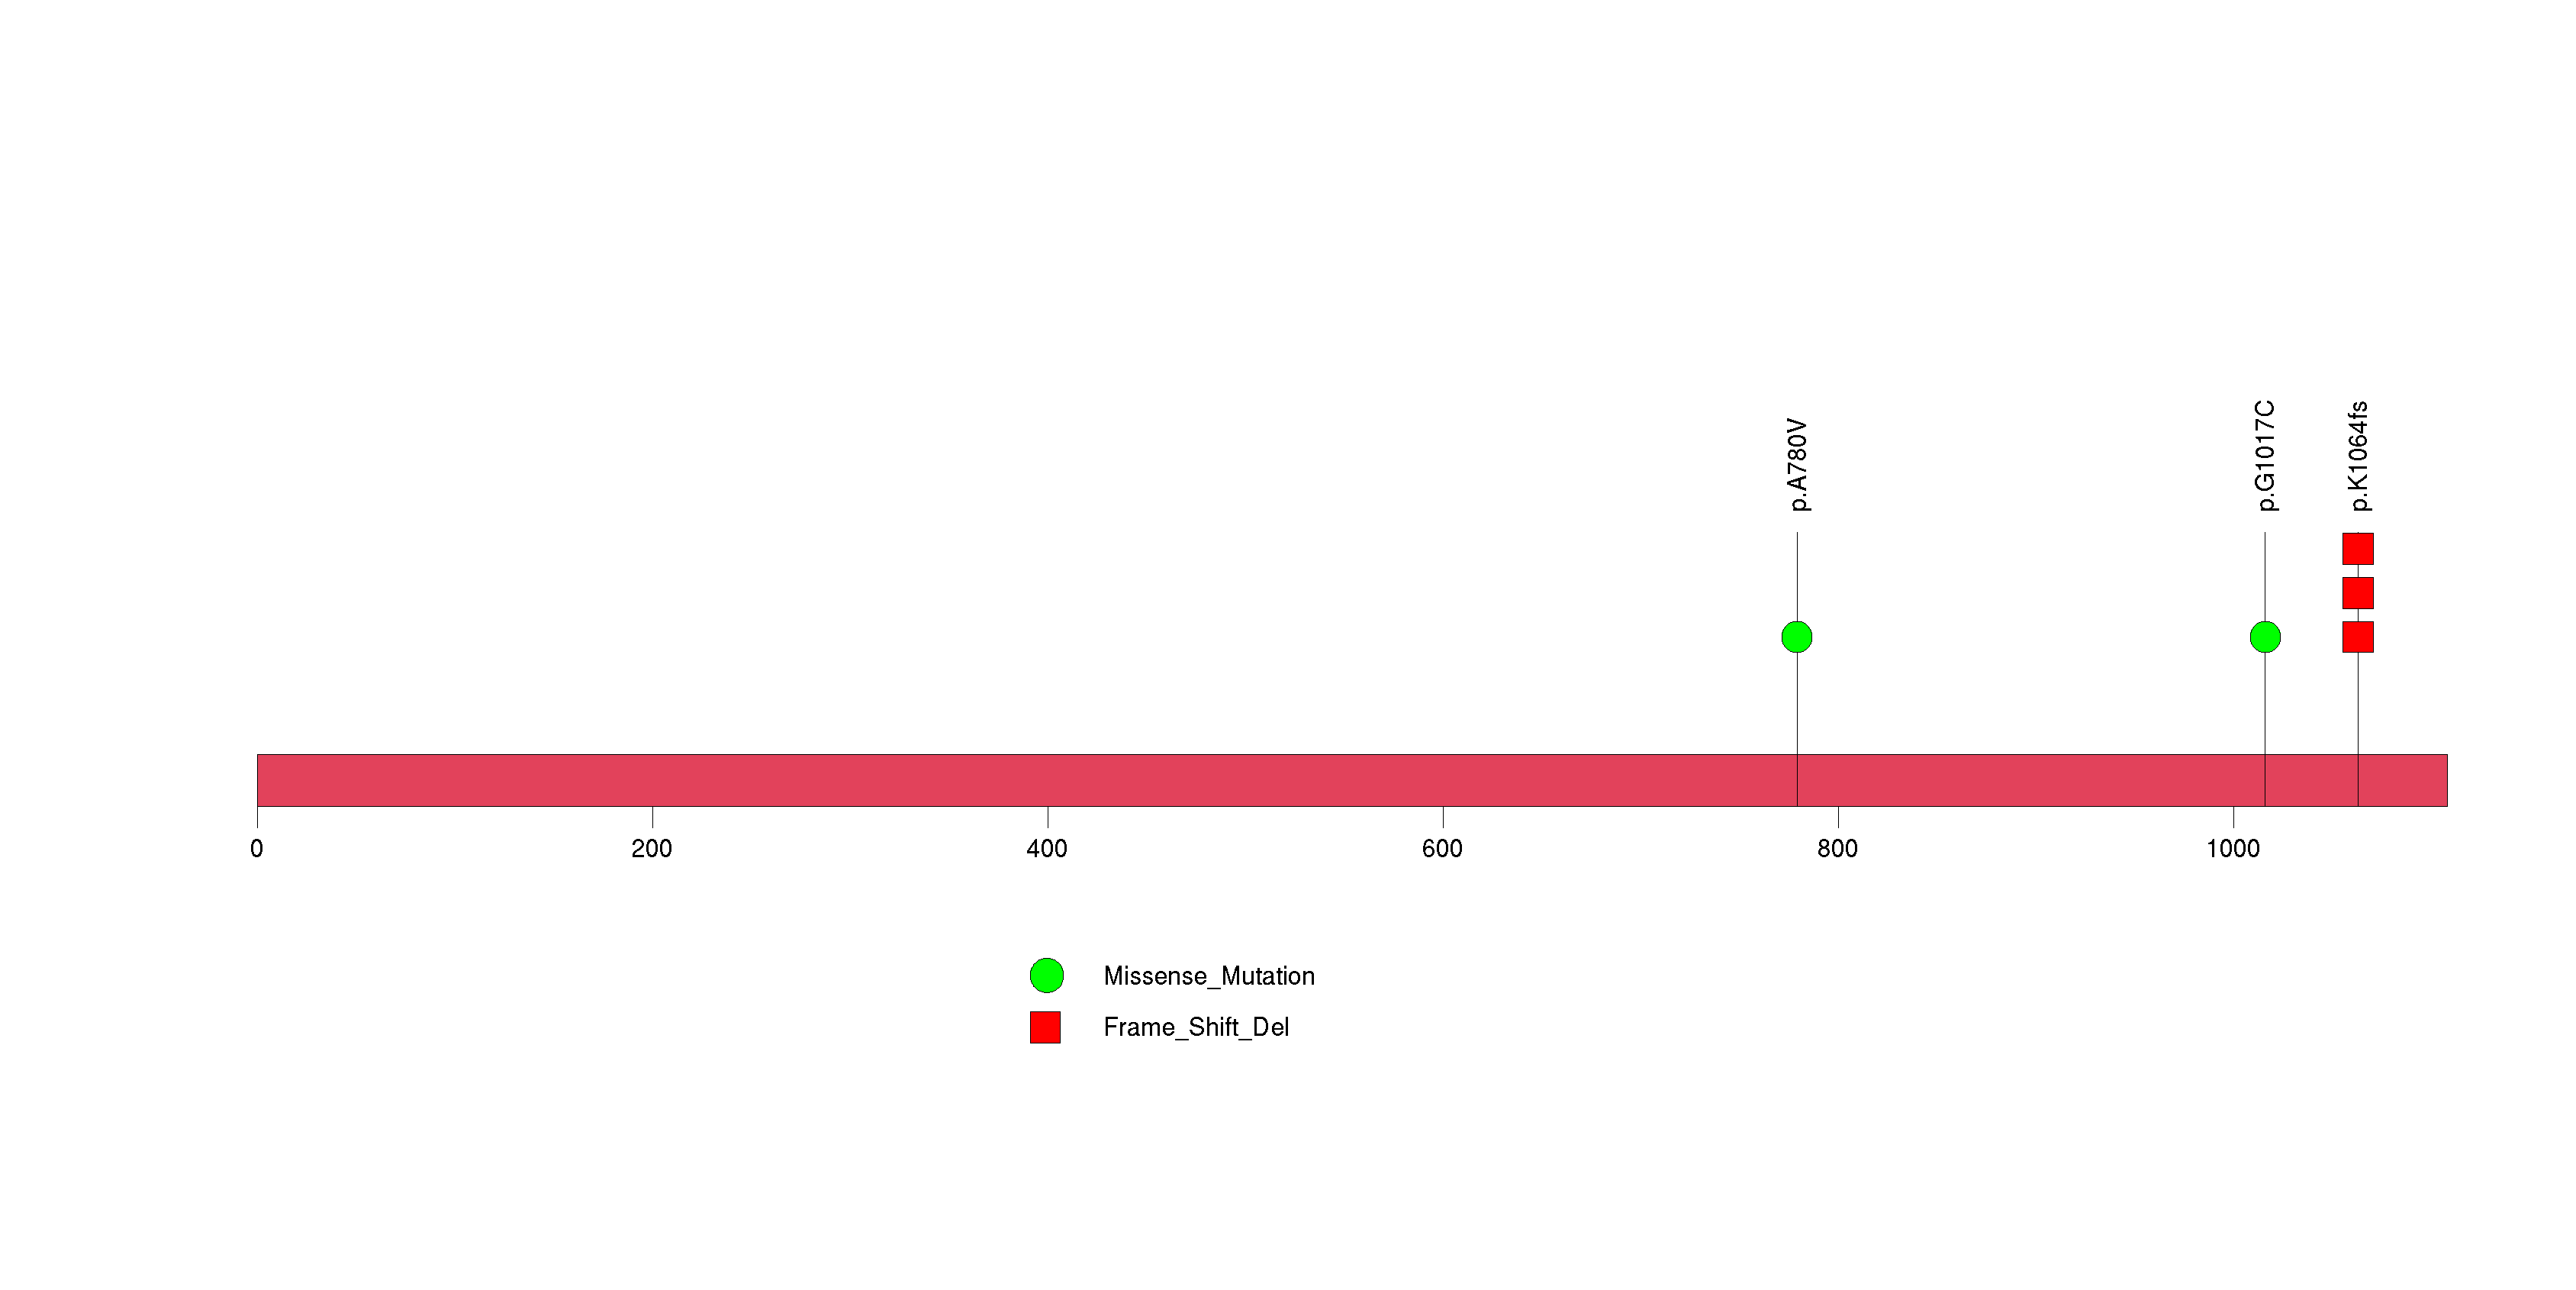
Figure S29. This figure depicts the distribution of mutations and mutation types across the EDC4 significant gene.
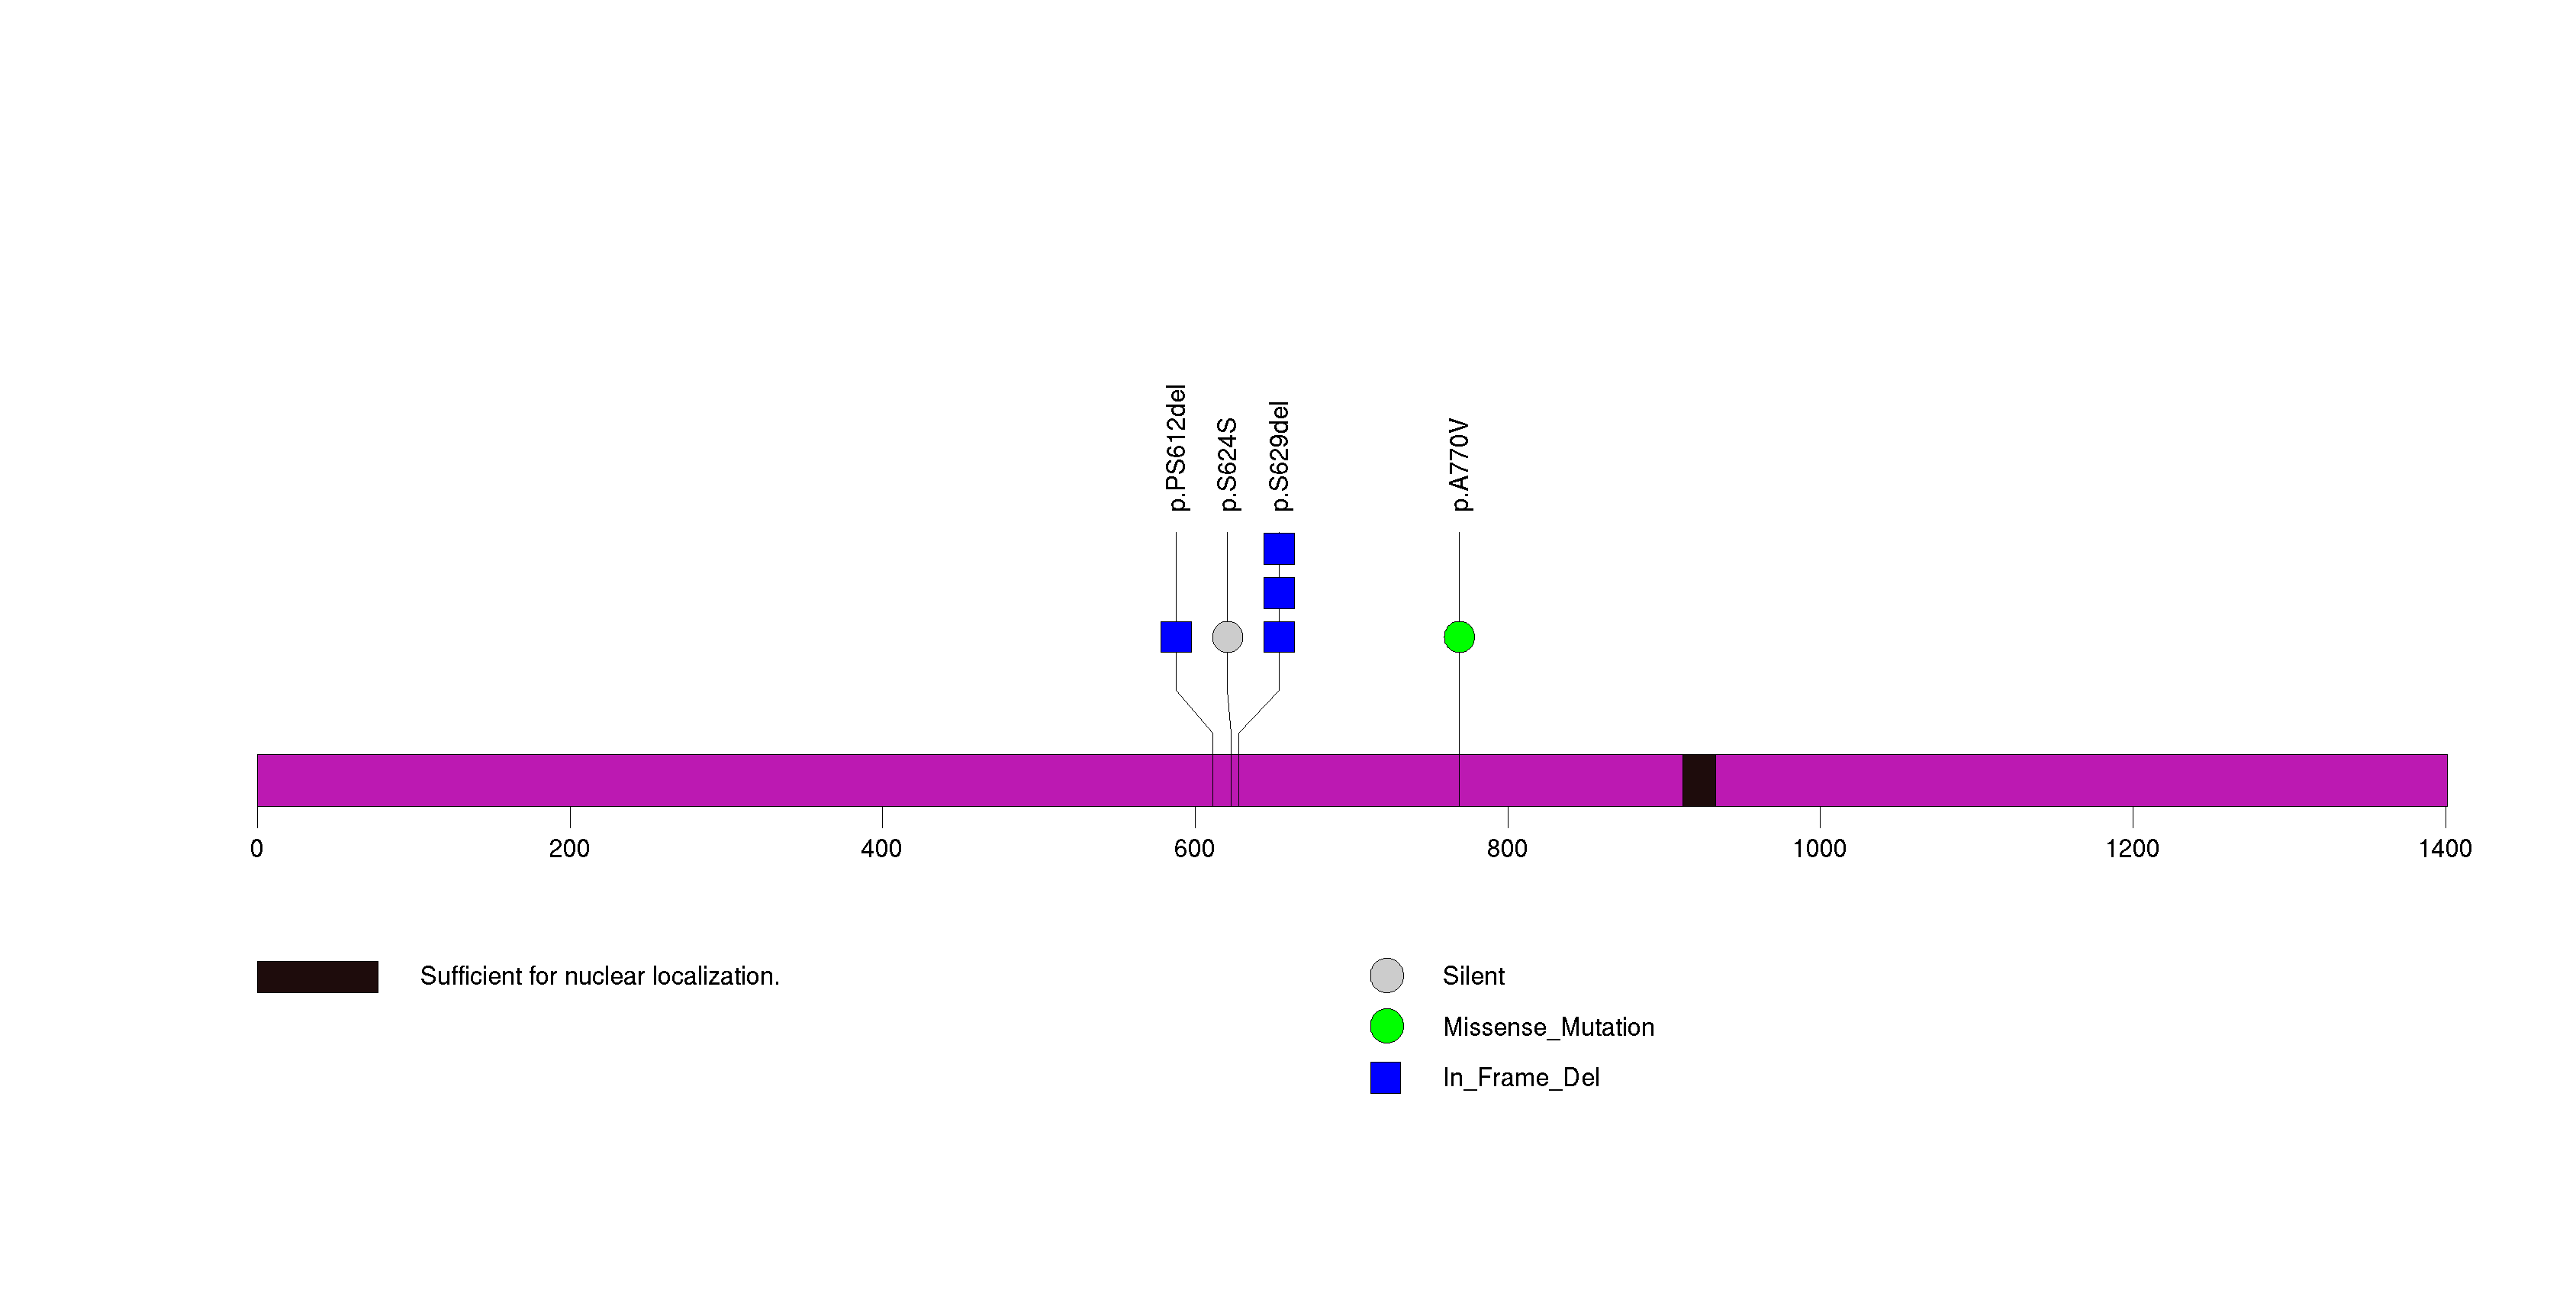
Figure S30. This figure depicts the distribution of mutations and mutation types across the SEH1L significant gene.
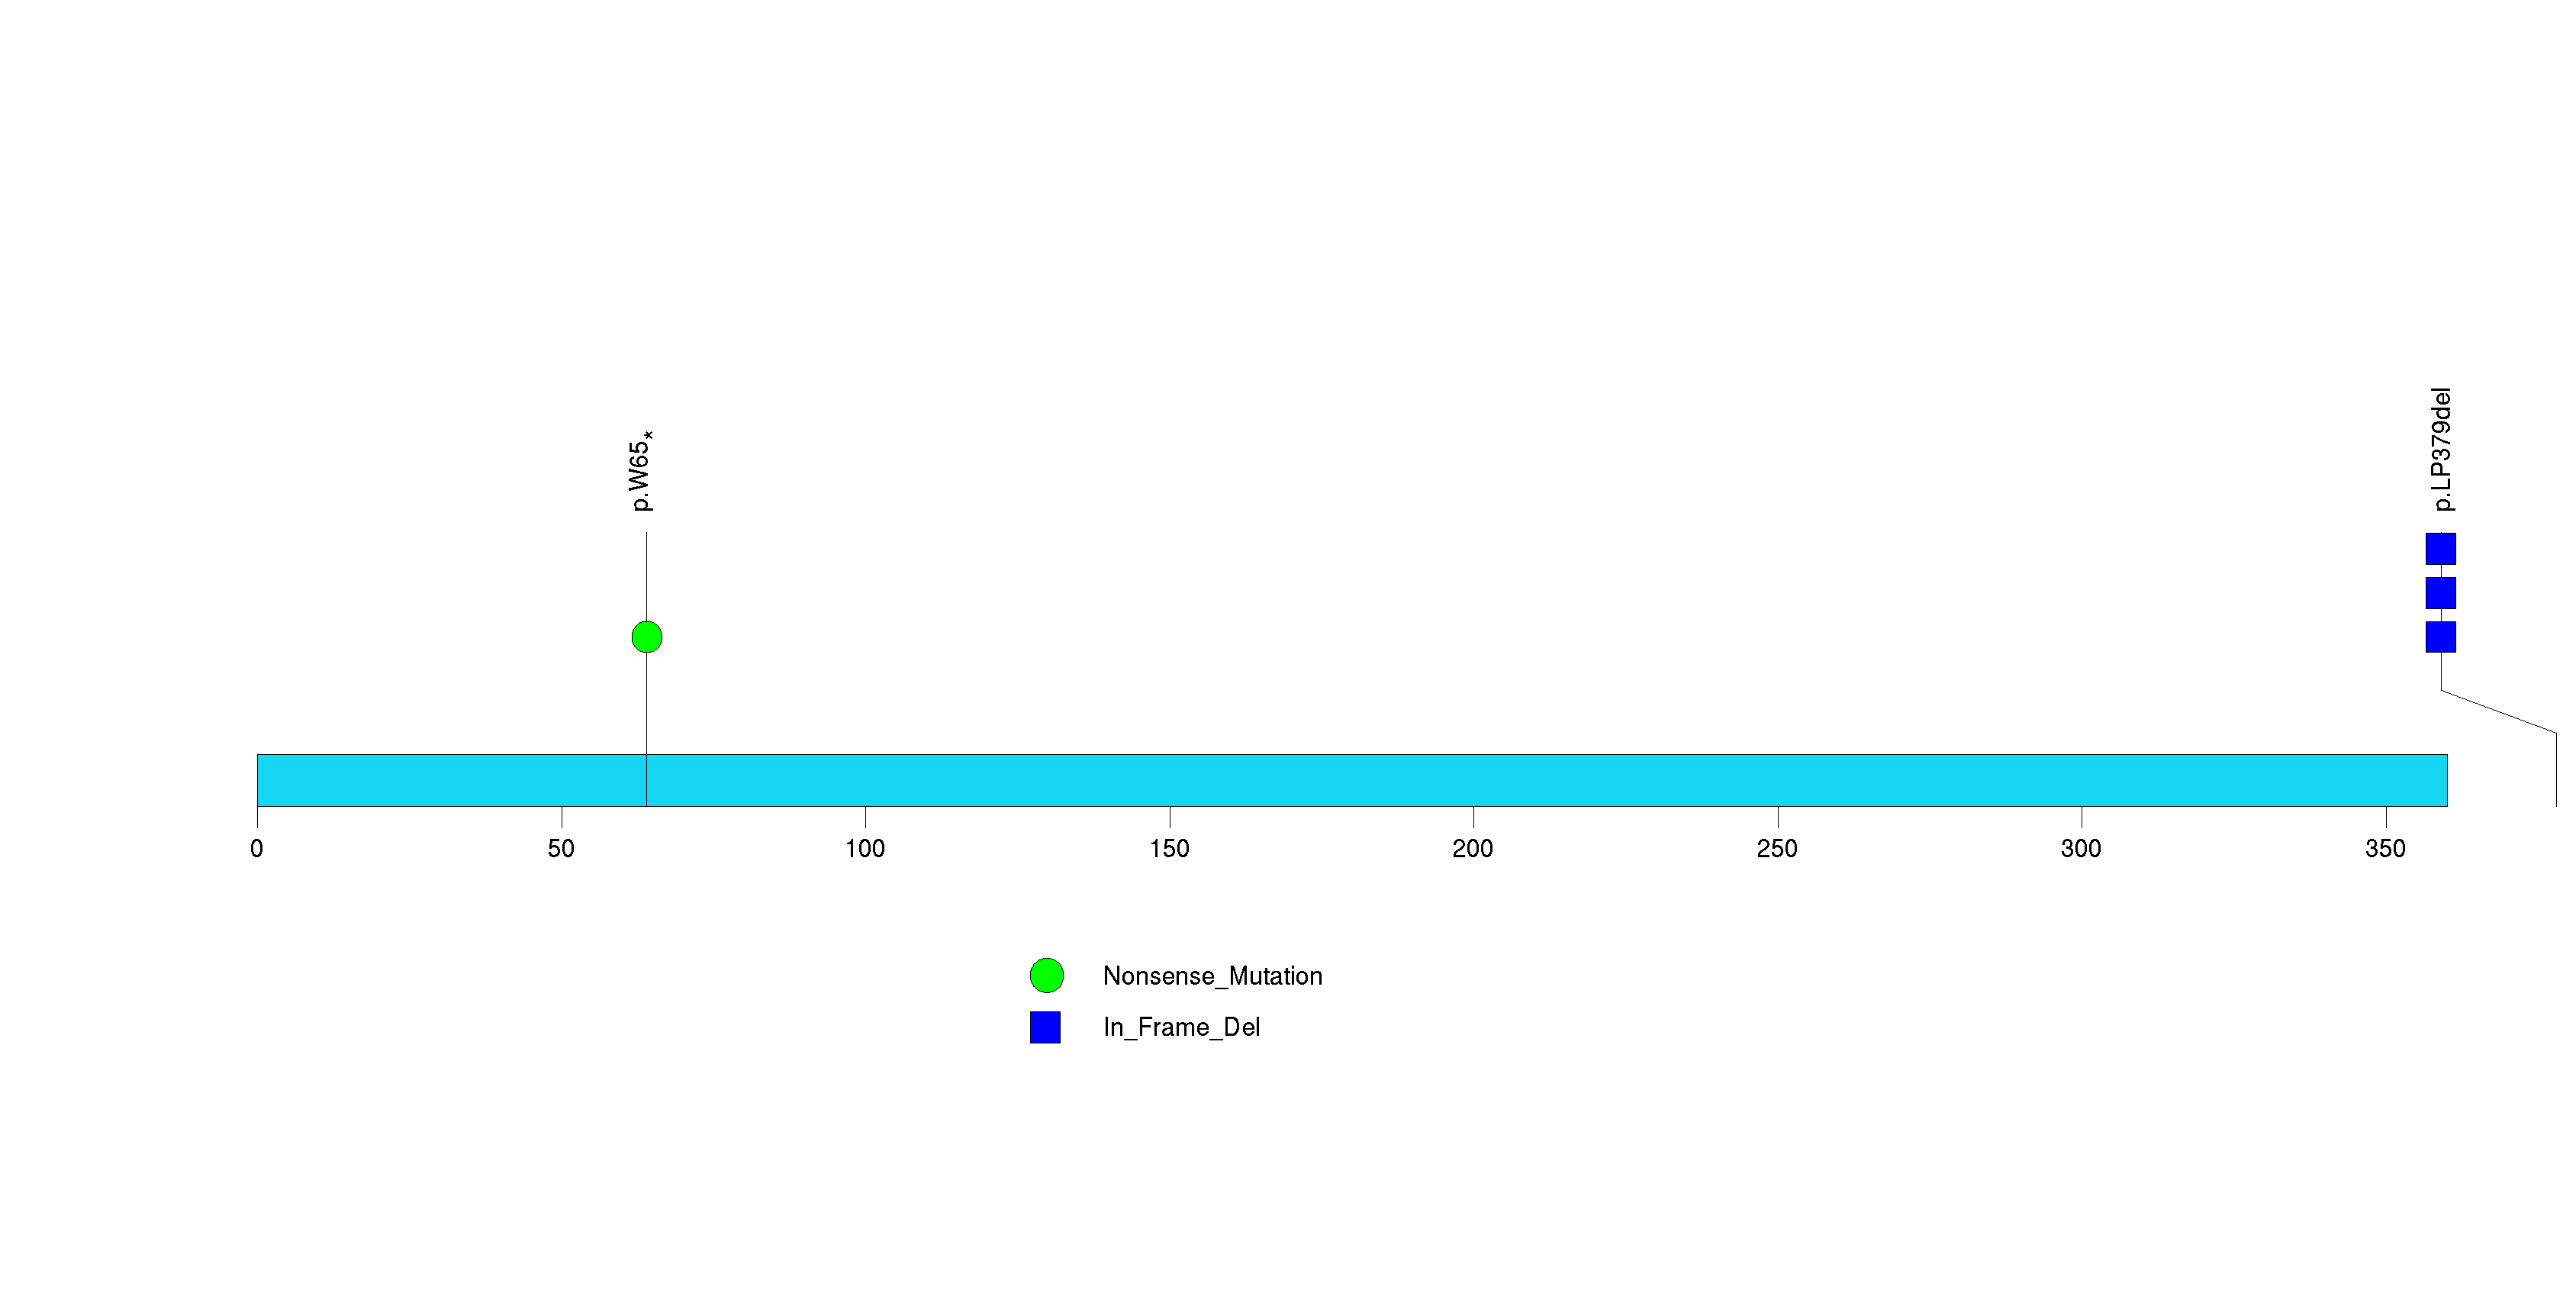
Figure S31. This figure depicts the distribution of mutations and mutation types across the SLC4A3 significant gene.
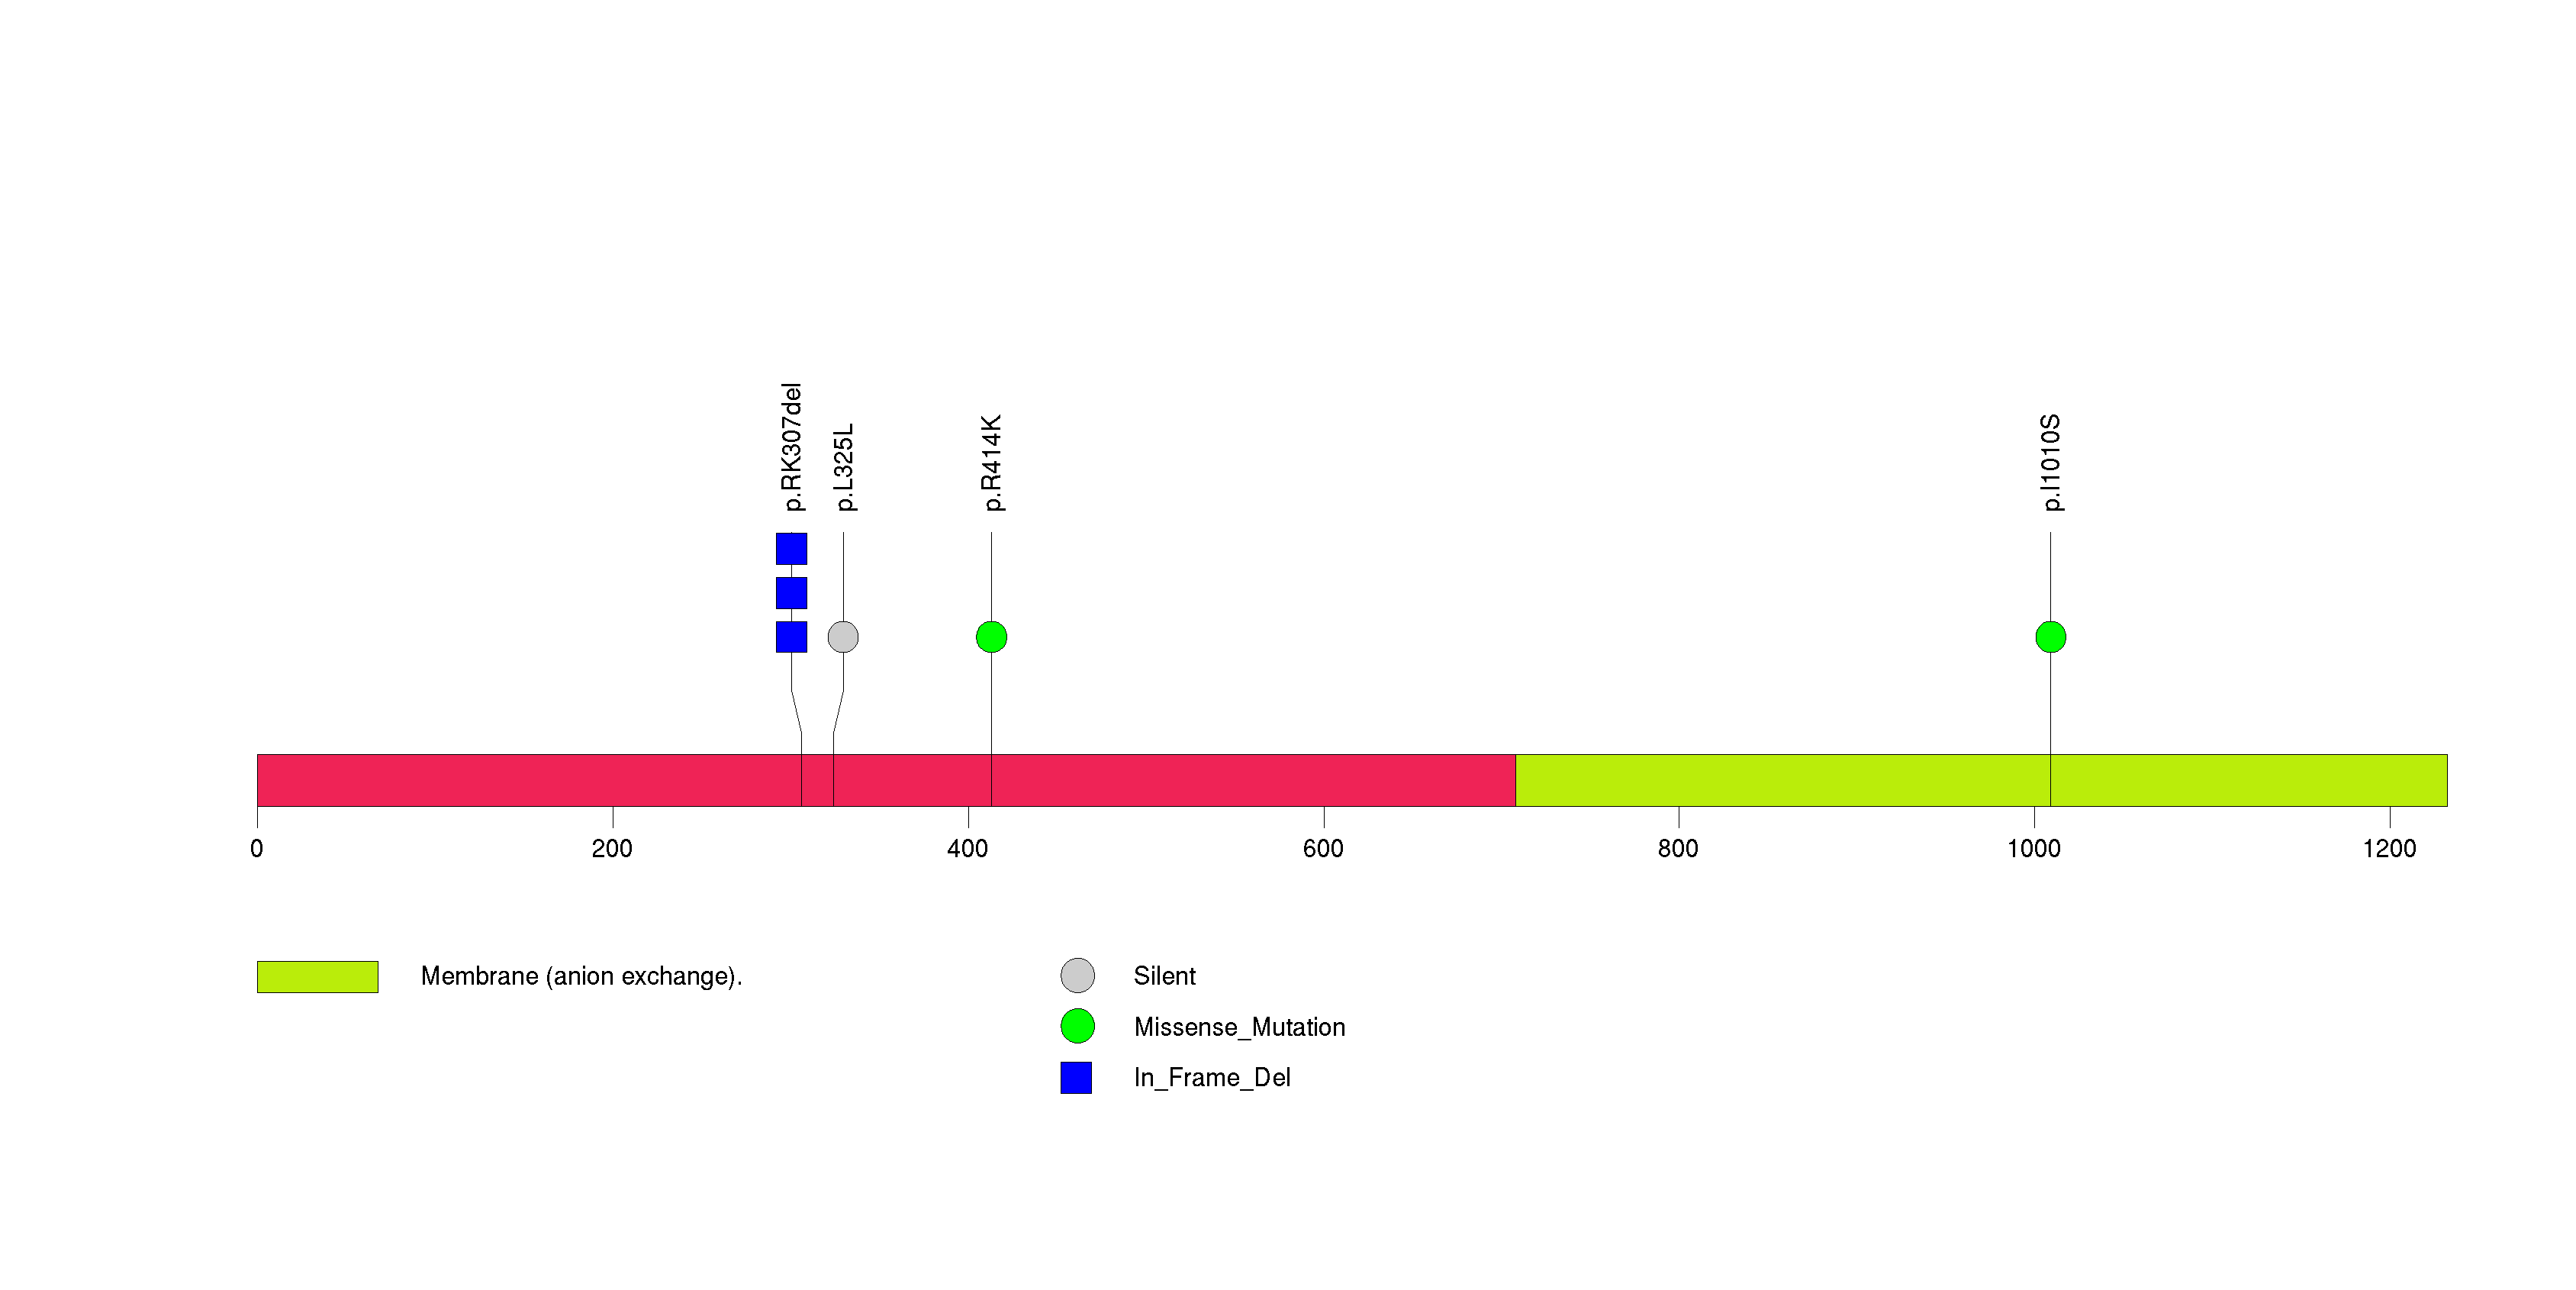
Figure S32. This figure depicts the distribution of mutations and mutation types across the CD99L2 significant gene.
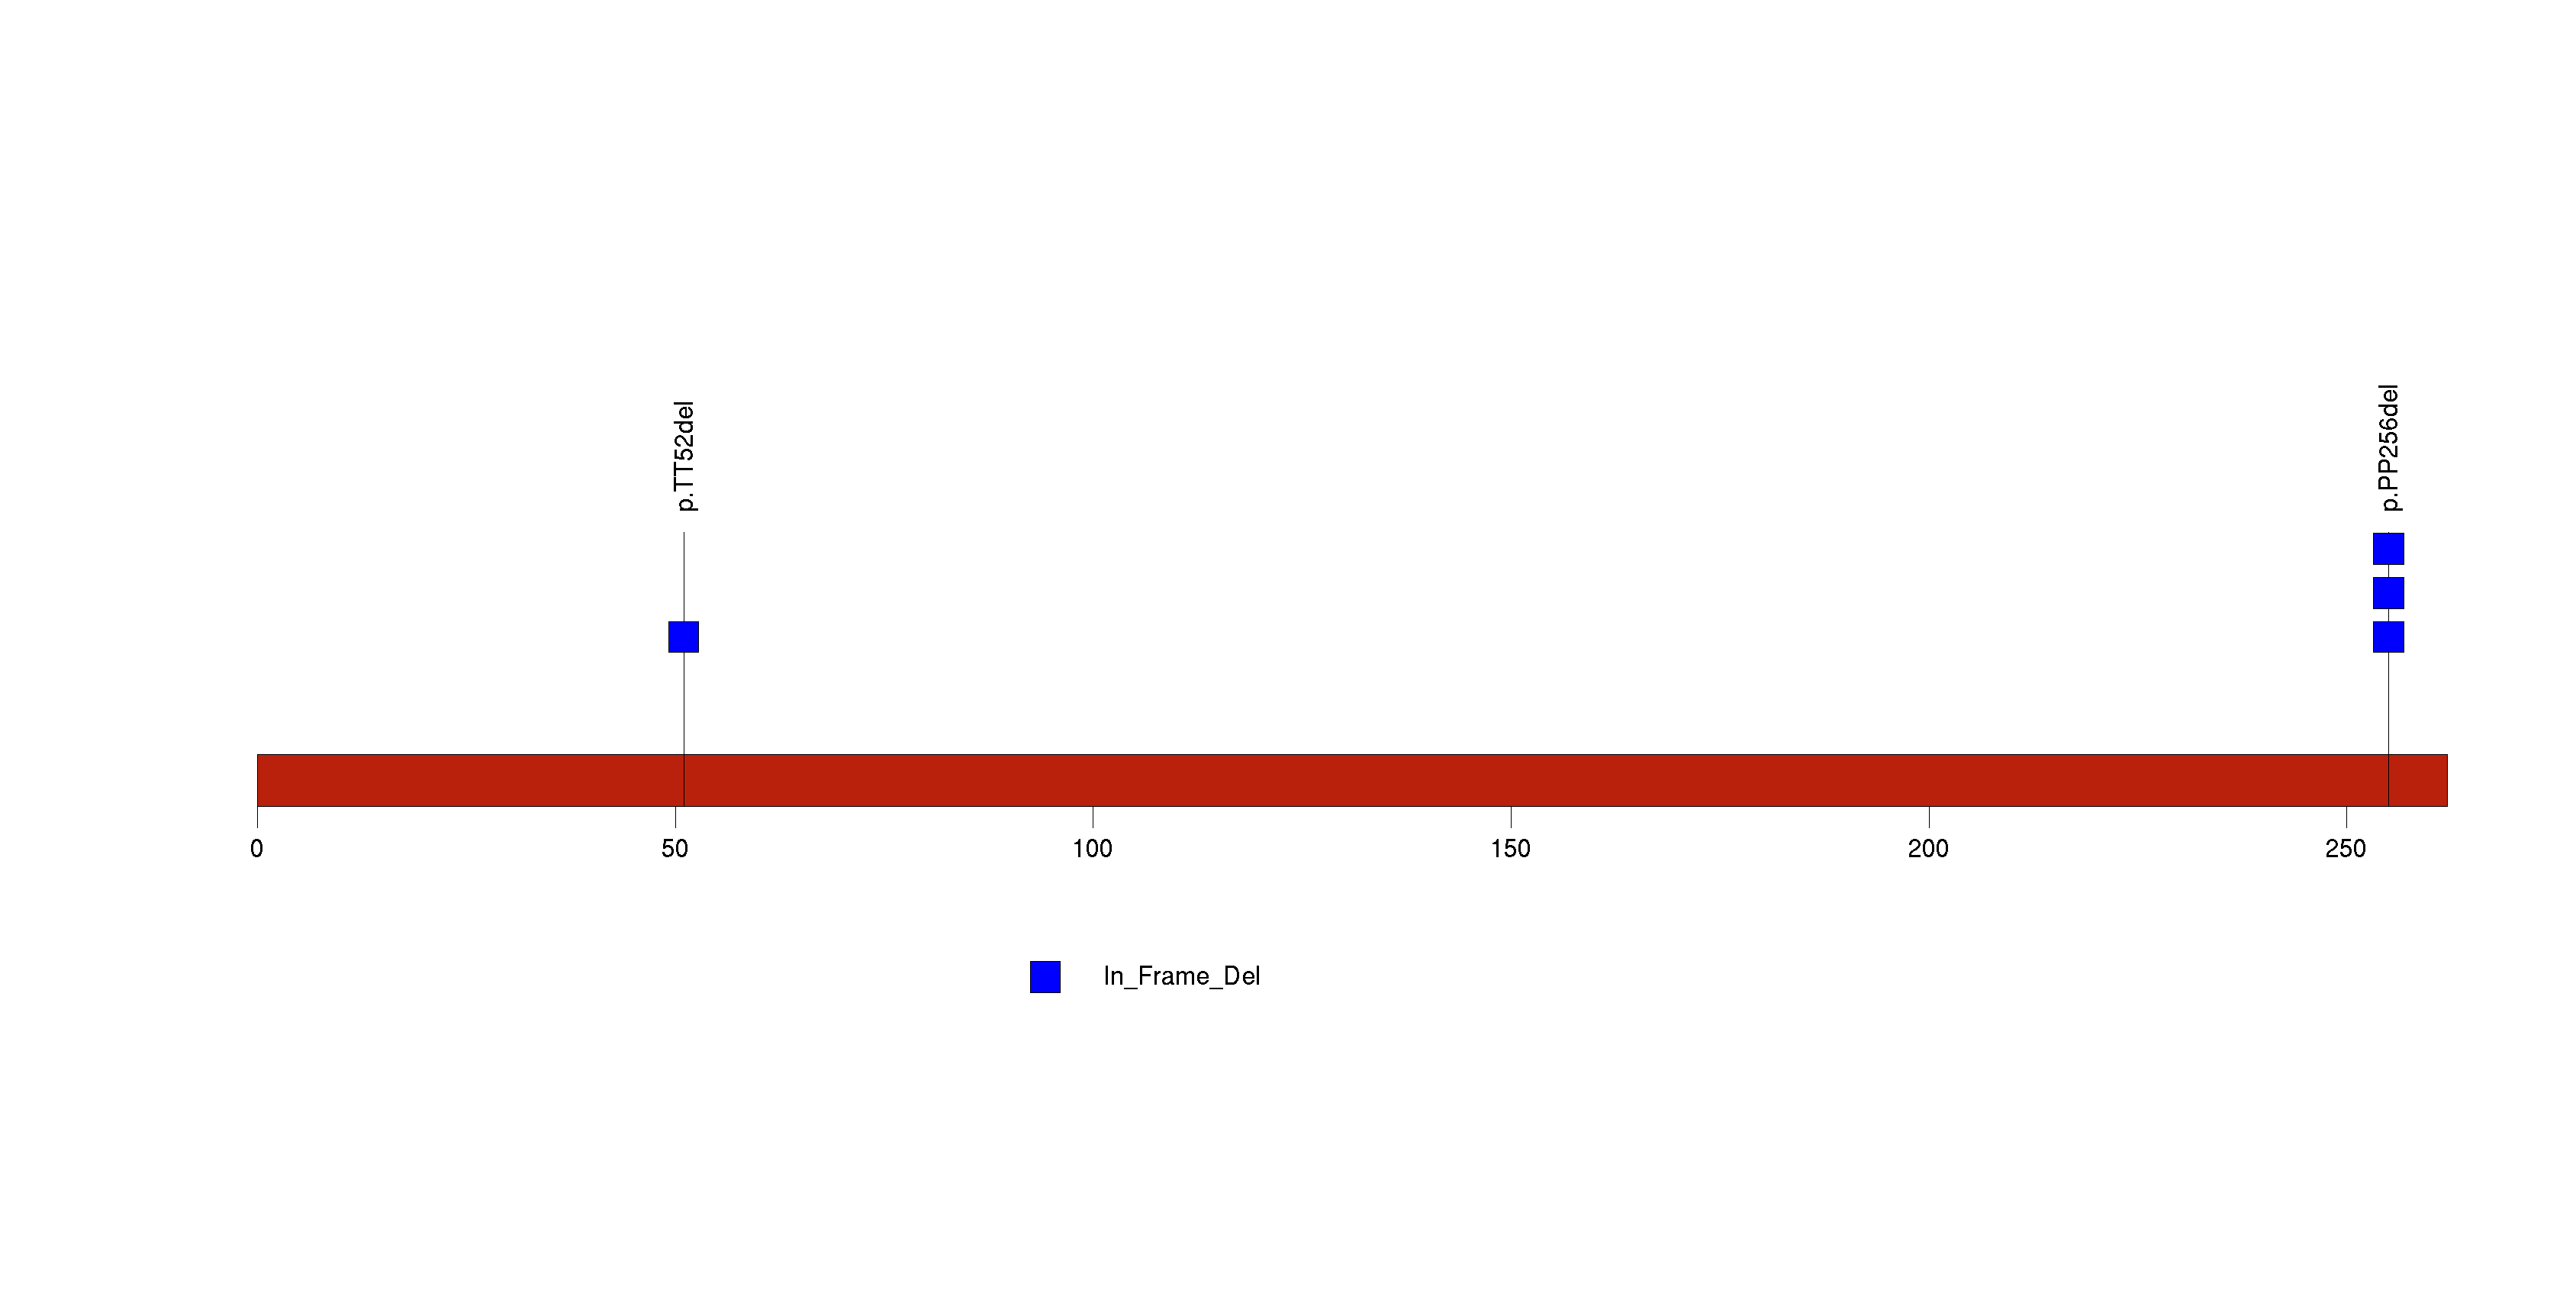
Figure S33. This figure depicts the distribution of mutations and mutation types across the SBNO1 significant gene.
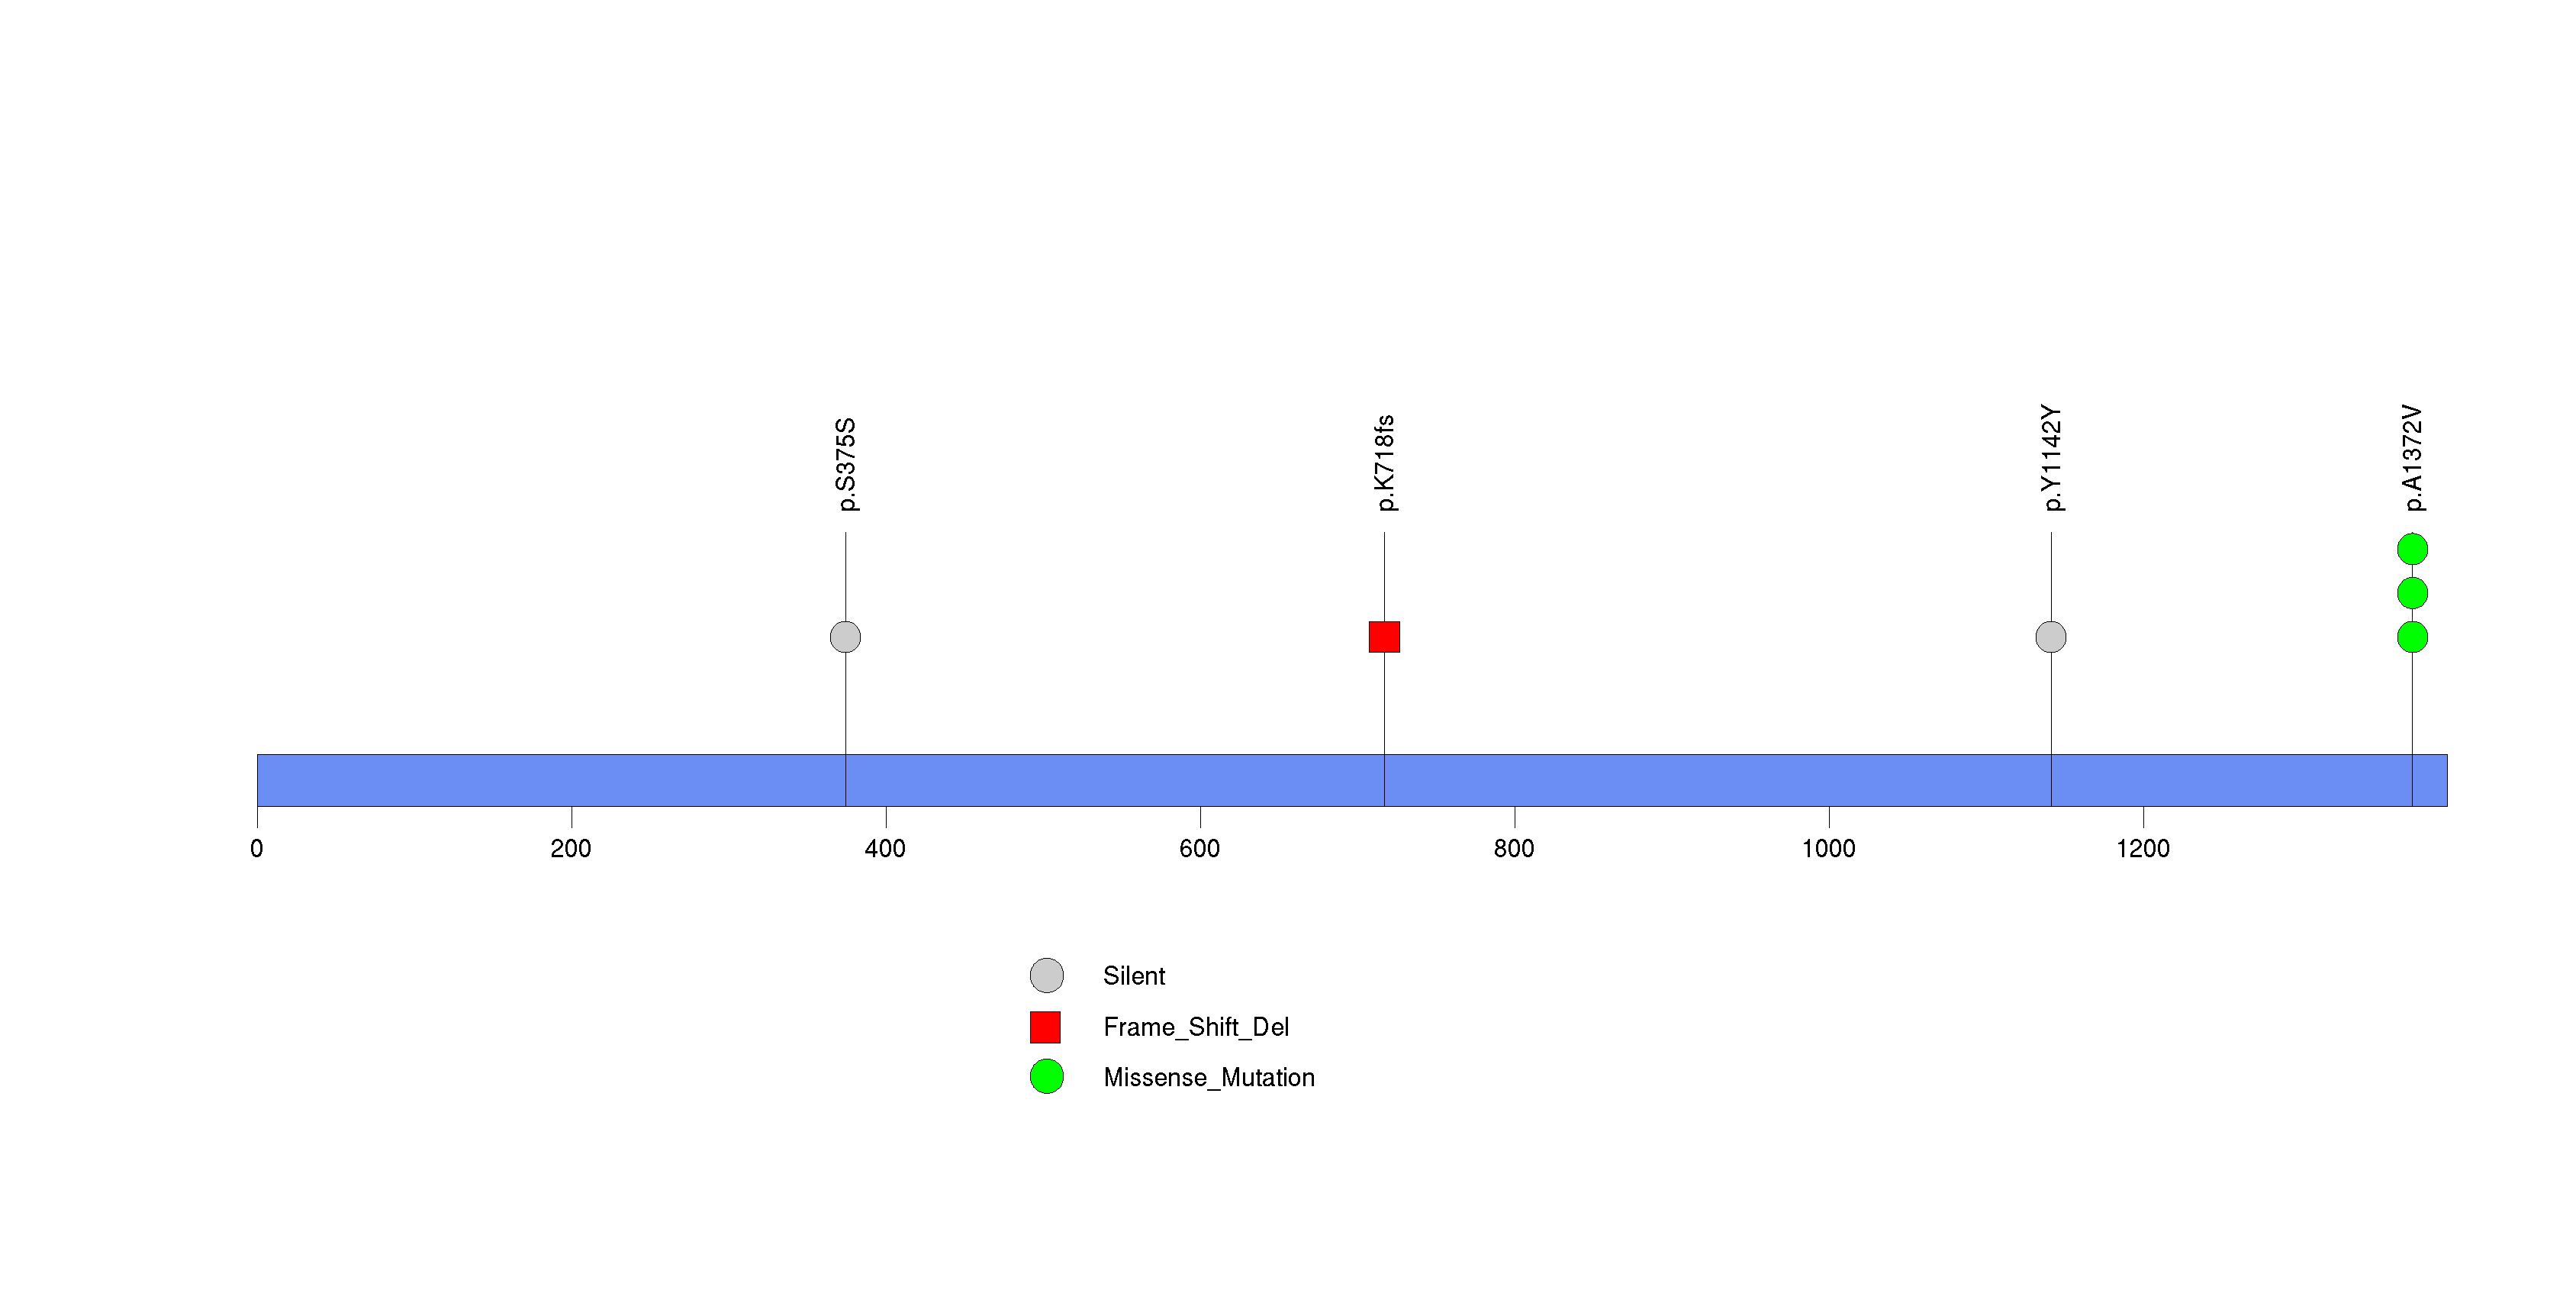
Figure S34. This figure depicts the distribution of mutations and mutation types across the NPNT significant gene.
In brief, we tabulate the number of mutations and the number of covered bases for each gene. The counts are broken down by mutation context category: four context categories that are discovered by MutSig, and one for indel and 'null' mutations, which include indels, nonsense mutations, splice-site mutations, and non-stop (read-through) mutations. For each gene, we calculate the probability of seeing the observed constellation of mutations, i.e. the product P1 x P2 x ... x Pm, or a more extreme one, given the background mutation rates calculated across the dataset. [1]
In addition to the links below, the full results of the analysis summarized in this report can also be downloaded programmatically using firehose_get, or interactively from either the Broad GDAC website or TCGA Data Coordination Center Portal.