This pipeline computes the correlation between significant arm-level copy number variations (cnvs) and selected clinical features.
Testing the association between copy number variation 80 arm-level events and 4 clinical features across 114 patients, 6 significant findings detected with Q value < 0.25.
-
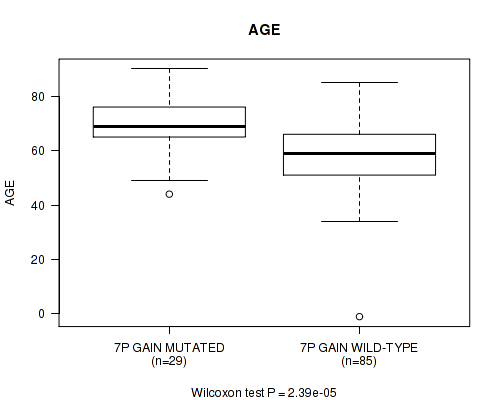
7p gain cnv correlated to 'AGE'.
-
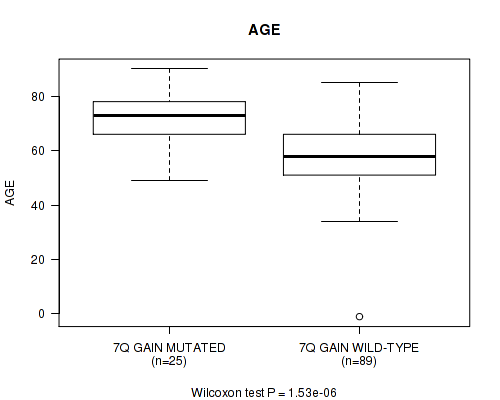
7q gain cnv correlated to 'AGE'.
-
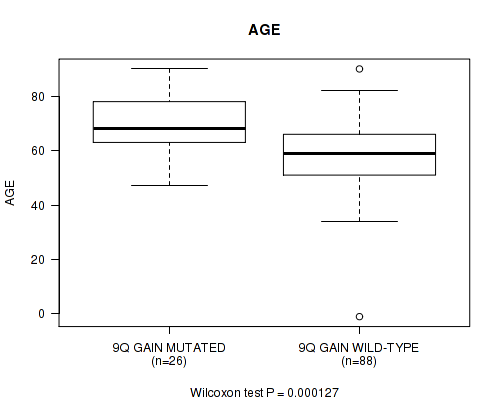
9q gain cnv correlated to 'AGE'.
-
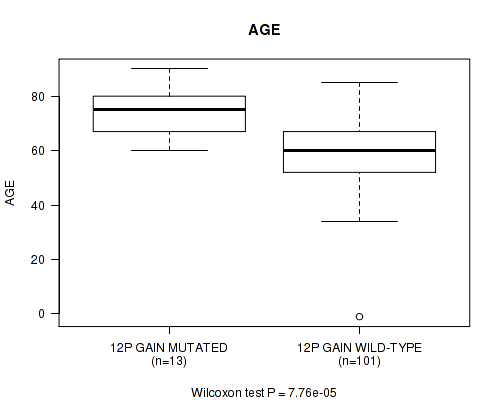
12p gain cnv correlated to 'Time to Death' and 'AGE'.
-
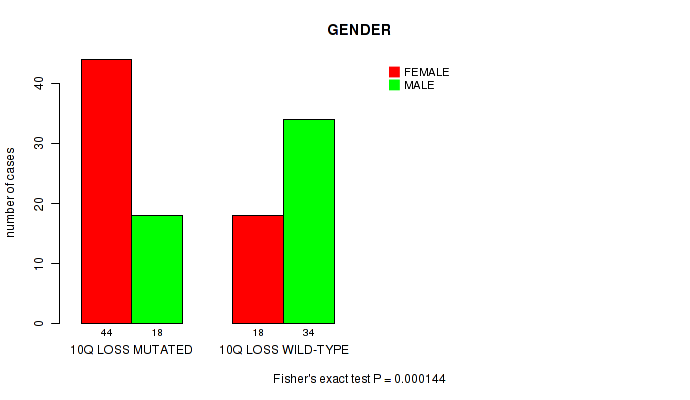
10q loss cnv correlated to 'GENDER'.
Table 1. Get Full Table Overview of the association between significant copy number variation of 80 arm-level events and 4 clinical features. Shown in the table are P values (Q values). Thresholded by Q value < 0.25, 6 significant findings detected.
|
Clinical Features |
Time to Death |
AGE | GENDER | RACE | ||
| nCNV (%) | nWild-Type | logrank test | Wilcoxon-test | Fisher's exact test | Fisher's exact test | |
| 12p gain | 13 (11%) | 101 |
3.47e-05 (0.011) |
7.76e-05 (0.0246) |
1 (1.00) |
0.0755 (1.00) |
| 7p gain | 29 (25%) | 85 |
0.302 (1.00) |
2.39e-05 (0.00762) |
0.198 (1.00) |
0.558 (1.00) |
| 7q gain | 25 (22%) | 89 |
0.538 (1.00) |
1.53e-06 (0.000491) |
1 (1.00) |
0.305 (1.00) |
| 9q gain | 26 (23%) | 88 |
0.53 (1.00) |
0.000127 (0.0403) |
0.824 (1.00) |
0.613 (1.00) |
| 10q loss | 62 (54%) | 52 |
0.263 (1.00) |
0.351 (1.00) |
0.000144 (0.0455) |
0.791 (1.00) |
| 1p gain | 21 (18%) | 93 |
0.0358 (1.00) |
0.549 (1.00) |
0.478 (1.00) |
0.469 (1.00) |
| 1q gain | 23 (20%) | 91 |
0.509 (1.00) |
0.0475 (1.00) |
0.349 (1.00) |
1 (1.00) |
| 2p gain | 10 (9%) | 104 |
0.14 (1.00) |
0.184 (1.00) |
0.753 (1.00) |
0.429 (1.00) |
| 2q gain | 7 (6%) | 107 |
0.469 (1.00) |
0.313 (1.00) |
1 (1.00) |
0.265 (1.00) |
| 3p gain | 12 (11%) | 102 |
0.965 (1.00) |
0.0945 (1.00) |
1 (1.00) |
0.191 (1.00) |
| 3q gain | 11 (10%) | 103 |
0.916 (1.00) |
0.00875 (1.00) |
0.752 (1.00) |
0.349 (1.00) |
| 4p gain | 23 (20%) | 91 |
0.554 (1.00) |
0.84 (1.00) |
0.159 (1.00) |
0.0918 (1.00) |
| 4q gain | 17 (15%) | 97 |
0.797 (1.00) |
0.333 (1.00) |
0.795 (1.00) |
0.269 (1.00) |
| 5p gain | 36 (32%) | 78 |
0.397 (1.00) |
0.0953 (1.00) |
0.419 (1.00) |
0.206 (1.00) |
| 5q gain | 30 (26%) | 84 |
0.224 (1.00) |
0.526 (1.00) |
0.0558 (1.00) |
0.103 (1.00) |
| 6p gain | 22 (19%) | 92 |
0.203 (1.00) |
0.00108 (0.339) |
0.353 (1.00) |
0.553 (1.00) |
| 6q gain | 21 (18%) | 93 |
0.457 (1.00) |
0.00673 (1.00) |
0.813 (1.00) |
0.576 (1.00) |
| 8p gain | 25 (22%) | 89 |
0.00252 (0.777) |
0.489 (1.00) |
0.364 (1.00) |
0.00818 (1.00) |
| 8q gain | 29 (25%) | 85 |
0.00332 (1.00) |
0.609 (1.00) |
0.198 (1.00) |
0.0224 (1.00) |
| 9p gain | 19 (17%) | 95 |
0.101 (1.00) |
0.005 (1.00) |
0.805 (1.00) |
1 (1.00) |
| 10p gain | 10 (9%) | 104 |
0.0692 (1.00) |
0.253 (1.00) |
0.753 (1.00) |
0.703 (1.00) |
| 10q gain | 4 (4%) | 110 |
0.00128 (0.401) |
0.584 (1.00) |
0.33 (1.00) |
1 (1.00) |
| 11p gain | 6 (5%) | 108 |
0.00427 (1.00) |
0.00179 (0.556) |
0.217 (1.00) |
1 (1.00) |
| 11q gain | 5 (4%) | 109 |
0.301 (1.00) |
0.58 (1.00) |
0.374 (1.00) |
1 (1.00) |
| 12q gain | 8 (7%) | 106 |
0.381 (1.00) |
0.0107 (1.00) |
0.726 (1.00) |
0.028 (1.00) |
| 13q gain | 6 (5%) | 108 |
0.75 (1.00) |
0.22 (1.00) |
0.217 (1.00) |
0.0762 (1.00) |
| 14q gain | 21 (18%) | 93 |
0.0361 (1.00) |
0.637 (1.00) |
0.813 (1.00) |
0.727 (1.00) |
| 15q gain | 29 (25%) | 85 |
0.0919 (1.00) |
0.146 (1.00) |
0.0853 (1.00) |
0.761 (1.00) |
| 16p gain | 17 (15%) | 97 |
0.0069 (1.00) |
0.176 (1.00) |
0.795 (1.00) |
0.309 (1.00) |
| 16q gain | 6 (5%) | 108 |
0.839 (1.00) |
0.469 (1.00) |
1 (1.00) |
1 (1.00) |
| 17p gain | 22 (19%) | 92 |
0.0781 (1.00) |
0.0245 (1.00) |
1 (1.00) |
0.197 (1.00) |
| 17q gain | 16 (14%) | 98 |
0.436 (1.00) |
0.0752 (1.00) |
0.0287 (1.00) |
0.0914 (1.00) |
| 18p gain | 17 (15%) | 97 |
0.473 (1.00) |
0.0541 (1.00) |
0.434 (1.00) |
0.806 (1.00) |
| 18q gain | 16 (14%) | 98 |
0.472 (1.00) |
0.00573 (1.00) |
0.282 (1.00) |
0.789 (1.00) |
| 19p gain | 33 (29%) | 81 |
0.0252 (1.00) |
0.00982 (1.00) |
1 (1.00) |
0.345 (1.00) |
| 19q gain | 22 (19%) | 92 |
0.668 (1.00) |
0.00221 (0.685) |
0.643 (1.00) |
0.411 (1.00) |
| 20p gain | 28 (25%) | 86 |
0.112 (1.00) |
0.0574 (1.00) |
1 (1.00) |
0.863 (1.00) |
| 20q gain | 35 (31%) | 79 |
0.195 (1.00) |
0.0451 (1.00) |
0.689 (1.00) |
0.6 (1.00) |
| 21q gain | 26 (23%) | 88 |
0.0823 (1.00) |
0.0892 (1.00) |
0.658 (1.00) |
0.16 (1.00) |
| 22q gain | 26 (23%) | 88 |
0.106 (1.00) |
0.123 (1.00) |
0.116 (1.00) |
0.165 (1.00) |
| xq gain | 14 (12%) | 100 |
0.767 (1.00) |
0.955 (1.00) |
1 (1.00) |
1 (1.00) |
| 1p loss | 16 (14%) | 98 |
0.0365 (1.00) |
0.302 (1.00) |
0.0287 (1.00) |
0.115 (1.00) |
| 1q loss | 16 (14%) | 98 |
0.466 (1.00) |
0.692 (1.00) |
0.282 (1.00) |
1 (1.00) |
| 2p loss | 32 (28%) | 82 |
0.816 (1.00) |
0.0884 (1.00) |
0.148 (1.00) |
0.517 (1.00) |
| 2q loss | 27 (24%) | 87 |
0.00267 (0.824) |
0.023 (1.00) |
0.66 (1.00) |
0.154 (1.00) |
| 3p loss | 20 (18%) | 94 |
0.0172 (1.00) |
0.3 (1.00) |
0.46 (1.00) |
1 (1.00) |
| 3q loss | 24 (21%) | 90 |
0.0753 (1.00) |
0.472 (1.00) |
0.366 (1.00) |
0.854 (1.00) |
| 4p loss | 18 (16%) | 96 |
0.0347 (1.00) |
0.658 (1.00) |
1 (1.00) |
0.199 (1.00) |
| 4q loss | 22 (19%) | 92 |
0.74 (1.00) |
0.442 (1.00) |
0.353 (1.00) |
0.351 (1.00) |
| 5p loss | 9 (8%) | 105 |
0.175 (1.00) |
0.764 (1.00) |
1 (1.00) |
1 (1.00) |
| 5q loss | 15 (13%) | 99 |
0.366 (1.00) |
0.361 (1.00) |
0.783 (1.00) |
1 (1.00) |
| 6p loss | 28 (25%) | 86 |
0.156 (1.00) |
0.664 (1.00) |
0.828 (1.00) |
0.163 (1.00) |
| 6q loss | 17 (15%) | 97 |
0.471 (1.00) |
0.09 (1.00) |
0.19 (1.00) |
0.426 (1.00) |
| 7p loss | 16 (14%) | 98 |
0.41 (1.00) |
0.948 (1.00) |
0.18 (1.00) |
0.311 (1.00) |
| 7q loss | 14 (12%) | 100 |
0.023 (1.00) |
0.789 (1.00) |
0.401 (1.00) |
1 (1.00) |
| 8p loss | 24 (21%) | 90 |
0.97 (1.00) |
0.465 (1.00) |
0.49 (1.00) |
0.708 (1.00) |
| 8q loss | 14 (12%) | 100 |
0.962 (1.00) |
0.158 (1.00) |
0.253 (1.00) |
0.271 (1.00) |
| 9p loss | 34 (30%) | 80 |
0.887 (1.00) |
0.0301 (1.00) |
0.411 (1.00) |
0.773 (1.00) |
| 9q loss | 23 (20%) | 91 |
0.128 (1.00) |
0.349 (1.00) |
0.64 (1.00) |
0.158 (1.00) |
| 10p loss | 52 (46%) | 62 |
0.657 (1.00) |
0.0224 (1.00) |
0.0013 (0.406) |
0.458 (1.00) |
| 11p loss | 44 (39%) | 70 |
0.513 (1.00) |
0.0309 (1.00) |
0.704 (1.00) |
0.698 (1.00) |
| 11q loss | 36 (32%) | 78 |
0.413 (1.00) |
0.0715 (1.00) |
0.842 (1.00) |
1 (1.00) |
| 12p loss | 25 (22%) | 89 |
0.828 (1.00) |
0.848 (1.00) |
1 (1.00) |
0.421 (1.00) |
| 12q loss | 26 (23%) | 88 |
0.477 (1.00) |
0.884 (1.00) |
0.263 (1.00) |
0.421 (1.00) |
| 13q loss | 55 (48%) | 59 |
0.373 (1.00) |
0.0279 (1.00) |
0.0625 (1.00) |
1 (1.00) |
| 14q loss | 30 (26%) | 84 |
0.0832 (1.00) |
0.76 (1.00) |
0.526 (1.00) |
1 (1.00) |
| 15q loss | 17 (15%) | 97 |
0.0517 (1.00) |
0.469 (1.00) |
0.795 (1.00) |
1 (1.00) |
| 16p loss | 33 (29%) | 81 |
0.613 (1.00) |
0.299 (1.00) |
0.0136 (1.00) |
0.533 (1.00) |
| 16q loss | 59 (52%) | 55 |
0.548 (1.00) |
0.0477 (1.00) |
0.0381 (1.00) |
1 (1.00) |
| 17p loss | 22 (19%) | 92 |
0.742 (1.00) |
0.356 (1.00) |
1 (1.00) |
0.724 (1.00) |
| 17q loss | 22 (19%) | 92 |
0.318 (1.00) |
0.336 (1.00) |
0.643 (1.00) |
0.726 (1.00) |
| 18p loss | 27 (24%) | 87 |
0.214 (1.00) |
0.61 (1.00) |
0.0767 (1.00) |
0.537 (1.00) |
| 18q loss | 28 (25%) | 86 |
0.0936 (1.00) |
0.182 (1.00) |
0.277 (1.00) |
0.639 (1.00) |
| 19p loss | 7 (6%) | 107 |
0.697 (1.00) |
0.108 (1.00) |
0.452 (1.00) |
0.376 (1.00) |
| 19q loss | 17 (15%) | 97 |
0.266 (1.00) |
0.0759 (1.00) |
1 (1.00) |
0.335 (1.00) |
| 20p loss | 18 (16%) | 96 |
0.761 (1.00) |
0.0985 (1.00) |
0.612 (1.00) |
0.726 (1.00) |
| 20q loss | 8 (7%) | 106 |
0.369 (1.00) |
0.0411 (1.00) |
1 (1.00) |
0.702 (1.00) |
| 21q loss | 19 (17%) | 95 |
0.119 (1.00) |
0.0934 (1.00) |
0.457 (1.00) |
0.407 (1.00) |
| 22q loss | 33 (29%) | 81 |
0.712 (1.00) |
0.16 (1.00) |
0.221 (1.00) |
0.755 (1.00) |
| xq loss | 42 (37%) | 72 |
0.765 (1.00) |
0.563 (1.00) |
0.0527 (1.00) |
0.708 (1.00) |
P value = 2.39e-05 (Wilcoxon-test), Q value = 0.0076
Table S1. Gene #13: '7p gain' versus Clinical Feature #2: 'AGE'
| nPatients | Mean (Std.Dev) | |
|---|---|---|
| ALL | 114 | 61.3 (14.1) |
| 7P GAIN MUTATED | 29 | 70.2 (10.9) |
| 7P GAIN WILD-TYPE | 85 | 58.2 (13.8) |
Figure S1. Get High-res Image Gene #13: '7p gain' versus Clinical Feature #2: 'AGE'
P value = 1.53e-06 (Wilcoxon-test), Q value = 0.00049
Table S2. Gene #14: '7q gain' versus Clinical Feature #2: 'AGE'
| nPatients | Mean (Std.Dev) | |
|---|---|---|
| ALL | 114 | 61.3 (14.1) |
| 7Q GAIN MUTATED | 25 | 72.3 (9.6) |
| 7Q GAIN WILD-TYPE | 89 | 58.2 (13.6) |
Figure S2. Get High-res Image Gene #14: '7q gain' versus Clinical Feature #2: 'AGE'
P value = 0.000127 (Wilcoxon-test), Q value = 0.04
Table S3. Gene #18: '9q gain' versus Clinical Feature #2: 'AGE'
| nPatients | Mean (Std.Dev) | |
|---|---|---|
| ALL | 114 | 61.3 (14.1) |
| 9Q GAIN MUTATED | 26 | 69.9 (10.7) |
| 9Q GAIN WILD-TYPE | 88 | 58.7 (14.0) |
Figure S3. Get High-res Image Gene #18: '9q gain' versus Clinical Feature #2: 'AGE'
P value = 3.47e-05 (logrank test), Q value = 0.011
Table S4. Gene #23: '12p gain' versus Clinical Feature #1: 'Time to Death'
| nPatients | nDeath | Duration Range (Median), Month | |
|---|---|---|---|
| ALL | 114 | 36 | 0.1 - 143.4 (17.9) |
| 12P GAIN MUTATED | 13 | 8 | 0.1 - 37.5 (9.0) |
| 12P GAIN WILD-TYPE | 101 | 28 | 0.1 - 143.4 (18.2) |
Figure S4. Get High-res Image Gene #23: '12p gain' versus Clinical Feature #1: 'Time to Death'

P value = 7.76e-05 (Wilcoxon-test), Q value = 0.025
Table S5. Gene #23: '12p gain' versus Clinical Feature #2: 'AGE'
| nPatients | Mean (Std.Dev) | |
|---|---|---|
| ALL | 114 | 61.3 (14.1) |
| 12P GAIN MUTATED | 13 | 75.0 (9.1) |
| 12P GAIN WILD-TYPE | 101 | 59.5 (13.6) |
Figure S5. Get High-res Image Gene #23: '12p gain' versus Clinical Feature #2: 'AGE'
P value = 0.000144 (Fisher's exact test), Q value = 0.045
Table S6. Gene #60: '10q loss' versus Clinical Feature #3: 'GENDER'
| nPatients | FEMALE | MALE |
|---|---|---|
| ALL | 62 | 52 |
| 10Q LOSS MUTATED | 44 | 18 |
| 10Q LOSS WILD-TYPE | 18 | 34 |
Figure S6. Get High-res Image Gene #60: '10q loss' versus Clinical Feature #3: 'GENDER'
-
Copy number data file = transformed.cor.cli.txt
-
Clinical data file = SARC-TP.merged_data.txt
-
Number of patients = 114
-
Number of significantly arm-level cnvs = 80
-
Number of selected clinical features = 4
-
Exclude regions that fewer than K tumors have mutations, K = 3
For survival clinical features, the Kaplan-Meier survival curves of tumors with and without gene mutations were plotted and the statistical significance P values were estimated by logrank test (Bland and Altman 2004) using the 'survdiff' function in R
For binary or multi-class clinical features (nominal or ordinal), two-tailed Fisher's exact tests (Fisher 1922) were used to estimate the P values using the 'fisher.test' function in R
For multiple hypothesis correction, Q value is the False Discovery Rate (FDR) analogue of the P value (Benjamini and Hochberg 1995), defined as the minimum FDR at which the test may be called significant. We used the 'Benjamini and Hochberg' method of 'p.adjust' function in R to convert P values into Q values.
In addition to the links below, the full results of the analysis summarized in this report can also be downloaded programmatically using firehose_get, or interactively from either the Broad GDAC website or TCGA Data Coordination Center Portal.