This pipeline computes the correlation between significant copy number variation (cnv focal) genes and selected clinical features.
Testing the association between copy number variation 61 focal events and 4 clinical features across 114 patients, 3 significant findings detected with Q value < 0.25.
-
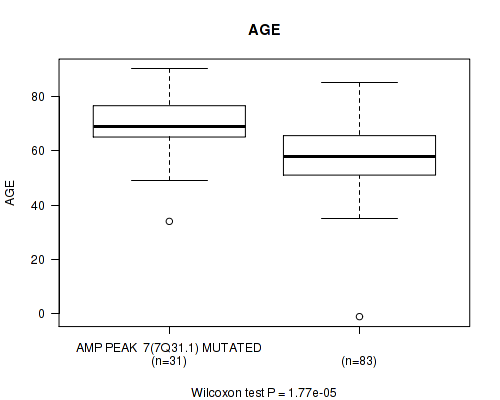
amp_7q31.1 cnv correlated to 'AGE'.
-
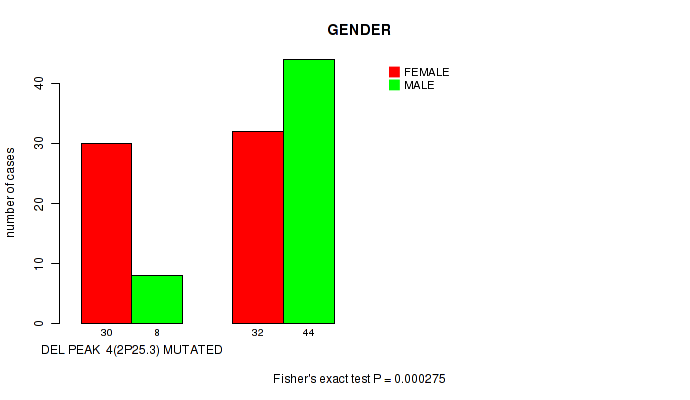
del_2p25.3 cnv correlated to 'GENDER'.
-
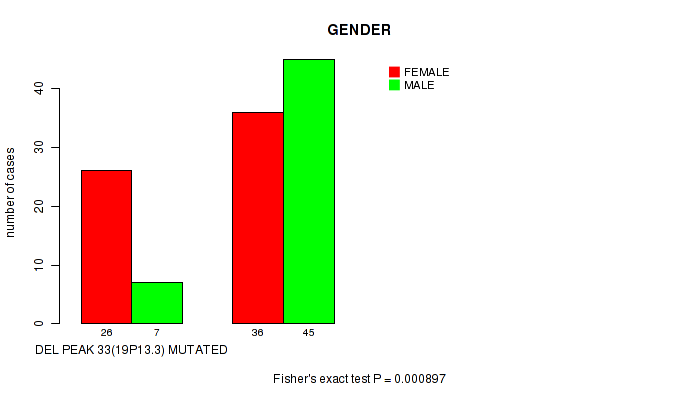
del_19p13.3 cnv correlated to 'GENDER'.
Table 1. Get Full Table Overview of the association between significant copy number variation of 61 focal events and 4 clinical features. Shown in the table are P values (Q values). Thresholded by Q value < 0.25, 3 significant findings detected.
|
Clinical Features |
Time to Death |
AGE | GENDER | RACE | ||
| nCNV (%) | nWild-Type | logrank test | Wilcoxon-test | Fisher's exact test | Fisher's exact test | |
| amp 7q31 1 | 31 (27%) | 83 |
0.371 (1.00) |
1.77e-05 (0.00433) |
1 (1.00) |
0.556 (1.00) |
| del 2p25 3 | 38 (33%) | 76 |
0.409 (1.00) |
0.145 (1.00) |
0.000275 (0.0668) |
0.429 (1.00) |
| del 19p13 3 | 33 (29%) | 81 |
0.321 (1.00) |
0.418 (1.00) |
0.000897 (0.217) |
1 (1.00) |
| amp 1p32 1 | 36 (32%) | 78 |
0.126 (1.00) |
0.52 (1.00) |
0.55 (1.00) |
0.461 (1.00) |
| amp 1q24 3 | 45 (39%) | 69 |
0.937 (1.00) |
0.4 (1.00) |
0.571 (1.00) |
0.898 (1.00) |
| amp 3p11 2 | 25 (22%) | 89 |
0.229 (1.00) |
0.0186 (1.00) |
0.502 (1.00) |
1 (1.00) |
| amp 5p15 2 | 47 (41%) | 67 |
0.0155 (1.00) |
0.0201 (1.00) |
0.252 (1.00) |
0.347 (1.00) |
| amp 6p21 1 | 26 (23%) | 88 |
0.119 (1.00) |
0.0102 (1.00) |
0.263 (1.00) |
0.438 (1.00) |
| amp 6q24 3 | 32 (28%) | 82 |
0.435 (1.00) |
0.0245 (1.00) |
0.209 (1.00) |
1 (1.00) |
| amp 8q21 12 | 42 (37%) | 72 |
0.0253 (1.00) |
0.124 (1.00) |
1 (1.00) |
0.138 (1.00) |
| amp 11q22 2 | 17 (15%) | 97 |
0.984 (1.00) |
0.968 (1.00) |
1 (1.00) |
0.746 (1.00) |
| amp 12p13 32 | 21 (18%) | 93 |
0.0961 (1.00) |
0.0897 (1.00) |
0.629 (1.00) |
1 (1.00) |
| amp 12p12 1 | 25 (22%) | 89 |
0.169 (1.00) |
0.00162 (0.391) |
1 (1.00) |
1 (1.00) |
| amp 12q15 | 46 (40%) | 68 |
0.68 (1.00) |
0.0888 (1.00) |
0.0233 (1.00) |
0.088 (1.00) |
| amp 13q34 | 19 (17%) | 95 |
0.333 (1.00) |
0.629 (1.00) |
0.0797 (1.00) |
0.315 (1.00) |
| amp 17p11 2 | 38 (33%) | 76 |
0.208 (1.00) |
0.151 (1.00) |
0.111 (1.00) |
0.374 (1.00) |
| amp 17q24 3 | 29 (25%) | 85 |
0.0114 (1.00) |
0.0805 (1.00) |
0.00227 (0.545) |
0.568 (1.00) |
| amp 19p13 2 | 39 (34%) | 75 |
0.829 (1.00) |
0.568 (1.00) |
0.694 (1.00) |
0.6 (1.00) |
| amp 19q12 | 37 (32%) | 77 |
0.131 (1.00) |
0.00866 (1.00) |
0.841 (1.00) |
1 (1.00) |
| amp 20q13 33 | 42 (37%) | 72 |
0.314 (1.00) |
0.0319 (1.00) |
0.0794 (1.00) |
0.886 (1.00) |
| amp 21q21 1 | 33 (29%) | 81 |
0.325 (1.00) |
0.0926 (1.00) |
0.534 (1.00) |
1 (1.00) |
| amp xp21 2 | 36 (32%) | 78 |
0.716 (1.00) |
0.985 (1.00) |
0.225 (1.00) |
0.676 (1.00) |
| amp xq21 2 | 18 (16%) | 96 |
0.0132 (1.00) |
0.807 (1.00) |
1 (1.00) |
0.773 (1.00) |
| del 1p36 32 | 36 (32%) | 78 |
0.0217 (1.00) |
0.37 (1.00) |
0.105 (1.00) |
0.7 (1.00) |
| del 1p32 3 | 18 (16%) | 96 |
0.0344 (1.00) |
0.547 (1.00) |
0.039 (1.00) |
0.0186 (1.00) |
| del 1q44 | 31 (27%) | 83 |
0.486 (1.00) |
0.42 (1.00) |
0.404 (1.00) |
0.485 (1.00) |
| del 2q37 3 | 41 (36%) | 73 |
0.0429 (1.00) |
0.561 (1.00) |
0.331 (1.00) |
0.793 (1.00) |
| del 2q37 3 | 43 (38%) | 71 |
0.216 (1.00) |
0.33 (1.00) |
0.179 (1.00) |
0.798 (1.00) |
| del 3p21 31 | 21 (18%) | 93 |
0.257 (1.00) |
0.0143 (1.00) |
0.478 (1.00) |
0.048 (1.00) |
| del 3q29 | 26 (23%) | 88 |
0.351 (1.00) |
0.723 (1.00) |
0.658 (1.00) |
0.613 (1.00) |
| del 4q35 1 | 38 (33%) | 76 |
0.114 (1.00) |
0.0635 (1.00) |
0.691 (1.00) |
0.206 (1.00) |
| del 6p25 1 | 40 (35%) | 74 |
0.731 (1.00) |
0.445 (1.00) |
0.433 (1.00) |
0.181 (1.00) |
| del 6q14 1 | 26 (23%) | 88 |
0.115 (1.00) |
0.845 (1.00) |
0.824 (1.00) |
0.657 (1.00) |
| del 6q16 1 | 23 (20%) | 91 |
0.385 (1.00) |
0.385 (1.00) |
0.349 (1.00) |
0.729 (1.00) |
| del 7q36 3 | 25 (22%) | 89 |
0.221 (1.00) |
0.468 (1.00) |
0.823 (1.00) |
0.353 (1.00) |
| del 8p23 3 | 34 (30%) | 80 |
0.508 (1.00) |
0.906 (1.00) |
0.546 (1.00) |
1 (1.00) |
| del 9p23 | 37 (32%) | 77 |
0.81 (1.00) |
0.0437 (1.00) |
0.548 (1.00) |
1 (1.00) |
| del 9p21 3 | 47 (41%) | 67 |
0.764 (1.00) |
0.0097 (1.00) |
0.445 (1.00) |
0.484 (1.00) |
| del 9q34 3 | 27 (24%) | 87 |
0.0374 (1.00) |
0.936 (1.00) |
0.379 (1.00) |
0.0551 (1.00) |
| del 10p15 3 | 58 (51%) | 56 |
0.579 (1.00) |
0.372 (1.00) |
0.132 (1.00) |
0.712 (1.00) |
| del 10q23 31 | 64 (56%) | 50 |
0.298 (1.00) |
0.587 (1.00) |
0.00813 (1.00) |
0.38 (1.00) |
| del 11p15 5 | 47 (41%) | 67 |
0.287 (1.00) |
0.00508 (1.00) |
0.703 (1.00) |
0.624 (1.00) |
| del 11q24 3 | 46 (40%) | 68 |
0.138 (1.00) |
0.0117 (1.00) |
0.451 (1.00) |
0.63 (1.00) |
| del 12p13 1 | 33 (29%) | 81 |
0.843 (1.00) |
0.628 (1.00) |
0.3 (1.00) |
1 (1.00) |
| del 12q12 | 22 (19%) | 92 |
0.899 (1.00) |
0.682 (1.00) |
1 (1.00) |
0.67 (1.00) |
| del 13q14 2 | 79 (69%) | 35 |
0.129 (1.00) |
0.0137 (1.00) |
0.0445 (1.00) |
0.271 (1.00) |
| del 14q24 1 | 37 (32%) | 77 |
0.153 (1.00) |
0.781 (1.00) |
0.548 (1.00) |
1 (1.00) |
| del 15q11 2 | 19 (17%) | 95 |
0.396 (1.00) |
0.164 (1.00) |
0.0797 (1.00) |
0.594 (1.00) |
| del 16q12 1 | 63 (55%) | 51 |
0.151 (1.00) |
0.266 (1.00) |
0.038 (1.00) |
0.891 (1.00) |
| del 16q23 1 | 64 (56%) | 50 |
0.298 (1.00) |
0.049 (1.00) |
0.0593 (1.00) |
1 (1.00) |
| del 17p13 1 | 50 (44%) | 64 |
0.897 (1.00) |
0.664 (1.00) |
0.0371 (1.00) |
0.717 (1.00) |
| del 17q11 2 | 28 (25%) | 86 |
0.129 (1.00) |
0.323 (1.00) |
0.828 (1.00) |
1 (1.00) |
| del 17q25 3 | 29 (25%) | 85 |
0.31 (1.00) |
0.158 (1.00) |
0.282 (1.00) |
0.413 (1.00) |
| del 18q23 | 35 (31%) | 79 |
0.34 (1.00) |
0.0147 (1.00) |
0.541 (1.00) |
0.764 (1.00) |
| del 19q13 43 | 41 (36%) | 73 |
0.704 (1.00) |
0.694 (1.00) |
0.0793 (1.00) |
0.552 (1.00) |
| del 21q11 2 | 20 (18%) | 94 |
0.944 (1.00) |
0.293 (1.00) |
0.629 (1.00) |
0.173 (1.00) |
| del 21q22 3 | 31 (27%) | 83 |
0.69 (1.00) |
0.00334 (0.799) |
0.677 (1.00) |
1 (1.00) |
| del 22q13 31 | 38 (33%) | 76 |
0.443 (1.00) |
0.449 (1.00) |
0.0458 (1.00) |
0.531 (1.00) |
| del xp22 33 | 35 (31%) | 79 |
0.157 (1.00) |
0.0337 (1.00) |
0.153 (1.00) |
0.468 (1.00) |
| del xq21 1 | 57 (50%) | 57 |
0.198 (1.00) |
0.215 (1.00) |
0.0141 (1.00) |
0.628 (1.00) |
| del xq27 1 | 57 (50%) | 57 |
0.501 (1.00) |
0.881 (1.00) |
0.0381 (1.00) |
0.4 (1.00) |
P value = 1.77e-05 (Wilcoxon-test), Q value = 0.0043
Table S1. Gene #7: 'amp_7q31.1' versus Clinical Feature #2: 'AGE'
| nPatients | Mean (Std.Dev) | |
|---|---|---|
| ALL | 114 | 61.3 (14.1) |
| AMP PEAK 7(7Q31.1) MUTATED | 31 | 69.6 (11.4) |
| AMP PEAK 7(7Q31.1) WILD-TYPE | 83 | 58.2 (13.8) |
Figure S1. Get High-res Image Gene #7: 'amp_7q31.1' versus Clinical Feature #2: 'AGE'
P value = 0.000275 (Fisher's exact test), Q value = 0.067
Table S2. Gene #25: 'del_2p25.3' versus Clinical Feature #3: 'GENDER'
| nPatients | FEMALE | MALE |
|---|---|---|
| ALL | 62 | 52 |
| DEL PEAK 4(2P25.3) MUTATED | 30 | 8 |
| DEL PEAK 4(2P25.3) WILD-TYPE | 32 | 44 |
Figure S2. Get High-res Image Gene #25: 'del_2p25.3' versus Clinical Feature #3: 'GENDER'
P value = 0.000897 (Fisher's exact test), Q value = 0.22
Table S3. Gene #54: 'del_19p13.3' versus Clinical Feature #3: 'GENDER'
| nPatients | FEMALE | MALE |
|---|---|---|
| ALL | 62 | 52 |
| DEL PEAK 33(19P13.3) MUTATED | 26 | 7 |
| DEL PEAK 33(19P13.3) WILD-TYPE | 36 | 45 |
Figure S3. Get High-res Image Gene #54: 'del_19p13.3' versus Clinical Feature #3: 'GENDER'
-
Copy number data file = transformed.cor.cli.txt
-
Clinical data file = SARC-TP.merged_data.txt
-
Number of patients = 114
-
Number of significantly focal cnvs = 61
-
Number of selected clinical features = 4
-
Exclude genes that fewer than K tumors have mutations, K = 3
For survival clinical features, the Kaplan-Meier survival curves of tumors with and without gene mutations were plotted and the statistical significance P values were estimated by logrank test (Bland and Altman 2004) using the 'survdiff' function in R
For binary or multi-class clinical features (nominal or ordinal), two-tailed Fisher's exact tests (Fisher 1922) were used to estimate the P values using the 'fisher.test' function in R
For multiple hypothesis correction, Q value is the False Discovery Rate (FDR) analogue of the P value (Benjamini and Hochberg 1995), defined as the minimum FDR at which the test may be called significant. We used the 'Benjamini and Hochberg' method of 'p.adjust' function in R to convert P values into Q values.
In addition to the links below, the full results of the analysis summarized in this report can also be downloaded programmatically using firehose_get, or interactively from either the Broad GDAC website or TCGA Data Coordination Center Portal.