This pipeline computes the correlation between significant arm-level copy number variations (cnvs) and selected clinical features.
Testing the association between copy number variation 80 arm-level events and 8 clinical features across 90 patients, 3 significant findings detected with Q value < 0.25.
-
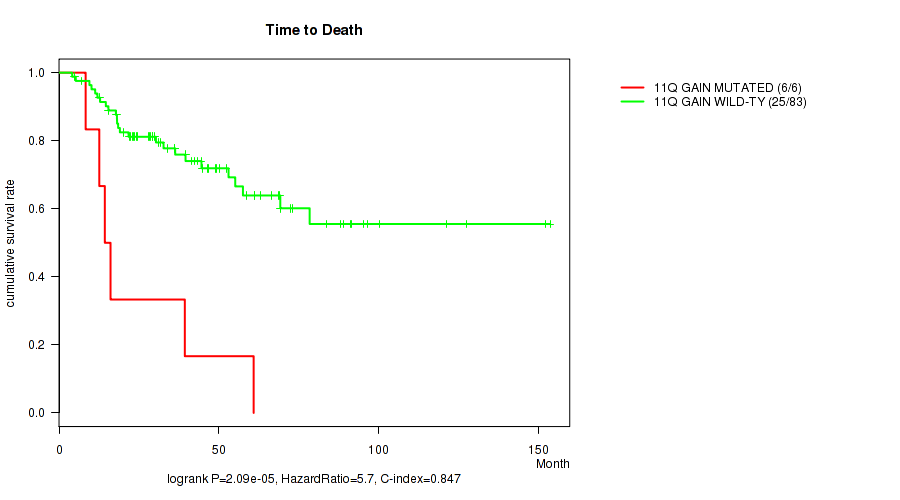
11q gain cnv correlated to 'Time to Death'.
-
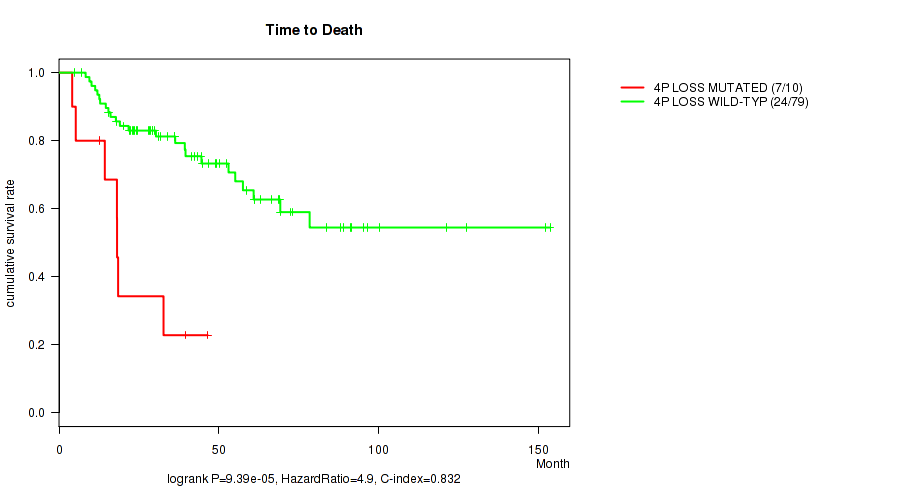
4p loss cnv correlated to 'Time to Death'.
-
4q loss cnv correlated to 'Time to Death'.
Table 1. Get Full Table Overview of the association between significant copy number variation of 80 arm-level events and 8 clinical features. Shown in the table are P values (Q values). Thresholded by Q value < 0.25, 3 significant findings detected.
|
Clinical Features |
Time to Death |
AGE |
NEOPLASM DISEASESTAGE |
PATHOLOGY T STAGE |
PATHOLOGY N STAGE |
GENDER | RACE | ETHNICITY | ||
| nCNV (%) | nWild-Type | logrank test | Wilcoxon-test | Fisher's exact test | Fisher's exact test | Fisher's exact test | Fisher's exact test | Fisher's exact test | Fisher's exact test | |
| 11q gain | 6 (7%) | 84 |
2.09e-05 (0.0134) |
0.698 (1.00) |
0.121 (1.00) |
0.0627 (1.00) |
1 (1.00) |
0.66 (1.00) |
1 (1.00) |
1 (1.00) |
| 4p loss | 10 (11%) | 80 |
9.39e-05 (0.0599) |
0.542 (1.00) |
0.018 (1.00) |
0.00341 (1.00) |
1 (1.00) |
1 (1.00) |
1 (1.00) |
1 (1.00) |
| 4q loss | 11 (12%) | 79 |
1.17e-05 (0.00748) |
0.805 (1.00) |
0.0233 (1.00) |
0.00634 (1.00) |
1 (1.00) |
0.742 (1.00) |
1 (1.00) |
1 (1.00) |
| 1p gain | 4 (4%) | 86 |
0.095 (1.00) |
0.487 (1.00) |
1 (1.00) |
0.744 (1.00) |
1 (1.00) |
0.294 (1.00) |
0.146 (1.00) |
1 (1.00) |
| 1q gain | 8 (9%) | 82 |
0.0324 (1.00) |
0.798 (1.00) |
0.734 (1.00) |
0.453 (1.00) |
0.589 (1.00) |
0.047 (1.00) |
0.246 (1.00) |
0.557 (1.00) |
| 2p gain | 13 (14%) | 77 |
0.000969 (0.615) |
0.818 (1.00) |
0.377 (1.00) |
0.143 (1.00) |
0.347 (1.00) |
0.205 (1.00) |
0.17 (1.00) |
0.59 (1.00) |
| 2q gain | 12 (13%) | 78 |
0.0316 (1.00) |
0.767 (1.00) |
0.155 (1.00) |
0.239 (1.00) |
1 (1.00) |
0.0516 (1.00) |
0.17 (1.00) |
0.651 (1.00) |
| 3p gain | 13 (14%) | 77 |
0.292 (1.00) |
0.323 (1.00) |
0.586 (1.00) |
0.929 (1.00) |
1 (1.00) |
0.759 (1.00) |
1 (1.00) |
1 (1.00) |
| 3q gain | 15 (17%) | 75 |
0.409 (1.00) |
0.423 (1.00) |
0.334 (1.00) |
0.758 (1.00) |
0.677 (1.00) |
1 (1.00) |
1 (1.00) |
1 (1.00) |
| 4p gain | 37 (41%) | 53 |
0.233 (1.00) |
0.941 (1.00) |
0.792 (1.00) |
0.842 (1.00) |
1 (1.00) |
0.654 (1.00) |
1 (1.00) |
0.41 (1.00) |
| 4q gain | 33 (37%) | 57 |
0.118 (1.00) |
0.97 (1.00) |
0.961 (1.00) |
0.93 (1.00) |
1 (1.00) |
0.495 (1.00) |
1 (1.00) |
0.661 (1.00) |
| 5p gain | 57 (63%) | 33 |
0.353 (1.00) |
0.854 (1.00) |
0.692 (1.00) |
0.893 (1.00) |
1 (1.00) |
1 (1.00) |
1 (1.00) |
0.132 (1.00) |
| 5q gain | 53 (59%) | 37 |
0.633 (1.00) |
0.62 (1.00) |
0.567 (1.00) |
0.796 (1.00) |
1 (1.00) |
1 (1.00) |
0.18 (1.00) |
0.113 (1.00) |
| 6p gain | 18 (20%) | 72 |
0.531 (1.00) |
0.0275 (1.00) |
0.5 (1.00) |
0.253 (1.00) |
0.679 (1.00) |
0.588 (1.00) |
0.0911 (1.00) |
0.0593 (1.00) |
| 6q gain | 16 (18%) | 74 |
0.912 (1.00) |
0.2 (1.00) |
0.115 (1.00) |
0.174 (1.00) |
0.2 (1.00) |
0.399 (1.00) |
0.0578 (1.00) |
0.618 (1.00) |
| 7p gain | 48 (53%) | 42 |
0.891 (1.00) |
0.51 (1.00) |
0.167 (1.00) |
0.23 (1.00) |
0.336 (1.00) |
1 (1.00) |
0.217 (1.00) |
0.269 (1.00) |
| 7q gain | 48 (53%) | 42 |
0.535 (1.00) |
0.859 (1.00) |
0.107 (1.00) |
0.223 (1.00) |
0.336 (1.00) |
1 (1.00) |
0.215 (1.00) |
0.113 (1.00) |
| 8p gain | 32 (36%) | 58 |
0.304 (1.00) |
0.508 (1.00) |
0.443 (1.00) |
0.638 (1.00) |
0.484 (1.00) |
1 (1.00) |
0.289 (1.00) |
0.41 (1.00) |
| 8q gain | 38 (42%) | 52 |
0.913 (1.00) |
0.49 (1.00) |
0.344 (1.00) |
0.535 (1.00) |
0.51 (1.00) |
1 (1.00) |
0.342 (1.00) |
0.694 (1.00) |
| 9p gain | 20 (22%) | 70 |
0.206 (1.00) |
0.716 (1.00) |
0.0598 (1.00) |
0.327 (1.00) |
0.00792 (1.00) |
0.791 (1.00) |
1 (1.00) |
0.382 (1.00) |
| 9q gain | 29 (32%) | 61 |
0.0276 (1.00) |
0.663 (1.00) |
0.0384 (1.00) |
0.0895 (1.00) |
0.013 (1.00) |
0.477 (1.00) |
1 (1.00) |
0.427 (1.00) |
| 10p gain | 25 (28%) | 65 |
0.0161 (1.00) |
0.397 (1.00) |
0.00608 (1.00) |
0.0162 (1.00) |
1 (1.00) |
1 (1.00) |
1 (1.00) |
0.427 (1.00) |
| 10q gain | 26 (29%) | 64 |
0.00745 (1.00) |
0.266 (1.00) |
0.00152 (0.964) |
0.00562 (1.00) |
1 (1.00) |
1 (1.00) |
1 (1.00) |
0.427 (1.00) |
| 11p gain | 5 (6%) | 85 |
0.00455 (1.00) |
0.364 (1.00) |
0.158 (1.00) |
0.042 (1.00) |
1 (1.00) |
0.656 (1.00) |
1 (1.00) |
0.568 (1.00) |
| 12p gain | 64 (71%) | 26 |
0.985 (1.00) |
0.287 (1.00) |
0.703 (1.00) |
0.61 (1.00) |
1 (1.00) |
0.464 (1.00) |
0.65 (1.00) |
0.0868 (1.00) |
| 12q gain | 64 (71%) | 26 |
0.971 (1.00) |
0.415 (1.00) |
0.701 (1.00) |
0.651 (1.00) |
0.718 (1.00) |
0.464 (1.00) |
0.0825 (1.00) |
0.0868 (1.00) |
| 13q gain | 6 (7%) | 84 |
0.946 (1.00) |
0.651 (1.00) |
0.732 (1.00) |
0.72 (1.00) |
0.526 (1.00) |
1 (1.00) |
1 (1.00) |
0.557 (1.00) |
| 14q gain | 21 (23%) | 69 |
0.161 (1.00) |
0.426 (1.00) |
0.181 (1.00) |
0.313 (1.00) |
0.241 (1.00) |
0.606 (1.00) |
1 (1.00) |
0.382 (1.00) |
| 15q gain | 11 (12%) | 79 |
0.95 (1.00) |
0.46 (1.00) |
0.796 (1.00) |
0.715 (1.00) |
1 (1.00) |
1 (1.00) |
1 (1.00) |
1 (1.00) |
| 16p gain | 49 (54%) | 41 |
0.362 (1.00) |
0.576 (1.00) |
0.592 (1.00) |
0.289 (1.00) |
1 (1.00) |
0.187 (1.00) |
0.726 (1.00) |
0.443 (1.00) |
| 16q gain | 47 (52%) | 43 |
0.19 (1.00) |
0.929 (1.00) |
0.833 (1.00) |
0.613 (1.00) |
1 (1.00) |
0.269 (1.00) |
0.114 (1.00) |
0.699 (1.00) |
| 17p gain | 5 (6%) | 85 |
0.956 (1.00) |
0.622 (1.00) |
0.159 (1.00) |
0.11 (1.00) |
1 (1.00) |
1 (1.00) |
0.145 (1.00) |
0.452 (1.00) |
| 17q gain | 7 (8%) | 83 |
0.442 (1.00) |
0.488 (1.00) |
0.691 (1.00) |
0.469 (1.00) |
1 (1.00) |
1 (1.00) |
1 (1.00) |
0.557 (1.00) |
| 18p gain | 6 (7%) | 84 |
0.137 (1.00) |
0.452 (1.00) |
0.343 (1.00) |
0.33 (1.00) |
1 (1.00) |
1 (1.00) |
0.214 (1.00) |
1 (1.00) |
| 18q gain | 5 (6%) | 85 |
0.327 (1.00) |
0.833 (1.00) |
0.831 (1.00) |
0.286 (1.00) |
1 (1.00) |
0.656 (1.00) |
0.181 (1.00) |
0.568 (1.00) |
| 19p gain | 56 (62%) | 34 |
0.422 (1.00) |
0.119 (1.00) |
0.178 (1.00) |
0.202 (1.00) |
0.737 (1.00) |
0.821 (1.00) |
1 (1.00) |
0.132 (1.00) |
| 19q gain | 52 (58%) | 38 |
0.46 (1.00) |
0.0203 (1.00) |
0.2 (1.00) |
0.328 (1.00) |
0.182 (1.00) |
0.378 (1.00) |
1 (1.00) |
0.132 (1.00) |
| 20p gain | 46 (51%) | 44 |
0.12 (1.00) |
0.495 (1.00) |
0.339 (1.00) |
0.796 (1.00) |
1 (1.00) |
0.188 (1.00) |
0.492 (1.00) |
1 (1.00) |
| 20q gain | 49 (54%) | 41 |
0.533 (1.00) |
0.964 (1.00) |
0.317 (1.00) |
0.858 (1.00) |
0.336 (1.00) |
0.187 (1.00) |
0.215 (1.00) |
0.705 (1.00) |
| 21q gain | 31 (34%) | 59 |
0.706 (1.00) |
0.154 (1.00) |
0.936 (1.00) |
0.94 (1.00) |
0.0836 (1.00) |
0.818 (1.00) |
0.273 (1.00) |
0.452 (1.00) |
| 22q gain | 3 (3%) | 87 |
0.117 (1.00) |
0.208 (1.00) |
1 (1.00) |
1 (1.00) |
0.307 (1.00) |
1 (1.00) |
1 (1.00) |
1 (1.00) |
| xq gain | 40 (44%) | 50 |
0.538 (1.00) |
0.929 (1.00) |
0.656 (1.00) |
0.973 (1.00) |
0.336 (1.00) |
0.658 (1.00) |
0.33 (1.00) |
0.252 (1.00) |
| 1p loss | 29 (32%) | 61 |
0.994 (1.00) |
0.866 (1.00) |
0.957 (1.00) |
0.951 (1.00) |
1 (1.00) |
1 (1.00) |
1 (1.00) |
1 (1.00) |
| 1q loss | 20 (22%) | 70 |
0.744 (1.00) |
0.317 (1.00) |
0.563 (1.00) |
0.746 (1.00) |
0.445 (1.00) |
0.599 (1.00) |
1 (1.00) |
1 (1.00) |
| 2p loss | 17 (19%) | 73 |
0.0408 (1.00) |
0.442 (1.00) |
1 (1.00) |
0.722 (1.00) |
1 (1.00) |
0.576 (1.00) |
1 (1.00) |
1 (1.00) |
| 2q loss | 15 (17%) | 75 |
0.0743 (1.00) |
0.689 (1.00) |
0.617 (1.00) |
0.759 (1.00) |
1 (1.00) |
0.767 (1.00) |
1 (1.00) |
1 (1.00) |
| 3p loss | 20 (22%) | 70 |
0.0773 (1.00) |
0.614 (1.00) |
0.0922 (1.00) |
0.344 (1.00) |
1 (1.00) |
0.293 (1.00) |
1 (1.00) |
1 (1.00) |
| 3q loss | 20 (22%) | 70 |
0.134 (1.00) |
0.907 (1.00) |
0.177 (1.00) |
0.562 (1.00) |
1 (1.00) |
0.599 (1.00) |
0.251 (1.00) |
0.286 (1.00) |
| 5p loss | 8 (9%) | 82 |
0.129 (1.00) |
0.676 (1.00) |
0.187 (1.00) |
0.148 (1.00) |
1 (1.00) |
1 (1.00) |
1 (1.00) |
0.557 (1.00) |
| 5q loss | 7 (8%) | 83 |
0.55 (1.00) |
0.342 (1.00) |
0.0749 (1.00) |
0.144 (1.00) |
0.584 (1.00) |
0.228 (1.00) |
1 (1.00) |
1 (1.00) |
| 6p loss | 19 (21%) | 71 |
0.0914 (1.00) |
0.35 (1.00) |
0.0833 (1.00) |
0.148 (1.00) |
0.445 (1.00) |
1 (1.00) |
1 (1.00) |
0.572 (1.00) |
| 6q loss | 22 (24%) | 68 |
0.0616 (1.00) |
0.254 (1.00) |
0.00668 (1.00) |
0.0181 (1.00) |
0.706 (1.00) |
0.453 (1.00) |
1 (1.00) |
1 (1.00) |
| 7p loss | 5 (6%) | 85 |
0.0757 (1.00) |
0.718 (1.00) |
0.335 (1.00) |
0.286 (1.00) |
1 (1.00) |
0.0461 (1.00) |
1 (1.00) |
1 (1.00) |
| 7q loss | 6 (7%) | 84 |
0.012 (1.00) |
0.61 (1.00) |
0.0374 (1.00) |
0.0191 (1.00) |
1 (1.00) |
0.411 (1.00) |
1 (1.00) |
1 (1.00) |
| 8p loss | 16 (18%) | 74 |
0.69 (1.00) |
0.768 (1.00) |
0.672 (1.00) |
0.97 (1.00) |
0.365 (1.00) |
1 (1.00) |
1 (1.00) |
1 (1.00) |
| 8q loss | 12 (13%) | 78 |
0.968 (1.00) |
0.639 (1.00) |
0.579 (1.00) |
1 (1.00) |
0.107 (1.00) |
0.534 (1.00) |
1 (1.00) |
1 (1.00) |
| 9p loss | 20 (22%) | 70 |
0.135 (1.00) |
0.506 (1.00) |
0.846 (1.00) |
0.62 (1.00) |
0.683 (1.00) |
0.599 (1.00) |
1 (1.00) |
0.651 (1.00) |
| 9q loss | 11 (12%) | 79 |
0.874 (1.00) |
0.427 (1.00) |
0.214 (1.00) |
0.426 (1.00) |
0.596 (1.00) |
1 (1.00) |
1 (1.00) |
0.568 (1.00) |
| 10p loss | 12 (13%) | 78 |
0.359 (1.00) |
0.934 (1.00) |
0.183 (1.00) |
1 (1.00) |
0.134 (1.00) |
1 (1.00) |
1 (1.00) |
0.452 (1.00) |
| 10q loss | 10 (11%) | 80 |
0.417 (1.00) |
0.298 (1.00) |
0.308 (1.00) |
0.712 (1.00) |
0.317 (1.00) |
1 (1.00) |
1 (1.00) |
1 (1.00) |
| 11p loss | 24 (27%) | 66 |
0.587 (1.00) |
0.722 (1.00) |
0.132 (1.00) |
0.601 (1.00) |
0.706 (1.00) |
0.455 (1.00) |
1 (1.00) |
1 (1.00) |
| 11q loss | 23 (26%) | 67 |
0.208 (1.00) |
0.563 (1.00) |
0.0269 (1.00) |
0.164 (1.00) |
1 (1.00) |
0.317 (1.00) |
1 (1.00) |
0.568 (1.00) |
| 12p loss | 5 (6%) | 85 |
0.188 (1.00) |
0.241 (1.00) |
0.33 (1.00) |
0.284 (1.00) |
1 (1.00) |
0.335 (1.00) |
1 (1.00) |
1 (1.00) |
| 12q loss | 4 (4%) | 86 |
0.0631 (1.00) |
0.463 (1.00) |
0.332 (1.00) |
0.285 (1.00) |
1 (1.00) |
0.606 (1.00) |
1 (1.00) |
1 (1.00) |
| 13q loss | 39 (43%) | 51 |
0.144 (1.00) |
0.536 (1.00) |
0.484 (1.00) |
0.92 (1.00) |
0.51 (1.00) |
0.51 (1.00) |
0.505 (1.00) |
0.699 (1.00) |
| 14q loss | 18 (20%) | 72 |
0.682 (1.00) |
0.793 (1.00) |
0.835 (1.00) |
0.782 (1.00) |
0.68 (1.00) |
0.782 (1.00) |
0.217 (1.00) |
0.137 (1.00) |
| 15q loss | 21 (23%) | 69 |
0.905 (1.00) |
0.519 (1.00) |
0.648 (1.00) |
0.704 (1.00) |
1 (1.00) |
0.606 (1.00) |
1 (1.00) |
0.661 (1.00) |
| 16p loss | 6 (7%) | 84 |
0.000668 (0.425) |
0.418 (1.00) |
0.117 (1.00) |
0.0515 (1.00) |
0.526 (1.00) |
1 (1.00) |
1 (1.00) |
0.452 (1.00) |
| 16q loss | 5 (6%) | 85 |
0.0189 (1.00) |
0.214 (1.00) |
0.246 (1.00) |
0.138 (1.00) |
0.461 (1.00) |
1 (1.00) |
1 (1.00) |
0.452 (1.00) |
| 17p loss | 32 (36%) | 58 |
0.000652 (0.415) |
0.535 (1.00) |
0.0603 (1.00) |
0.139 (1.00) |
0.73 (1.00) |
0.246 (1.00) |
0.699 (1.00) |
0.405 (1.00) |
| 17q loss | 24 (27%) | 66 |
0.0112 (1.00) |
0.964 (1.00) |
0.191 (1.00) |
0.361 (1.00) |
0.706 (1.00) |
0.00587 (1.00) |
1 (1.00) |
0.661 (1.00) |
| 18p loss | 37 (41%) | 53 |
0.708 (1.00) |
0.892 (1.00) |
0.205 (1.00) |
0.496 (1.00) |
1 (1.00) |
0.37 (1.00) |
0.292 (1.00) |
1 (1.00) |
| 18q loss | 35 (39%) | 55 |
0.883 (1.00) |
0.747 (1.00) |
0.273 (1.00) |
0.518 (1.00) |
1 (1.00) |
0.11 (1.00) |
0.274 (1.00) |
1 (1.00) |
| 19p loss | 5 (6%) | 85 |
0.00303 (1.00) |
0.603 (1.00) |
0.194 (1.00) |
0.287 (1.00) |
1 (1.00) |
1 (1.00) |
1 (1.00) |
1 (1.00) |
| 19q loss | 4 (4%) | 86 |
0.0792 (1.00) |
0.124 (1.00) |
0.876 (1.00) |
1 (1.00) |
1 (1.00) |
1 (1.00) |
1 (1.00) |
1 (1.00) |
| 20p loss | 9 (10%) | 81 |
0.778 (1.00) |
0.595 (1.00) |
0.555 (1.00) |
0.749 (1.00) |
1 (1.00) |
0.156 (1.00) |
0.278 (1.00) |
0.557 (1.00) |
| 20q loss | 3 (3%) | 87 |
0.386 (1.00) |
0.582 (1.00) |
0.706 (1.00) |
0.522 (1.00) |
1 (1.00) |
0.549 (1.00) |
1 (1.00) |
0.327 (1.00) |
| 21q loss | 15 (17%) | 75 |
0.0197 (1.00) |
0.468 (1.00) |
0.67 (1.00) |
0.417 (1.00) |
1 (1.00) |
0.565 (1.00) |
1 (1.00) |
0.557 (1.00) |
| 22q loss | 48 (53%) | 42 |
0.00777 (1.00) |
0.236 (1.00) |
0.187 (1.00) |
0.0827 (1.00) |
1 (1.00) |
0.374 (1.00) |
1 (1.00) |
0.113 (1.00) |
| xq loss | 17 (19%) | 73 |
0.891 (1.00) |
0.0417 (1.00) |
0.976 (1.00) |
0.738 (1.00) |
0.38 (1.00) |
1 (1.00) |
1 (1.00) |
0.321 (1.00) |
P value = 2.09e-05 (logrank test), Q value = 0.013
Table S1. Gene #22: '11q gain' versus Clinical Feature #1: 'Time to Death'
| nPatients | nDeath | Duration Range (Median), Month | |
|---|---|---|---|
| ALL | 89 | 31 | 4.1 - 153.6 (36.3) |
| 11Q GAIN MUTATED | 6 | 6 | 8.3 - 60.9 (15.2) |
| 11Q GAIN WILD-TYPE | 83 | 25 | 4.1 - 153.6 (36.3) |
Figure S1. Get High-res Image Gene #22: '11q gain' versus Clinical Feature #1: 'Time to Death'
P value = 9.39e-05 (logrank test), Q value = 0.06
Table S2. Gene #47: '4p loss' versus Clinical Feature #1: 'Time to Death'
| nPatients | nDeath | Duration Range (Median), Month | |
|---|---|---|---|
| ALL | 89 | 31 | 4.1 - 153.6 (36.3) |
| 4P LOSS MUTATED | 10 | 7 | 4.1 - 46.5 (18.1) |
| 4P LOSS WILD-TYPE | 79 | 24 | 4.9 - 153.6 (39.6) |
Figure S2. Get High-res Image Gene #47: '4p loss' versus Clinical Feature #1: 'Time to Death'
P value = 1.17e-05 (logrank test), Q value = 0.0075
Table S3. Gene #48: '4q loss' versus Clinical Feature #1: 'Time to Death'
| nPatients | nDeath | Duration Range (Median), Month | |
|---|---|---|---|
| ALL | 89 | 31 | 4.1 - 153.6 (36.3) |
| 4Q LOSS MUTATED | 11 | 8 | 4.1 - 46.5 (18.1) |
| 4Q LOSS WILD-TYPE | 78 | 23 | 4.9 - 153.6 (40.5) |
Figure S3. Get High-res Image Gene #48: '4q loss' versus Clinical Feature #1: 'Time to Death'

-
Copy number data file = transformed.cor.cli.txt
-
Clinical data file = ACC-TP.merged_data.txt
-
Number of patients = 90
-
Number of significantly arm-level cnvs = 80
-
Number of selected clinical features = 8
-
Exclude regions that fewer than K tumors have mutations, K = 3
For survival clinical features, the Kaplan-Meier survival curves of tumors with and without gene mutations were plotted and the statistical significance P values were estimated by logrank test (Bland and Altman 2004) using the 'survdiff' function in R
For binary or multi-class clinical features (nominal or ordinal), two-tailed Fisher's exact tests (Fisher 1922) were used to estimate the P values using the 'fisher.test' function in R
For multiple hypothesis correction, Q value is the False Discovery Rate (FDR) analogue of the P value (Benjamini and Hochberg 1995), defined as the minimum FDR at which the test may be called significant. We used the 'Benjamini and Hochberg' method of 'p.adjust' function in R to convert P values into Q values.
In addition to the links below, the full results of the analysis summarized in this report can also be downloaded programmatically using firehose_get, or interactively from either the Broad GDAC website or TCGA Data Coordination Center Portal.