This pipeline computes the correlation between significant copy number variation (cnv focal) genes and molecular subtypes.
Testing the association between copy number variation 46 focal events and 10 molecular subtypes across 90 patients, 29 significant findings detected with P value < 0.05 and Q value < 0.25.
-
amp_1q22 cnv correlated to 'METHLYATION_CNMF' and 'MRNASEQ_CHIERARCHICAL'.
-
amp_4q35.1 cnv correlated to 'CN_CNMF'.
-
amp_5p15.33 cnv correlated to 'CN_CNMF'.
-
amp_5q35.3 cnv correlated to 'CN_CNMF', 'MRNASEQ_CNMF', and 'MRNASEQ_CHIERARCHICAL'.
-
amp_12q14.1 cnv correlated to 'CN_CNMF'.
-
amp_14q11.2 cnv correlated to 'CN_CNMF', 'MRNASEQ_CNMF', 'MRNASEQ_CHIERARCHICAL', and 'MIRSEQ_CNMF'.
-
amp_16p13.3 cnv correlated to 'CN_CNMF', 'MRNASEQ_CNMF', and 'MRNASEQ_CHIERARCHICAL'.
-
amp_16q22.1 cnv correlated to 'CN_CNMF' and 'MRNASEQ_CHIERARCHICAL'.
-
amp_16q24.2 cnv correlated to 'CN_CNMF', 'MRNASEQ_CNMF', and 'MRNASEQ_CHIERARCHICAL'.
-
amp_19p13.12 cnv correlated to 'CN_CNMF' and 'MRNASEQ_CHIERARCHICAL'.
-
amp_xp11.22 cnv correlated to 'CN_CNMF'.
-
amp_xq28 cnv correlated to 'CN_CNMF'.
-
del_4q34.3 cnv correlated to 'MIRSEQ_MATURE_CNMF'.
-
del_4q34.3 cnv correlated to 'MIRSEQ_MATURE_CNMF'.
-
del_9p23 cnv correlated to 'MRNASEQ_CNMF'.
-
del_9p21.3 cnv correlated to 'MRNASEQ_CNMF' and 'MRNASEQ_CHIERARCHICAL'.
Table 1. Get Full Table Overview of the association between significant copy number variation of 46 focal events and 10 molecular subtypes. Shown in the table are P values (Q values). Thresholded by P value < 0.05 and Q value < 0.25, 29 significant findings detected.
|
Clinical Features |
CN CNMF |
METHLYATION CNMF |
RPPA CNMF |
RPPA CHIERARCHICAL |
MRNASEQ CNMF |
MRNASEQ CHIERARCHICAL |
MIRSEQ CNMF |
MIRSEQ CHIERARCHICAL |
MIRSEQ MATURE CNMF |
MIRSEQ MATURE CHIERARCHICAL |
||
| nCNV (%) | nWild-Type | Fisher's exact test | Fisher's exact test | Fisher's exact test | Fisher's exact test | Fisher's exact test | Fisher's exact test | Fisher's exact test | Fisher's exact test | Fisher's exact test | Fisher's exact test | |
| amp 14q11 2 | 27 (30%) | 63 |
0.0001 (0.0443) |
0.0133 (1.00) |
0.0221 (1.00) |
0.0288 (1.00) |
3e-05 (0.0133) |
1e-05 (0.00458) |
0.00032 (0.139) |
0.00687 (1.00) |
0.00067 (0.287) |
0.00102 (0.429) |
| amp 5q35 3 | 63 (70%) | 27 |
1e-05 (0.00458) |
0.00132 (0.549) |
0.192 (1.00) |
0.00694 (1.00) |
1e-05 (0.00458) |
1e-05 (0.00458) |
0.00632 (1.00) |
0.0478 (1.00) |
0.0119 (1.00) |
0.291 (1.00) |
| amp 16p13 3 | 50 (56%) | 40 |
1e-05 (0.00458) |
0.263 (1.00) |
0.931 (1.00) |
0.0539 (1.00) |
0.00017 (0.0745) |
1e-05 (0.00458) |
0.076 (1.00) |
0.00965 (1.00) |
0.0528 (1.00) |
0.584 (1.00) |
| amp 16q24 2 | 49 (54%) | 41 |
1e-05 (0.00458) |
0.0273 (1.00) |
0.954 (1.00) |
0.323 (1.00) |
0.0003 (0.131) |
1e-05 (0.00458) |
0.063 (1.00) |
0.00281 (1.00) |
0.00515 (1.00) |
0.38 (1.00) |
| amp 1q22 | 17 (19%) | 73 |
0.00833 (1.00) |
0.00038 (0.164) |
0.563 (1.00) |
0.398 (1.00) |
0.00251 (1.00) |
0.00019 (0.083) |
0.116 (1.00) |
0.156 (1.00) |
0.0136 (1.00) |
0.44 (1.00) |
| amp 16q22 1 | 56 (62%) | 34 |
1e-05 (0.00458) |
0.371 (1.00) |
0.923 (1.00) |
0.804 (1.00) |
0.0293 (1.00) |
0.00016 (0.0702) |
0.066 (1.00) |
0.0224 (1.00) |
0.153 (1.00) |
0.86 (1.00) |
| amp 19p13 12 | 58 (64%) | 32 |
0.00046 (0.198) |
0.034 (1.00) |
0.19 (1.00) |
0.00967 (1.00) |
0.00194 (0.795) |
0.00038 (0.164) |
0.325 (1.00) |
0.48 (1.00) |
0.584 (1.00) |
0.172 (1.00) |
| del 9p21 3 | 27 (30%) | 63 |
0.00709 (1.00) |
0.00362 (1.00) |
0.167 (1.00) |
0.224 (1.00) |
2e-05 (0.00894) |
0.00032 (0.139) |
0.0171 (1.00) |
0.181 (1.00) |
0.0088 (1.00) |
0.567 (1.00) |
| amp 4q35 1 | 29 (32%) | 61 |
2e-05 (0.00894) |
0.197 (1.00) |
0.766 (1.00) |
0.559 (1.00) |
0.00081 (0.344) |
0.00088 (0.373) |
0.0562 (1.00) |
0.00109 (0.457) |
0.0677 (1.00) |
0.296 (1.00) |
| amp 5p15 33 | 65 (72%) | 25 |
1e-05 (0.00458) |
0.883 (1.00) |
0.455 (1.00) |
0.89 (1.00) |
0.00998 (1.00) |
0.00088 (0.373) |
0.0444 (1.00) |
0.18 (1.00) |
0.0159 (1.00) |
0.305 (1.00) |
| amp 12q14 1 | 70 (78%) | 20 |
1e-05 (0.00458) |
0.283 (1.00) |
0.0197 (1.00) |
0.0105 (1.00) |
0.0224 (1.00) |
0.0019 (0.781) |
0.459 (1.00) |
0.488 (1.00) |
0.351 (1.00) |
0.0905 (1.00) |
| amp xp11 22 | 49 (54%) | 41 |
0.00015 (0.066) |
0.92 (1.00) |
0.435 (1.00) |
0.017 (1.00) |
0.0334 (1.00) |
0.0963 (1.00) |
0.764 (1.00) |
0.144 (1.00) |
0.74 (1.00) |
0.0889 (1.00) |
| amp xq28 | 46 (51%) | 44 |
0.00037 (0.16) |
0.757 (1.00) |
0.216 (1.00) |
0.0448 (1.00) |
0.00882 (1.00) |
0.0114 (1.00) |
0.512 (1.00) |
0.261 (1.00) |
1 (1.00) |
0.0295 (1.00) |
| del 4q34 3 | 25 (28%) | 65 |
0.0011 (0.46) |
0.0643 (1.00) |
0.864 (1.00) |
0.637 (1.00) |
0.0218 (1.00) |
0.039 (1.00) |
0.0372 (1.00) |
0.0418 (1.00) |
0.00011 (0.0486) |
0.248 (1.00) |
| del 4q34 3 | 28 (31%) | 62 |
0.00146 (0.604) |
0.00485 (1.00) |
0.731 (1.00) |
0.148 (1.00) |
0.185 (1.00) |
0.189 (1.00) |
0.0897 (1.00) |
0.187 (1.00) |
0.00012 (0.0529) |
0.263 (1.00) |
| del 9p23 | 24 (27%) | 66 |
0.00909 (1.00) |
0.00832 (1.00) |
0.155 (1.00) |
0.0504 (1.00) |
3e-05 (0.0133) |
0.00138 (0.573) |
0.00748 (1.00) |
0.172 (1.00) |
0.00804 (1.00) |
0.731 (1.00) |
| amp 4p16 3 | 41 (46%) | 49 |
0.00075 (0.32) |
0.547 (1.00) |
0.914 (1.00) |
0.19 (1.00) |
0.0132 (1.00) |
0.00575 (1.00) |
0.488 (1.00) |
0.0459 (1.00) |
0.408 (1.00) |
0.953 (1.00) |
| amp 6p21 31 | 19 (21%) | 71 |
0.0648 (1.00) |
0.798 (1.00) |
1 (1.00) |
0.801 (1.00) |
0.0811 (1.00) |
1 (1.00) |
0.141 (1.00) |
0.0266 (1.00) |
0.404 (1.00) |
0.303 (1.00) |
| amp 6q24 3 | 19 (21%) | 71 |
0.0227 (1.00) |
0.909 (1.00) |
0.965 (1.00) |
0.638 (1.00) |
0.0465 (1.00) |
0.934 (1.00) |
0.671 (1.00) |
0.234 (1.00) |
0.631 (1.00) |
1 (1.00) |
| amp 7p22 1 | 54 (60%) | 36 |
0.00199 (0.812) |
0.484 (1.00) |
0.425 (1.00) |
0.675 (1.00) |
0.00749 (1.00) |
0.0331 (1.00) |
0.57 (1.00) |
0.491 (1.00) |
0.806 (1.00) |
0.133 (1.00) |
| amp 9q31 3 | 34 (38%) | 56 |
0.00059 (0.253) |
0.0202 (1.00) |
0.229 (1.00) |
0.137 (1.00) |
0.0289 (1.00) |
0.0176 (1.00) |
0.0567 (1.00) |
0.199 (1.00) |
0.251 (1.00) |
0.129 (1.00) |
| amp 17q25 3 | 18 (20%) | 72 |
0.0337 (1.00) |
0.69 (1.00) |
0.575 (1.00) |
0.1 (1.00) |
0.128 (1.00) |
0.672 (1.00) |
0.398 (1.00) |
0.695 (1.00) |
0.304 (1.00) |
0.466 (1.00) |
| amp 19q12 | 56 (62%) | 34 |
0.00104 (0.437) |
0.0202 (1.00) |
0.396 (1.00) |
0.165 (1.00) |
0.00189 (0.779) |
0.00098 (0.414) |
0.198 (1.00) |
0.253 (1.00) |
0.513 (1.00) |
0.0629 (1.00) |
| del 1p36 23 | 38 (42%) | 52 |
0.0226 (1.00) |
0.00399 (1.00) |
0.566 (1.00) |
0.148 (1.00) |
0.0712 (1.00) |
0.00372 (1.00) |
0.833 (1.00) |
0.558 (1.00) |
0.405 (1.00) |
0.826 (1.00) |
| del 1q43 | 18 (20%) | 72 |
0.015 (1.00) |
0.0454 (1.00) |
0.164 (1.00) |
0.159 (1.00) |
0.591 (1.00) |
0.14 (1.00) |
0.524 (1.00) |
0.555 (1.00) |
0.192 (1.00) |
0.181 (1.00) |
| del 2q22 1 | 18 (20%) | 72 |
0.039 (1.00) |
0.00369 (1.00) |
0.624 (1.00) |
0.794 (1.00) |
0.239 (1.00) |
0.09 (1.00) |
0.314 (1.00) |
0.664 (1.00) |
0.407 (1.00) |
0.489 (1.00) |
| del 2q37 3 | 21 (23%) | 69 |
0.006 (1.00) |
0.0266 (1.00) |
0.689 (1.00) |
0.831 (1.00) |
0.297 (1.00) |
0.0916 (1.00) |
0.482 (1.00) |
0.529 (1.00) |
0.569 (1.00) |
0.938 (1.00) |
| del 3q13 31 | 25 (28%) | 65 |
0.3 (1.00) |
0.0454 (1.00) |
0.419 (1.00) |
0.473 (1.00) |
0.157 (1.00) |
0.0401 (1.00) |
0.45 (1.00) |
0.2 (1.00) |
0.85 (1.00) |
0.37 (1.00) |
| del 4q35 1 | 30 (33%) | 60 |
0.00543 (1.00) |
0.0124 (1.00) |
0.458 (1.00) |
0.388 (1.00) |
0.0955 (1.00) |
0.0424 (1.00) |
0.192 (1.00) |
0.166 (1.00) |
0.00077 (0.328) |
0.682 (1.00) |
| del 6p24 3 | 20 (22%) | 70 |
0.109 (1.00) |
0.918 (1.00) |
0.578 (1.00) |
0.319 (1.00) |
0.622 (1.00) |
0.481 (1.00) |
1 (1.00) |
0.0985 (1.00) |
1 (1.00) |
0.459 (1.00) |
| del 6q26 | 21 (23%) | 69 |
0.119 (1.00) |
0.859 (1.00) |
0.671 (1.00) |
0.316 (1.00) |
0.322 (1.00) |
0.307 (1.00) |
0.505 (1.00) |
0.347 (1.00) |
0.224 (1.00) |
0.594 (1.00) |
| del 7q36 3 | 11 (12%) | 79 |
0.0382 (1.00) |
0.256 (1.00) |
0.533 (1.00) |
0.663 (1.00) |
0.177 (1.00) |
0.339 (1.00) |
0.896 (1.00) |
0.736 (1.00) |
0.0962 (1.00) |
0.245 (1.00) |
| del 10q23 1 | 11 (12%) | 79 |
0.257 (1.00) |
0.259 (1.00) |
1 (1.00) |
0.238 (1.00) |
0.236 (1.00) |
0.747 (1.00) |
1 (1.00) |
0.969 (1.00) |
1 (1.00) |
0.287 (1.00) |
| del 11p15 5 | 27 (30%) | 63 |
0.00741 (1.00) |
0.0199 (1.00) |
0.458 (1.00) |
0.673 (1.00) |
0.0891 (1.00) |
0.0333 (1.00) |
0.123 (1.00) |
0.598 (1.00) |
0.391 (1.00) |
0.514 (1.00) |
| del 11q14 1 | 25 (28%) | 65 |
0.02 (1.00) |
0.00655 (1.00) |
0.965 (1.00) |
0.551 (1.00) |
0.218 (1.00) |
0.35 (1.00) |
0.281 (1.00) |
0.744 (1.00) |
0.325 (1.00) |
0.582 (1.00) |
| del 12q14 2 | 5 (6%) | 85 |
0.0903 (1.00) |
0.222 (1.00) |
0.178 (1.00) |
0.0011 (0.46) |
0.595 (1.00) |
0.305 (1.00) |
0.854 (1.00) |
0.15 (1.00) |
||
| del 13q14 2 | 42 (47%) | 48 |
0.00306 (1.00) |
0.0889 (1.00) |
0.664 (1.00) |
0.842 (1.00) |
0.334 (1.00) |
0.557 (1.00) |
1 (1.00) |
0.534 (1.00) |
0.405 (1.00) |
0.827 (1.00) |
| del 14q21 2 | 20 (22%) | 70 |
0.0197 (1.00) |
0.926 (1.00) |
0.655 (1.00) |
0.575 (1.00) |
0.302 (1.00) |
0.284 (1.00) |
0.37 (1.00) |
0.733 (1.00) |
0.27 (1.00) |
0.158 (1.00) |
| del 16p13 3 | 7 (8%) | 83 |
0.0806 (1.00) |
0.557 (1.00) |
0.877 (1.00) |
0.341 (1.00) |
0.545 (1.00) |
0.00824 (1.00) |
0.0243 (1.00) |
0.599 (1.00) |
0.02 (1.00) |
0.76 (1.00) |
| del 16q23 1 | 11 (12%) | 79 |
0.0097 (1.00) |
0.507 (1.00) |
0.566 (1.00) |
0.231 (1.00) |
0.0426 (1.00) |
0.0108 (1.00) |
0.275 (1.00) |
0.138 (1.00) |
0.0106 (1.00) |
0.54 (1.00) |
| del 17q11 2 | 24 (27%) | 66 |
0.0149 (1.00) |
0.00551 (1.00) |
0.643 (1.00) |
0.629 (1.00) |
0.102 (1.00) |
0.105 (1.00) |
0.258 (1.00) |
0.018 (1.00) |
0.111 (1.00) |
0.397 (1.00) |
| del 17q21 31 | 26 (29%) | 64 |
0.00413 (1.00) |
0.00902 (1.00) |
0.426 (1.00) |
0.541 (1.00) |
0.077 (1.00) |
0.0461 (1.00) |
0.0346 (1.00) |
0.00469 (1.00) |
0.185 (1.00) |
0.0625 (1.00) |
| del 17q24 2 | 24 (27%) | 66 |
0.00198 (0.81) |
0.0139 (1.00) |
0.819 (1.00) |
0.289 (1.00) |
0.157 (1.00) |
0.0404 (1.00) |
0.155 (1.00) |
0.0269 (1.00) |
0.052 (1.00) |
0.239 (1.00) |
| del 18q21 2 | 36 (40%) | 54 |
0.0307 (1.00) |
0.321 (1.00) |
1 (1.00) |
0.325 (1.00) |
0.823 (1.00) |
1 (1.00) |
0.495 (1.00) |
0.914 (1.00) |
0.292 (1.00) |
0.352 (1.00) |
| del 20p12 1 | 12 (13%) | 78 |
0.00514 (1.00) |
0.642 (1.00) |
0.118 (1.00) |
0.619 (1.00) |
0.0434 (1.00) |
0.0274 (1.00) |
0.00654 (1.00) |
0.516 (1.00) |
0.00183 (0.756) |
1 (1.00) |
| del 22q12 1 | 50 (56%) | 40 |
0.00486 (1.00) |
0.138 (1.00) |
0.692 (1.00) |
0.292 (1.00) |
0.746 (1.00) |
0.182 (1.00) |
0.635 (1.00) |
0.88 (1.00) |
0.917 (1.00) |
0.2 (1.00) |
P value = 0.00038 (Fisher's exact test), Q value = 0.16
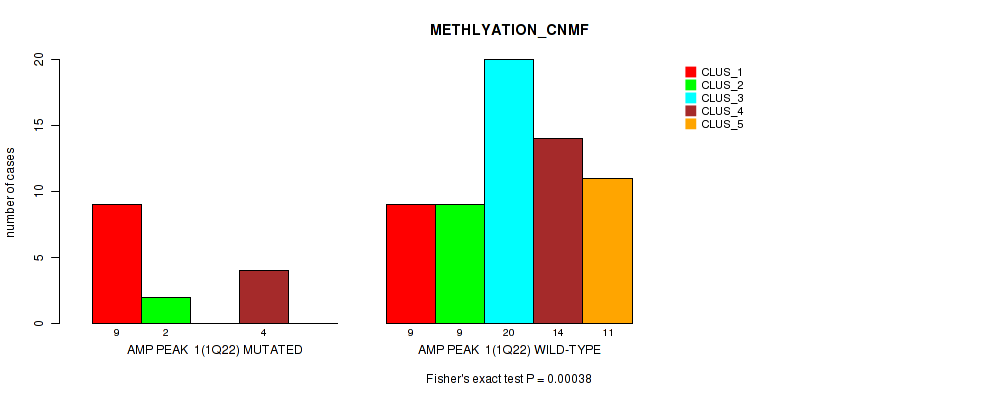
Table S1. Gene #1: 'amp_1q22' versus Molecular Subtype #2: 'METHLYATION_CNMF'
| nPatients | CLUS_1 | CLUS_2 | CLUS_3 | CLUS_4 | CLUS_5 |
|---|---|---|---|---|---|
| ALL | 18 | 11 | 20 | 18 | 11 |
| AMP PEAK 1(1Q22) MUTATED | 9 | 2 | 0 | 4 | 0 |
| AMP PEAK 1(1Q22) WILD-TYPE | 9 | 9 | 20 | 14 | 11 |
Figure S1. Get High-res Image Gene #1: 'amp_1q22' versus Molecular Subtype #2: 'METHLYATION_CNMF'
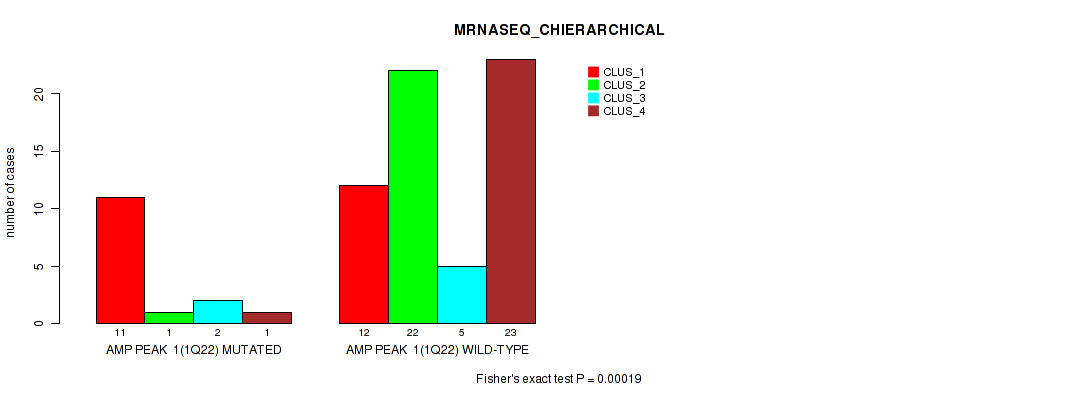
P value = 0.00019 (Fisher's exact test), Q value = 0.083
Table S2. Gene #1: 'amp_1q22' versus Molecular Subtype #6: 'MRNASEQ_CHIERARCHICAL'
| nPatients | CLUS_1 | CLUS_2 | CLUS_3 | CLUS_4 |
|---|---|---|---|---|
| ALL | 23 | 23 | 7 | 24 |
| AMP PEAK 1(1Q22) MUTATED | 11 | 1 | 2 | 1 |
| AMP PEAK 1(1Q22) WILD-TYPE | 12 | 22 | 5 | 23 |
Figure S2. Get High-res Image Gene #1: 'amp_1q22' versus Molecular Subtype #6: 'MRNASEQ_CHIERARCHICAL'
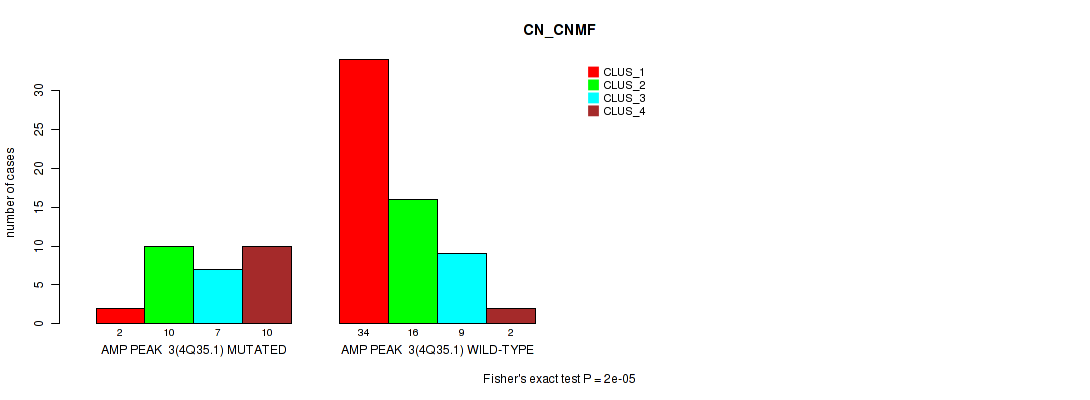
P value = 2e-05 (Fisher's exact test), Q value = 0.0089
Table S3. Gene #3: 'amp_4q35.1' versus Molecular Subtype #1: 'CN_CNMF'
| nPatients | CLUS_1 | CLUS_2 | CLUS_3 | CLUS_4 |
|---|---|---|---|---|
| ALL | 36 | 26 | 16 | 12 |
| AMP PEAK 3(4Q35.1) MUTATED | 2 | 10 | 7 | 10 |
| AMP PEAK 3(4Q35.1) WILD-TYPE | 34 | 16 | 9 | 2 |
Figure S3. Get High-res Image Gene #3: 'amp_4q35.1' versus Molecular Subtype #1: 'CN_CNMF'
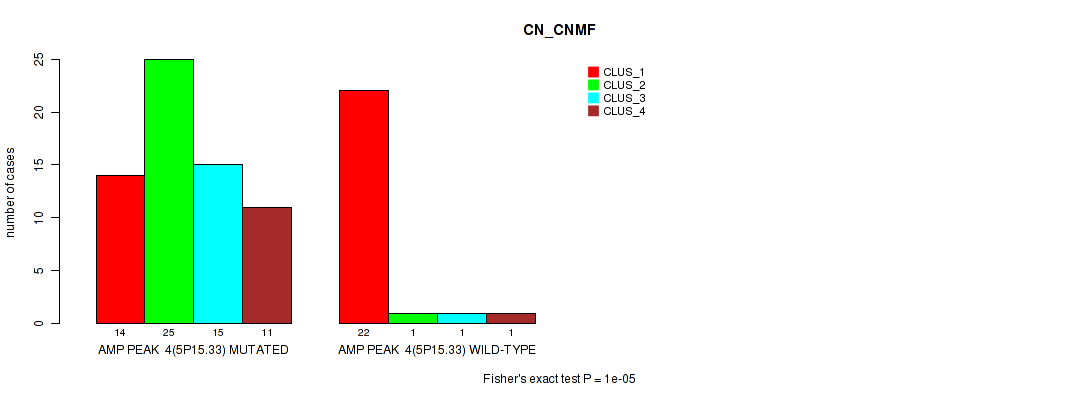
P value = 1e-05 (Fisher's exact test), Q value = 0.0046
Table S4. Gene #4: 'amp_5p15.33' versus Molecular Subtype #1: 'CN_CNMF'
| nPatients | CLUS_1 | CLUS_2 | CLUS_3 | CLUS_4 |
|---|---|---|---|---|
| ALL | 36 | 26 | 16 | 12 |
| AMP PEAK 4(5P15.33) MUTATED | 14 | 25 | 15 | 11 |
| AMP PEAK 4(5P15.33) WILD-TYPE | 22 | 1 | 1 | 1 |
Figure S4. Get High-res Image Gene #4: 'amp_5p15.33' versus Molecular Subtype #1: 'CN_CNMF'
P value = 1e-05 (Fisher's exact test), Q value = 0.0046
Table S5. Gene #5: 'amp_5q35.3' versus Molecular Subtype #1: 'CN_CNMF'
| nPatients | CLUS_1 | CLUS_2 | CLUS_3 | CLUS_4 |
|---|---|---|---|---|
| ALL | 36 | 26 | 16 | 12 |
| AMP PEAK 5(5Q35.3) MUTATED | 12 | 26 | 15 | 10 |
| AMP PEAK 5(5Q35.3) WILD-TYPE | 24 | 0 | 1 | 2 |
Figure S5. Get High-res Image Gene #5: 'amp_5q35.3' versus Molecular Subtype #1: 'CN_CNMF'
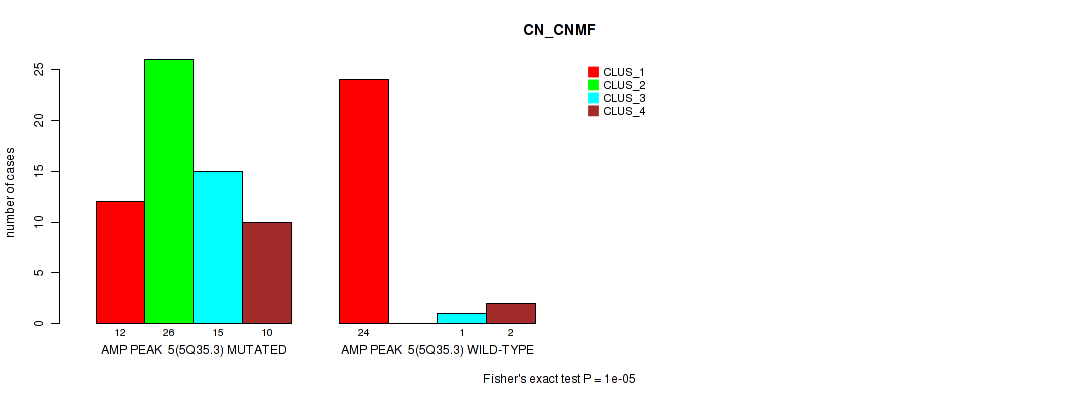
P value = 1e-05 (Fisher's exact test), Q value = 0.0046
Table S6. Gene #5: 'amp_5q35.3' versus Molecular Subtype #5: 'MRNASEQ_CNMF'
| nPatients | CLUS_1 | CLUS_2 | CLUS_3 | CLUS_4 |
|---|---|---|---|---|
| ALL | 24 | 13 | 17 | 23 |
| AMP PEAK 5(5Q35.3) MUTATED | 7 | 12 | 16 | 20 |
| AMP PEAK 5(5Q35.3) WILD-TYPE | 17 | 1 | 1 | 3 |
Figure S6. Get High-res Image Gene #5: 'amp_5q35.3' versus Molecular Subtype #5: 'MRNASEQ_CNMF'
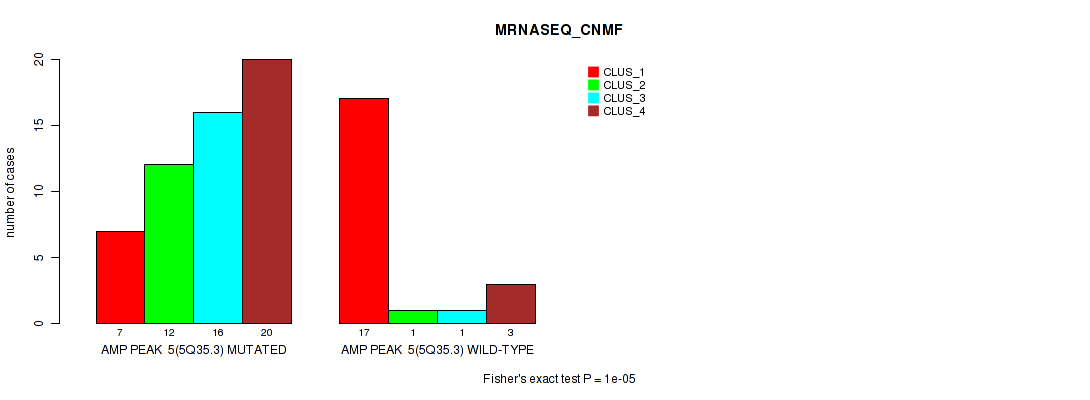
P value = 1e-05 (Fisher's exact test), Q value = 0.0046
Table S7. Gene #5: 'amp_5q35.3' versus Molecular Subtype #6: 'MRNASEQ_CHIERARCHICAL'
| nPatients | CLUS_1 | CLUS_2 | CLUS_3 | CLUS_4 |
|---|---|---|---|---|
| ALL | 23 | 23 | 7 | 24 |
| AMP PEAK 5(5Q35.3) MUTATED | 8 | 22 | 2 | 23 |
| AMP PEAK 5(5Q35.3) WILD-TYPE | 15 | 1 | 5 | 1 |
Figure S7. Get High-res Image Gene #5: 'amp_5q35.3' versus Molecular Subtype #6: 'MRNASEQ_CHIERARCHICAL'
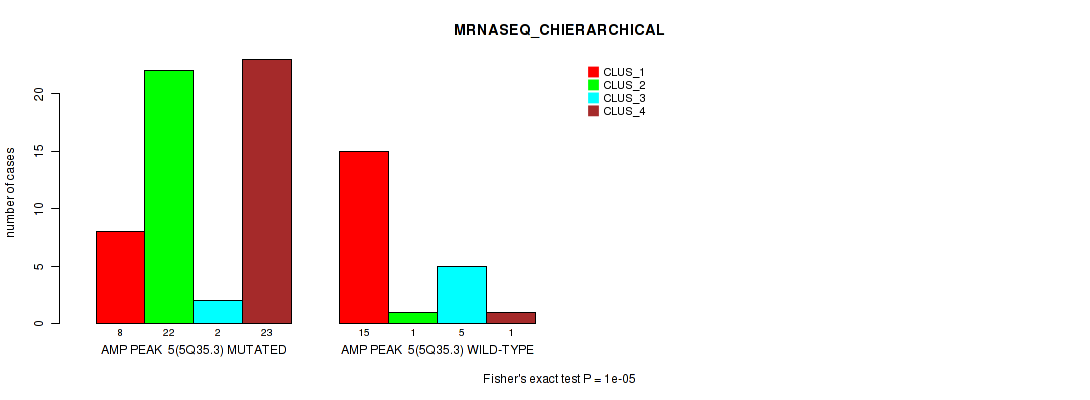
P value = 1e-05 (Fisher's exact test), Q value = 0.0046
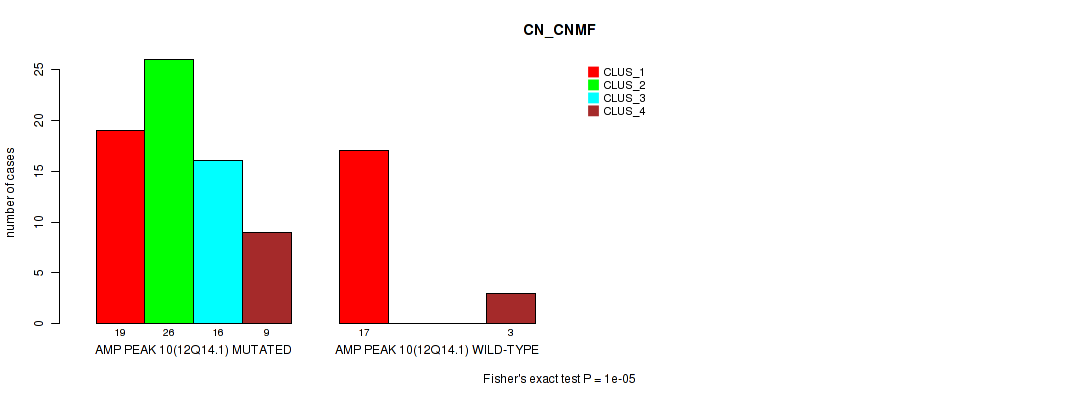
Table S8. Gene #10: 'amp_12q14.1' versus Molecular Subtype #1: 'CN_CNMF'
| nPatients | CLUS_1 | CLUS_2 | CLUS_3 | CLUS_4 |
|---|---|---|---|---|
| ALL | 36 | 26 | 16 | 12 |
| AMP PEAK 10(12Q14.1) MUTATED | 19 | 26 | 16 | 9 |
| AMP PEAK 10(12Q14.1) WILD-TYPE | 17 | 0 | 0 | 3 |
Figure S8. Get High-res Image Gene #10: 'amp_12q14.1' versus Molecular Subtype #1: 'CN_CNMF'
P value = 1e-04 (Fisher's exact test), Q value = 0.044
Table S9. Gene #11: 'amp_14q11.2' versus Molecular Subtype #1: 'CN_CNMF'
| nPatients | CLUS_1 | CLUS_2 | CLUS_3 | CLUS_4 |
|---|---|---|---|---|
| ALL | 36 | 26 | 16 | 12 |
| AMP PEAK 11(14Q11.2) MUTATED | 7 | 5 | 13 | 2 |
| AMP PEAK 11(14Q11.2) WILD-TYPE | 29 | 21 | 3 | 10 |
Figure S9. Get High-res Image Gene #11: 'amp_14q11.2' versus Molecular Subtype #1: 'CN_CNMF'
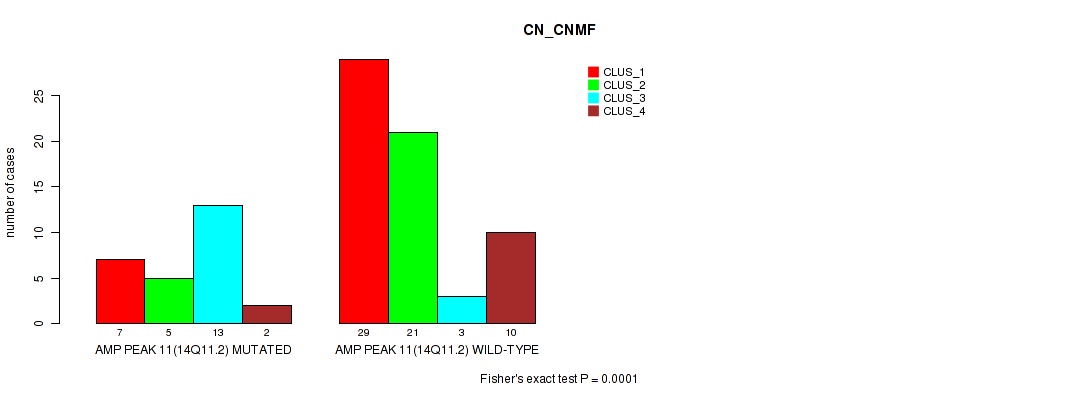
P value = 3e-05 (Fisher's exact test), Q value = 0.013
Table S10. Gene #11: 'amp_14q11.2' versus Molecular Subtype #5: 'MRNASEQ_CNMF'
| nPatients | CLUS_1 | CLUS_2 | CLUS_3 | CLUS_4 |
|---|---|---|---|---|
| ALL | 24 | 13 | 17 | 23 |
| AMP PEAK 11(14Q11.2) MUTATED | 4 | 7 | 11 | 1 |
| AMP PEAK 11(14Q11.2) WILD-TYPE | 20 | 6 | 6 | 22 |
Figure S10. Get High-res Image Gene #11: 'amp_14q11.2' versus Molecular Subtype #5: 'MRNASEQ_CNMF'
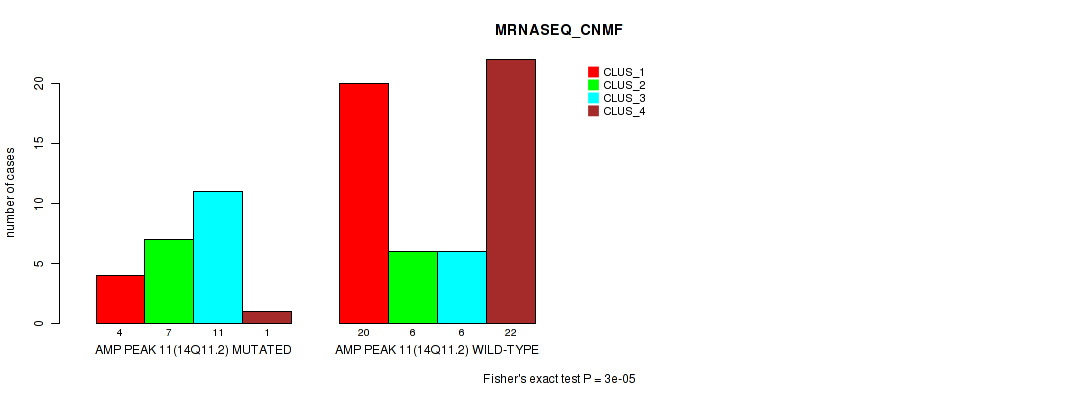
P value = 1e-05 (Fisher's exact test), Q value = 0.0046
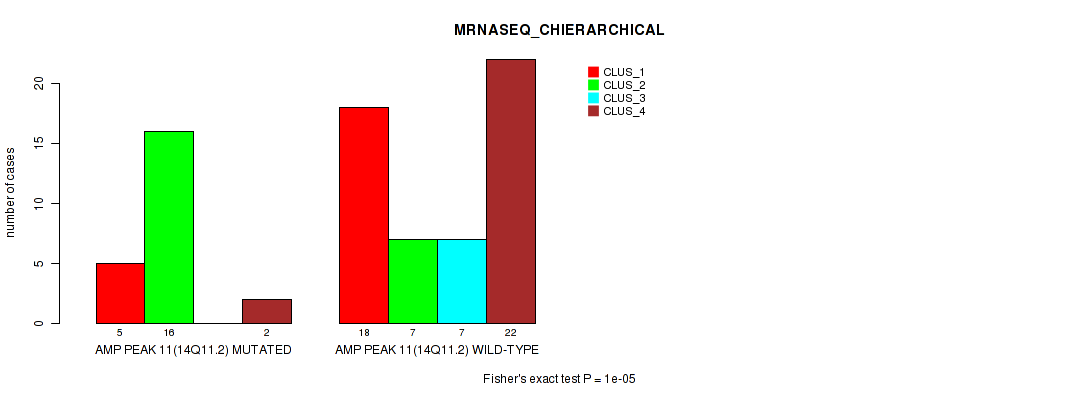
Table S11. Gene #11: 'amp_14q11.2' versus Molecular Subtype #6: 'MRNASEQ_CHIERARCHICAL'
| nPatients | CLUS_1 | CLUS_2 | CLUS_3 | CLUS_4 |
|---|---|---|---|---|
| ALL | 23 | 23 | 7 | 24 |
| AMP PEAK 11(14Q11.2) MUTATED | 5 | 16 | 0 | 2 |
| AMP PEAK 11(14Q11.2) WILD-TYPE | 18 | 7 | 7 | 22 |
Figure S11. Get High-res Image Gene #11: 'amp_14q11.2' versus Molecular Subtype #6: 'MRNASEQ_CHIERARCHICAL'
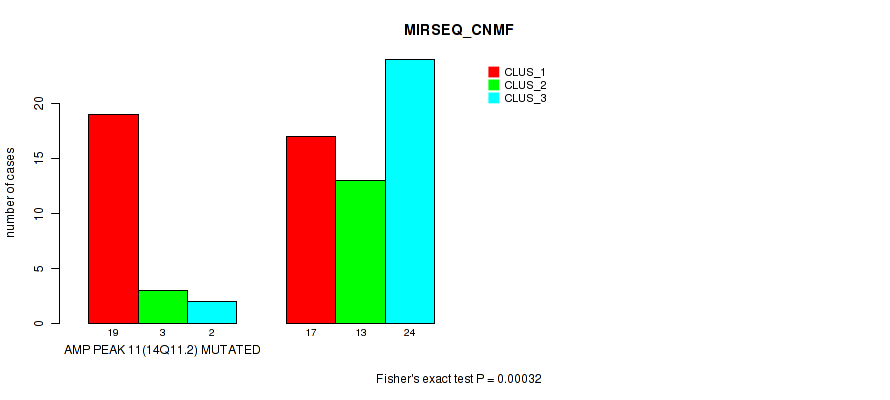
P value = 0.00032 (Fisher's exact test), Q value = 0.14
Table S12. Gene #11: 'amp_14q11.2' versus Molecular Subtype #7: 'MIRSEQ_CNMF'
| nPatients | CLUS_1 | CLUS_2 | CLUS_3 |
|---|---|---|---|
| ALL | 36 | 16 | 26 |
| AMP PEAK 11(14Q11.2) MUTATED | 19 | 3 | 2 |
| AMP PEAK 11(14Q11.2) WILD-TYPE | 17 | 13 | 24 |
Figure S12. Get High-res Image Gene #11: 'amp_14q11.2' versus Molecular Subtype #7: 'MIRSEQ_CNMF'
P value = 1e-05 (Fisher's exact test), Q value = 0.0046
Table S13. Gene #12: 'amp_16p13.3' versus Molecular Subtype #1: 'CN_CNMF'
| nPatients | CLUS_1 | CLUS_2 | CLUS_3 | CLUS_4 |
|---|---|---|---|---|
| ALL | 36 | 26 | 16 | 12 |
| AMP PEAK 12(16P13.3) MUTATED | 6 | 26 | 11 | 7 |
| AMP PEAK 12(16P13.3) WILD-TYPE | 30 | 0 | 5 | 5 |
Figure S13. Get High-res Image Gene #12: 'amp_16p13.3' versus Molecular Subtype #1: 'CN_CNMF'
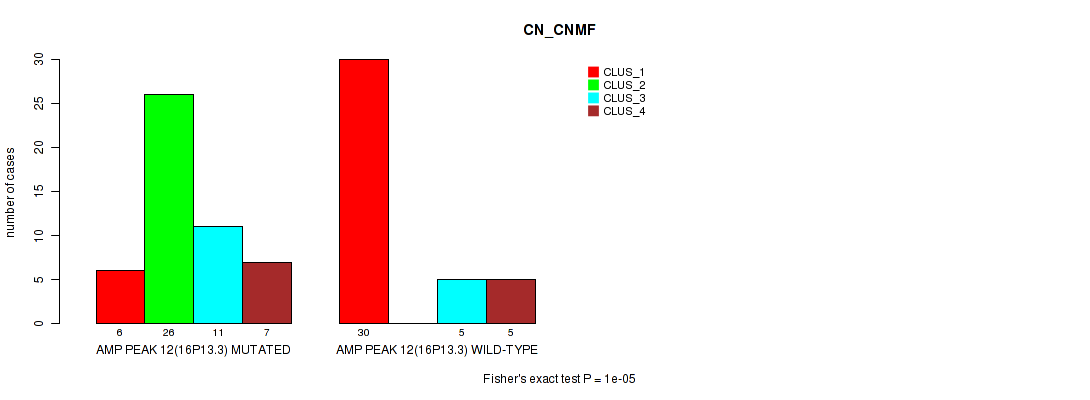
P value = 0.00017 (Fisher's exact test), Q value = 0.074
Table S14. Gene #12: 'amp_16p13.3' versus Molecular Subtype #5: 'MRNASEQ_CNMF'
| nPatients | CLUS_1 | CLUS_2 | CLUS_3 | CLUS_4 |
|---|---|---|---|---|
| ALL | 24 | 13 | 17 | 23 |
| AMP PEAK 12(16P13.3) MUTATED | 5 | 9 | 14 | 16 |
| AMP PEAK 12(16P13.3) WILD-TYPE | 19 | 4 | 3 | 7 |
Figure S14. Get High-res Image Gene #12: 'amp_16p13.3' versus Molecular Subtype #5: 'MRNASEQ_CNMF'
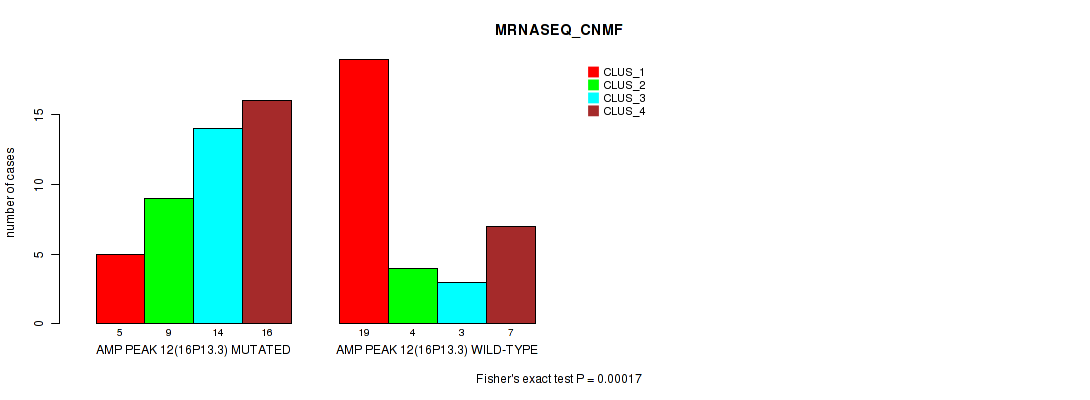
P value = 1e-05 (Fisher's exact test), Q value = 0.0046
Table S15. Gene #12: 'amp_16p13.3' versus Molecular Subtype #6: 'MRNASEQ_CHIERARCHICAL'
| nPatients | CLUS_1 | CLUS_2 | CLUS_3 | CLUS_4 |
|---|---|---|---|---|
| ALL | 23 | 23 | 7 | 24 |
| AMP PEAK 12(16P13.3) MUTATED | 6 | 19 | 0 | 19 |
| AMP PEAK 12(16P13.3) WILD-TYPE | 17 | 4 | 7 | 5 |
Figure S15. Get High-res Image Gene #12: 'amp_16p13.3' versus Molecular Subtype #6: 'MRNASEQ_CHIERARCHICAL'
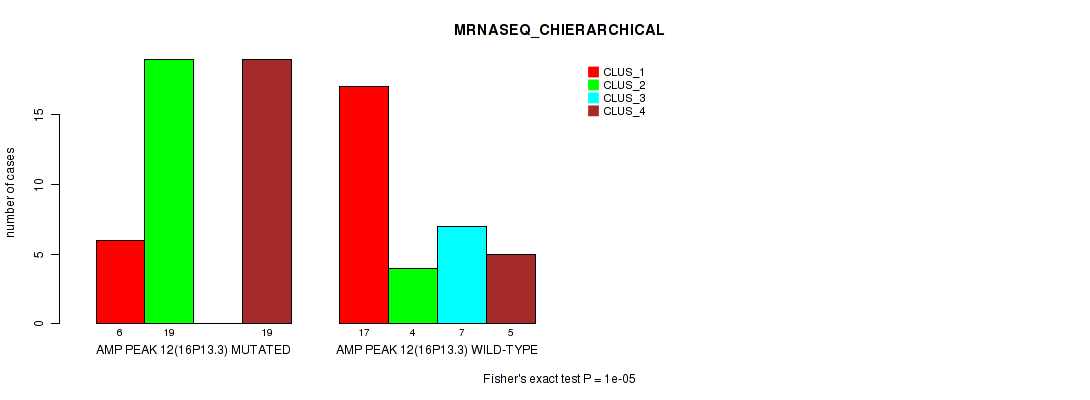
P value = 1e-05 (Fisher's exact test), Q value = 0.0046
Table S16. Gene #13: 'amp_16q22.1' versus Molecular Subtype #1: 'CN_CNMF'
| nPatients | CLUS_1 | CLUS_2 | CLUS_3 | CLUS_4 |
|---|---|---|---|---|
| ALL | 36 | 26 | 16 | 12 |
| AMP PEAK 13(16Q22.1) MUTATED | 10 | 26 | 14 | 6 |
| AMP PEAK 13(16Q22.1) WILD-TYPE | 26 | 0 | 2 | 6 |
Figure S16. Get High-res Image Gene #13: 'amp_16q22.1' versus Molecular Subtype #1: 'CN_CNMF'
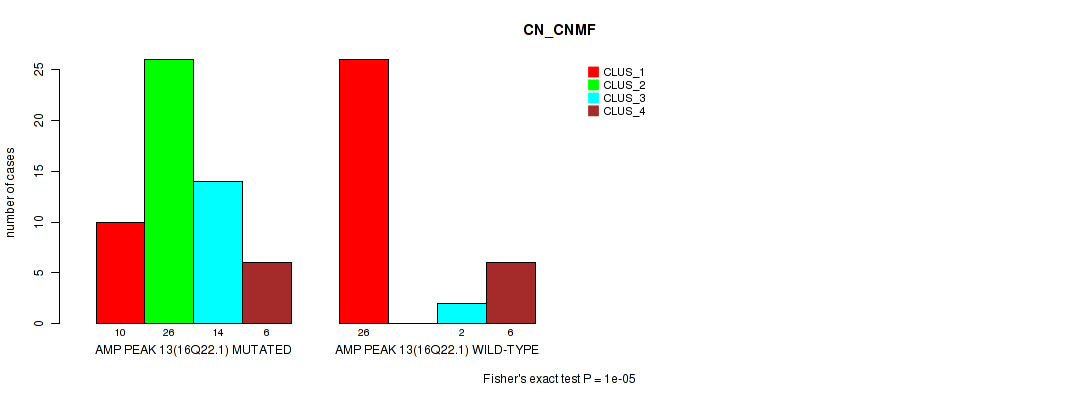
P value = 0.00016 (Fisher's exact test), Q value = 0.07
Table S17. Gene #13: 'amp_16q22.1' versus Molecular Subtype #6: 'MRNASEQ_CHIERARCHICAL'
| nPatients | CLUS_1 | CLUS_2 | CLUS_3 | CLUS_4 |
|---|---|---|---|---|
| ALL | 23 | 23 | 7 | 24 |
| AMP PEAK 13(16Q22.1) MUTATED | 9 | 20 | 1 | 18 |
| AMP PEAK 13(16Q22.1) WILD-TYPE | 14 | 3 | 6 | 6 |
Figure S17. Get High-res Image Gene #13: 'amp_16q22.1' versus Molecular Subtype #6: 'MRNASEQ_CHIERARCHICAL'
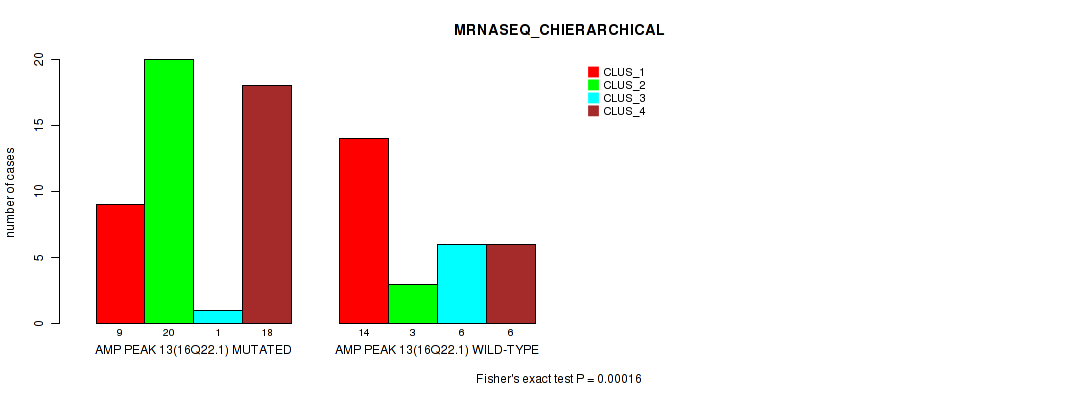
P value = 1e-05 (Fisher's exact test), Q value = 0.0046
Table S18. Gene #14: 'amp_16q24.2' versus Molecular Subtype #1: 'CN_CNMF'
| nPatients | CLUS_1 | CLUS_2 | CLUS_3 | CLUS_4 |
|---|---|---|---|---|
| ALL | 36 | 26 | 16 | 12 |
| AMP PEAK 14(16Q24.2) MUTATED | 6 | 26 | 11 | 6 |
| AMP PEAK 14(16Q24.2) WILD-TYPE | 30 | 0 | 5 | 6 |
Figure S18. Get High-res Image Gene #14: 'amp_16q24.2' versus Molecular Subtype #1: 'CN_CNMF'
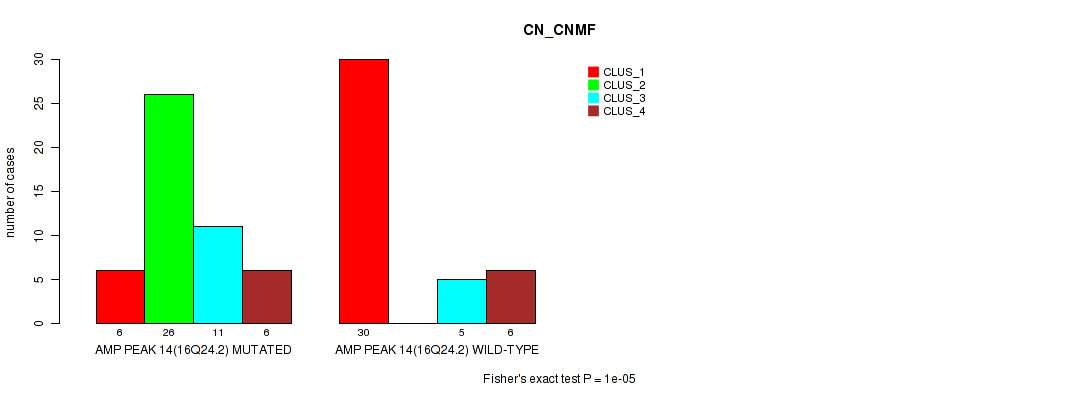
P value = 3e-04 (Fisher's exact test), Q value = 0.13
Table S19. Gene #14: 'amp_16q24.2' versus Molecular Subtype #5: 'MRNASEQ_CNMF'
| nPatients | CLUS_1 | CLUS_2 | CLUS_3 | CLUS_4 |
|---|---|---|---|---|
| ALL | 24 | 13 | 17 | 23 |
| AMP PEAK 14(16Q24.2) MUTATED | 5 | 10 | 13 | 16 |
| AMP PEAK 14(16Q24.2) WILD-TYPE | 19 | 3 | 4 | 7 |
Figure S19. Get High-res Image Gene #14: 'amp_16q24.2' versus Molecular Subtype #5: 'MRNASEQ_CNMF'
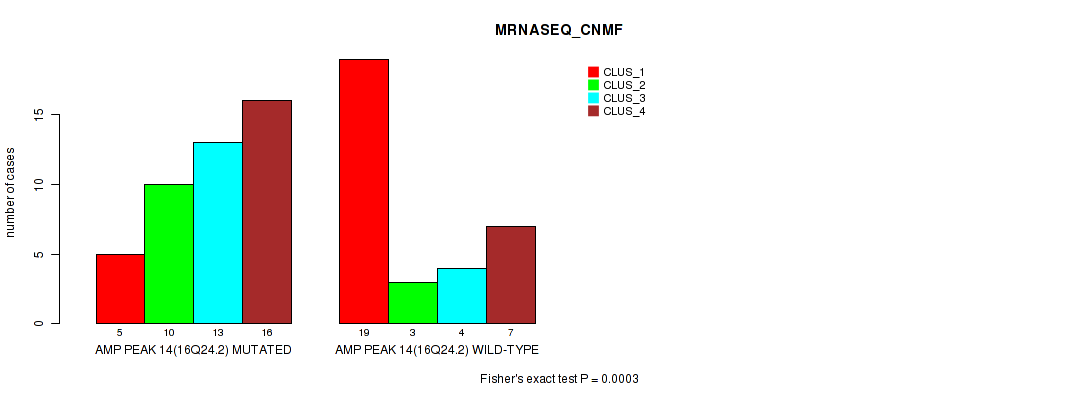
P value = 1e-05 (Fisher's exact test), Q value = 0.0046
Table S20. Gene #14: 'amp_16q24.2' versus Molecular Subtype #6: 'MRNASEQ_CHIERARCHICAL'
| nPatients | CLUS_1 | CLUS_2 | CLUS_3 | CLUS_4 |
|---|---|---|---|---|
| ALL | 23 | 23 | 7 | 24 |
| AMP PEAK 14(16Q24.2) MUTATED | 5 | 20 | 1 | 18 |
| AMP PEAK 14(16Q24.2) WILD-TYPE | 18 | 3 | 6 | 6 |
Figure S20. Get High-res Image Gene #14: 'amp_16q24.2' versus Molecular Subtype #6: 'MRNASEQ_CHIERARCHICAL'
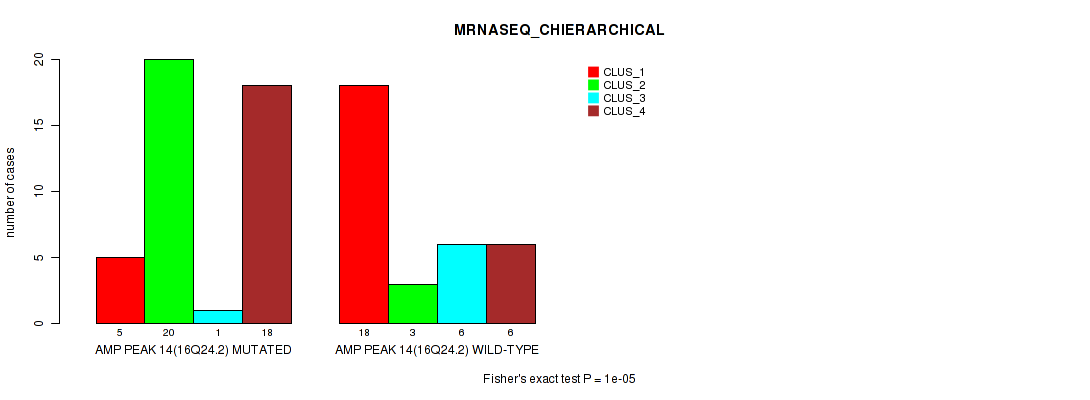
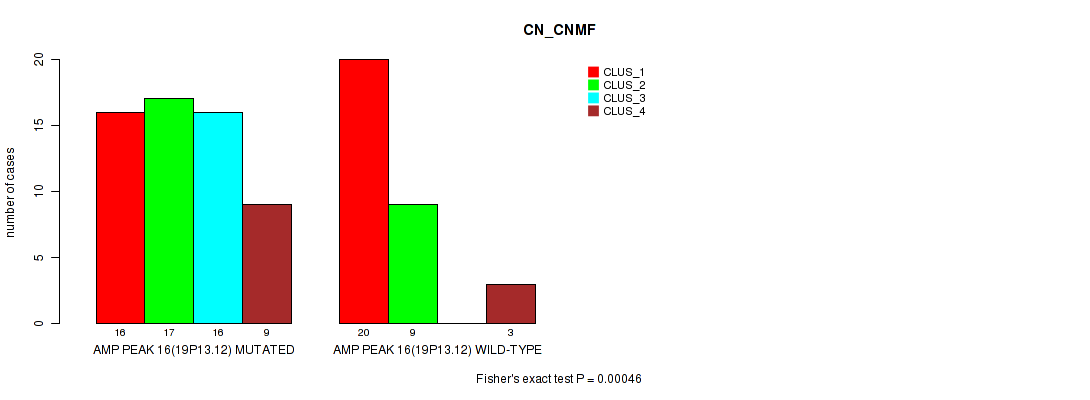
P value = 0.00046 (Fisher's exact test), Q value = 0.2
Table S21. Gene #16: 'amp_19p13.12' versus Molecular Subtype #1: 'CN_CNMF'
| nPatients | CLUS_1 | CLUS_2 | CLUS_3 | CLUS_4 |
|---|---|---|---|---|
| ALL | 36 | 26 | 16 | 12 |
| AMP PEAK 16(19P13.12) MUTATED | 16 | 17 | 16 | 9 |
| AMP PEAK 16(19P13.12) WILD-TYPE | 20 | 9 | 0 | 3 |
Figure S21. Get High-res Image Gene #16: 'amp_19p13.12' versus Molecular Subtype #1: 'CN_CNMF'
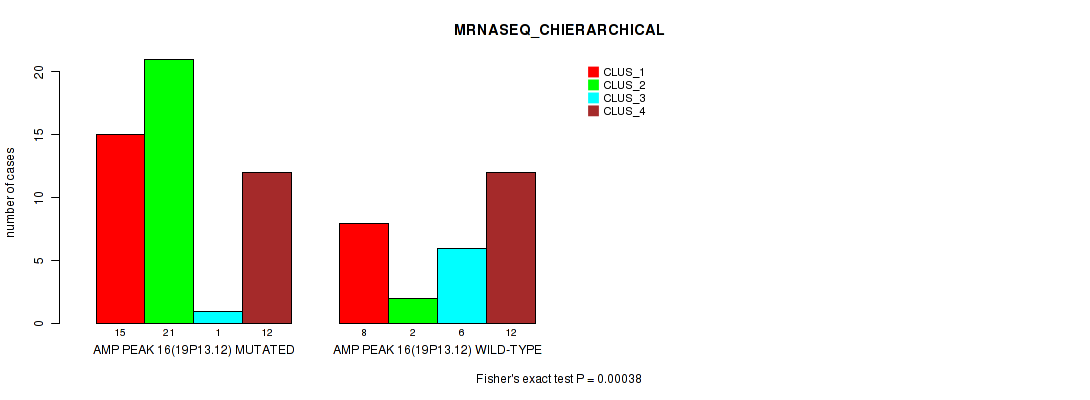
P value = 0.00038 (Fisher's exact test), Q value = 0.16
Table S22. Gene #16: 'amp_19p13.12' versus Molecular Subtype #6: 'MRNASEQ_CHIERARCHICAL'
| nPatients | CLUS_1 | CLUS_2 | CLUS_3 | CLUS_4 |
|---|---|---|---|---|
| ALL | 23 | 23 | 7 | 24 |
| AMP PEAK 16(19P13.12) MUTATED | 15 | 21 | 1 | 12 |
| AMP PEAK 16(19P13.12) WILD-TYPE | 8 | 2 | 6 | 12 |
Figure S22. Get High-res Image Gene #16: 'amp_19p13.12' versus Molecular Subtype #6: 'MRNASEQ_CHIERARCHICAL'
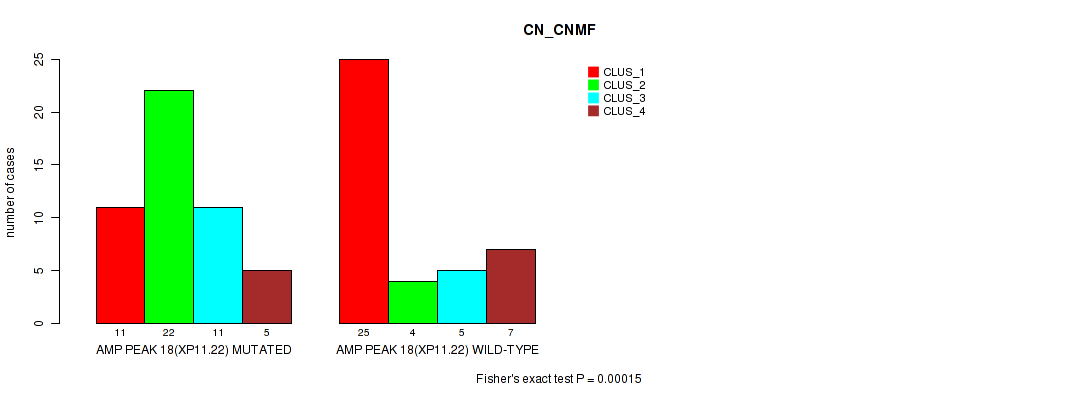
P value = 0.00015 (Fisher's exact test), Q value = 0.066
Table S23. Gene #18: 'amp_xp11.22' versus Molecular Subtype #1: 'CN_CNMF'
| nPatients | CLUS_1 | CLUS_2 | CLUS_3 | CLUS_4 |
|---|---|---|---|---|
| ALL | 36 | 26 | 16 | 12 |
| AMP PEAK 18(XP11.22) MUTATED | 11 | 22 | 11 | 5 |
| AMP PEAK 18(XP11.22) WILD-TYPE | 25 | 4 | 5 | 7 |
Figure S23. Get High-res Image Gene #18: 'amp_xp11.22' versus Molecular Subtype #1: 'CN_CNMF'
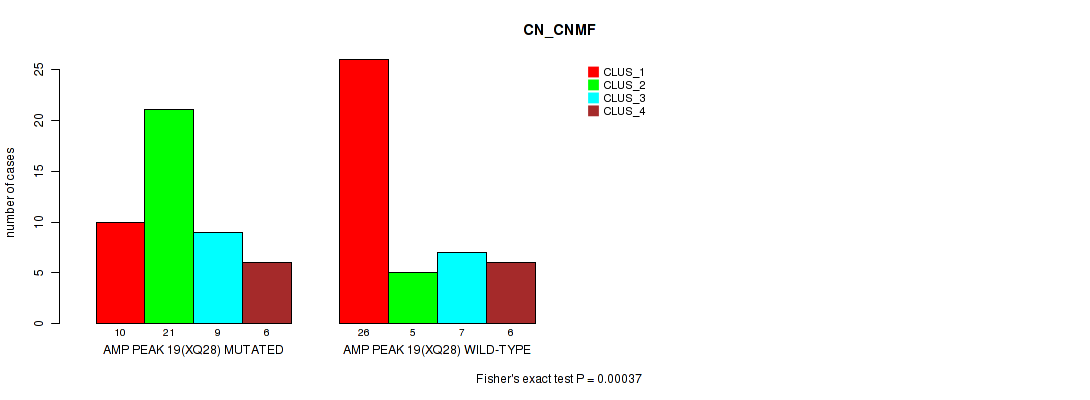
P value = 0.00037 (Fisher's exact test), Q value = 0.16
Table S24. Gene #19: 'amp_xq28' versus Molecular Subtype #1: 'CN_CNMF'
| nPatients | CLUS_1 | CLUS_2 | CLUS_3 | CLUS_4 |
|---|---|---|---|---|
| ALL | 36 | 26 | 16 | 12 |
| AMP PEAK 19(XQ28) MUTATED | 10 | 21 | 9 | 6 |
| AMP PEAK 19(XQ28) WILD-TYPE | 26 | 5 | 7 | 6 |
Figure S24. Get High-res Image Gene #19: 'amp_xq28' versus Molecular Subtype #1: 'CN_CNMF'
P value = 0.00011 (Fisher's exact test), Q value = 0.049
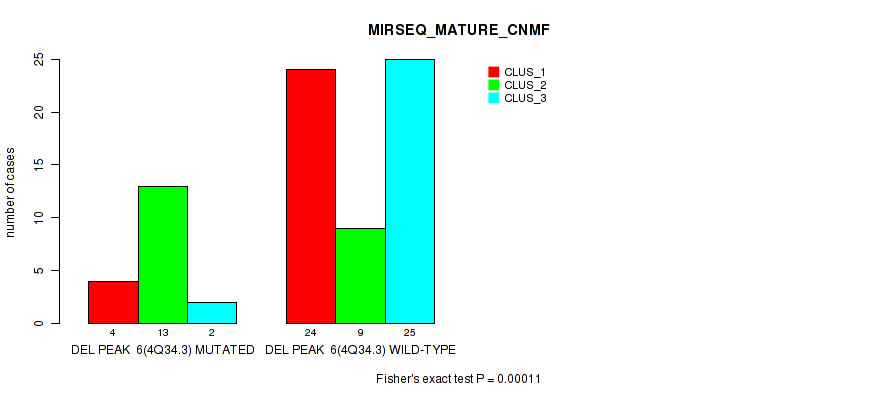
Table S25. Gene #25: 'del_4q34.3' versus Molecular Subtype #9: 'MIRSEQ_MATURE_CNMF'
| nPatients | CLUS_1 | CLUS_2 | CLUS_3 |
|---|---|---|---|
| ALL | 28 | 22 | 27 |
| DEL PEAK 6(4Q34.3) MUTATED | 4 | 13 | 2 |
| DEL PEAK 6(4Q34.3) WILD-TYPE | 24 | 9 | 25 |
Figure S25. Get High-res Image Gene #25: 'del_4q34.3' versus Molecular Subtype #9: 'MIRSEQ_MATURE_CNMF'
P value = 0.00012 (Fisher's exact test), Q value = 0.053
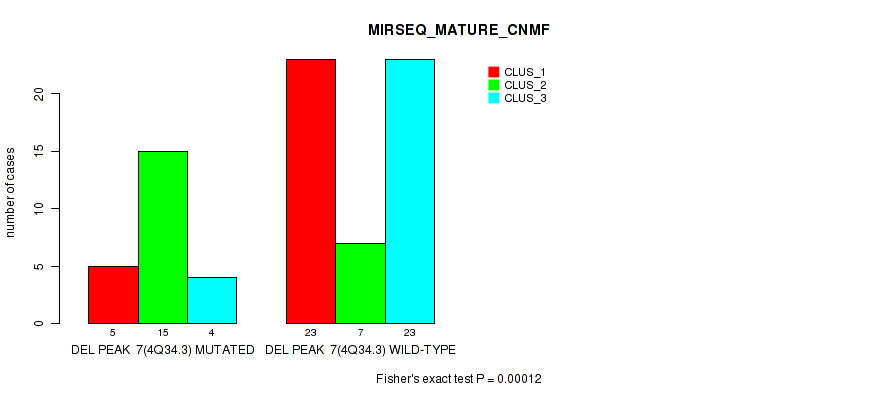
Table S26. Gene #26: 'del_4q34.3' versus Molecular Subtype #9: 'MIRSEQ_MATURE_CNMF'
| nPatients | CLUS_1 | CLUS_2 | CLUS_3 |
|---|---|---|---|
| ALL | 28 | 22 | 27 |
| DEL PEAK 7(4Q34.3) MUTATED | 5 | 15 | 4 |
| DEL PEAK 7(4Q34.3) WILD-TYPE | 23 | 7 | 23 |
Figure S26. Get High-res Image Gene #26: 'del_4q34.3' versus Molecular Subtype #9: 'MIRSEQ_MATURE_CNMF'
P value = 3e-05 (Fisher's exact test), Q value = 0.013
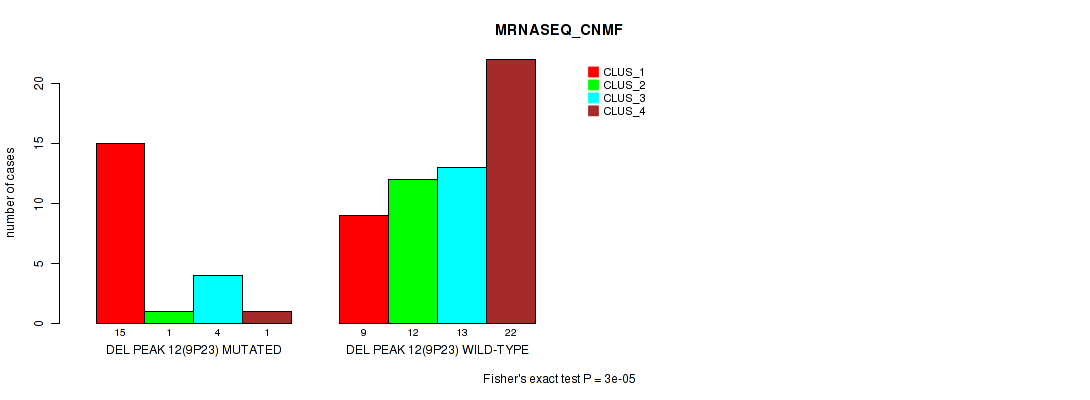
Table S27. Gene #31: 'del_9p23' versus Molecular Subtype #5: 'MRNASEQ_CNMF'
| nPatients | CLUS_1 | CLUS_2 | CLUS_3 | CLUS_4 |
|---|---|---|---|---|
| ALL | 24 | 13 | 17 | 23 |
| DEL PEAK 12(9P23) MUTATED | 15 | 1 | 4 | 1 |
| DEL PEAK 12(9P23) WILD-TYPE | 9 | 12 | 13 | 22 |
Figure S27. Get High-res Image Gene #31: 'del_9p23' versus Molecular Subtype #5: 'MRNASEQ_CNMF'
P value = 2e-05 (Fisher's exact test), Q value = 0.0089
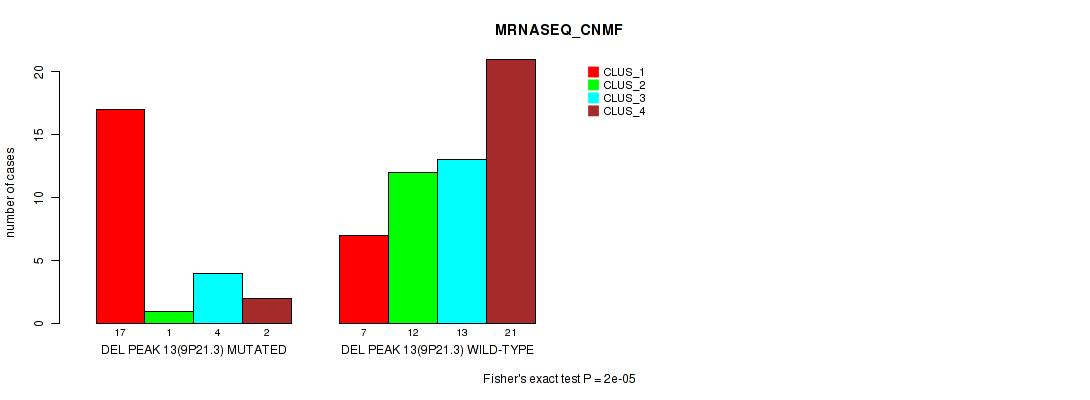
Table S28. Gene #32: 'del_9p21.3' versus Molecular Subtype #5: 'MRNASEQ_CNMF'
| nPatients | CLUS_1 | CLUS_2 | CLUS_3 | CLUS_4 |
|---|---|---|---|---|
| ALL | 24 | 13 | 17 | 23 |
| DEL PEAK 13(9P21.3) MUTATED | 17 | 1 | 4 | 2 |
| DEL PEAK 13(9P21.3) WILD-TYPE | 7 | 12 | 13 | 21 |
Figure S28. Get High-res Image Gene #32: 'del_9p21.3' versus Molecular Subtype #5: 'MRNASEQ_CNMF'
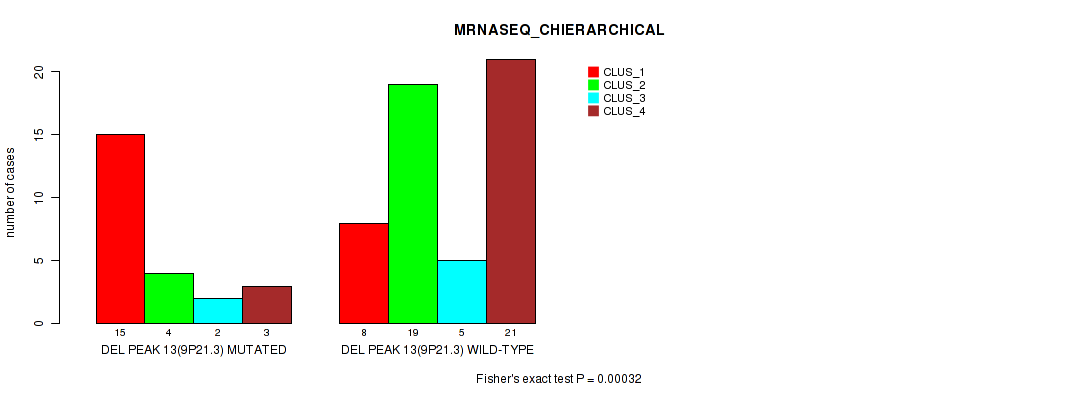
P value = 0.00032 (Fisher's exact test), Q value = 0.14
Table S29. Gene #32: 'del_9p21.3' versus Molecular Subtype #6: 'MRNASEQ_CHIERARCHICAL'
| nPatients | CLUS_1 | CLUS_2 | CLUS_3 | CLUS_4 |
|---|---|---|---|---|
| ALL | 23 | 23 | 7 | 24 |
| DEL PEAK 13(9P21.3) MUTATED | 15 | 4 | 2 | 3 |
| DEL PEAK 13(9P21.3) WILD-TYPE | 8 | 19 | 5 | 21 |
Figure S29. Get High-res Image Gene #32: 'del_9p21.3' versus Molecular Subtype #6: 'MRNASEQ_CHIERARCHICAL'
-
Copy number data file = transformed.cor.cli.txt
-
Molecular subtype file = ACC-TP.transferedmergedcluster.txt
-
Number of patients = 90
-
Number of significantly focal cnvs = 46
-
Number of molecular subtypes = 10
-
Exclude genes that fewer than K tumors have alterations, K = 3
For binary or multi-class clinical features (nominal or ordinal), two-tailed Fisher's exact tests (Fisher 1922) were used to estimate the P values using the 'fisher.test' function in R
For multiple hypothesis correction, Q value is the False Discovery Rate (FDR) analogue of the P value (Benjamini and Hochberg 1995), defined as the minimum FDR at which the test may be called significant. We used the 'Benjamini and Hochberg' method of 'p.adjust' function in R to convert P values into Q values.
In addition to the links below, the full results of the analysis summarized in this report can also be downloaded programmatically using firehose_get, or interactively from either the Broad GDAC website or TCGA Data Coordination Center Portal.